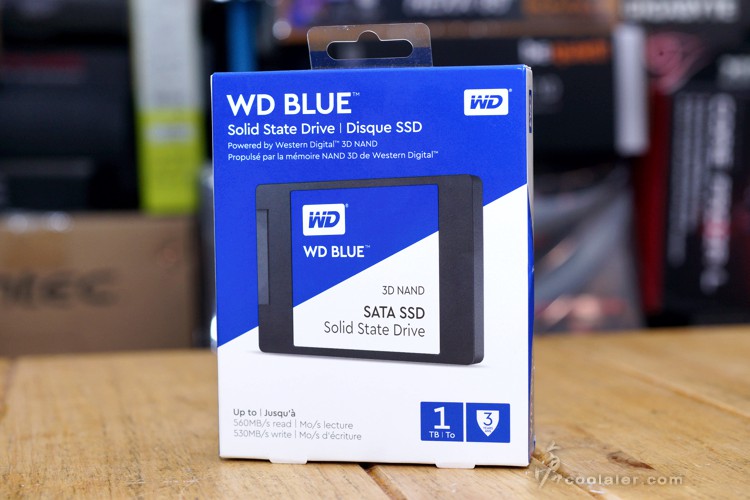
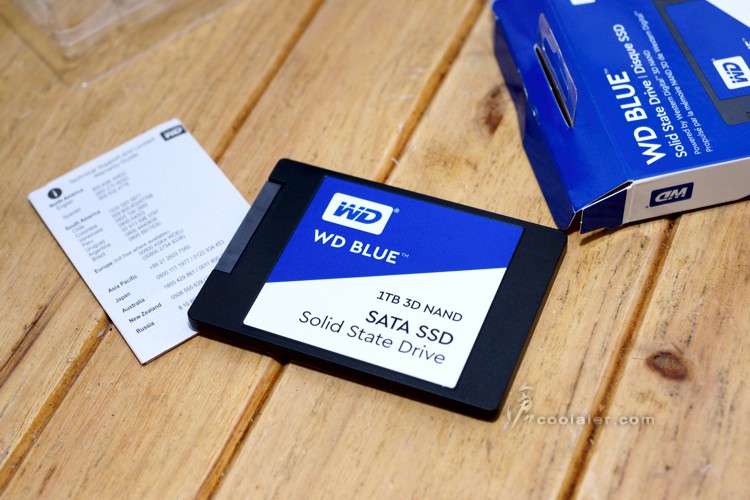
WD 最近推出了新 Blue 系列 SSD,與先前的 Blue SSD 差在新的使用了 3D NAND 顆粒,也是型號上所強調的,所以兩款雖然長得很像,但實際上還是有差異,另外新款因為顆粒採大容量3D堆疊的方式,所以整體容量也推升最高至 2TB(先前的 Blue 最高則是僅提供 1TB)。
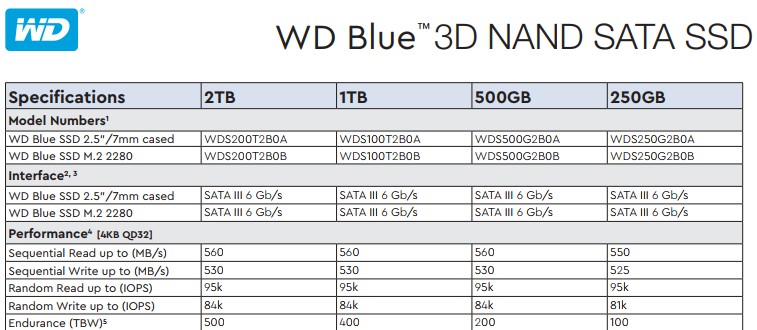
WD Blue SSD 3D NAND 系列提供250GB、500GB、1TB、2TB四款容量,採用 SATA 介面,提供2.5吋以及M.2兩種尺寸,效能受限於頻寬的關係,與前一代相比,並沒有過多的效能提升,讀取最高為560MB/s,寫入530MB/s,4K隨機讀取效能為95,000IOPS,寫入84,000IOPS,TBW 總寫輛依容量分別為100、200、400以及500,效能與總寫量與先前推出的 Blue 系列差不多是一樣的,保固的部分皆為三年。
外觀幾乎與先前推出的 Blue SSD 是一樣的,新的外觀上面有加註 3D NAND 的字樣。
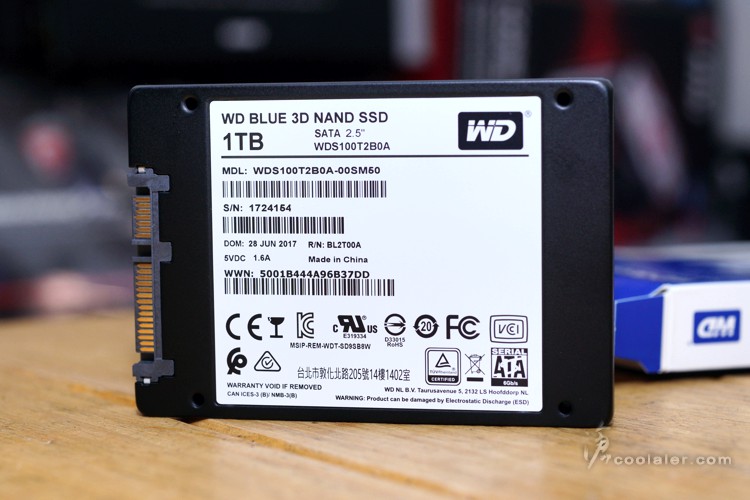
WD Blue SSD 3D NAND 採用 Marvell 88SS1074 主控晶片,顆粒則是搭配 SanDisk 3D NAND TLC。
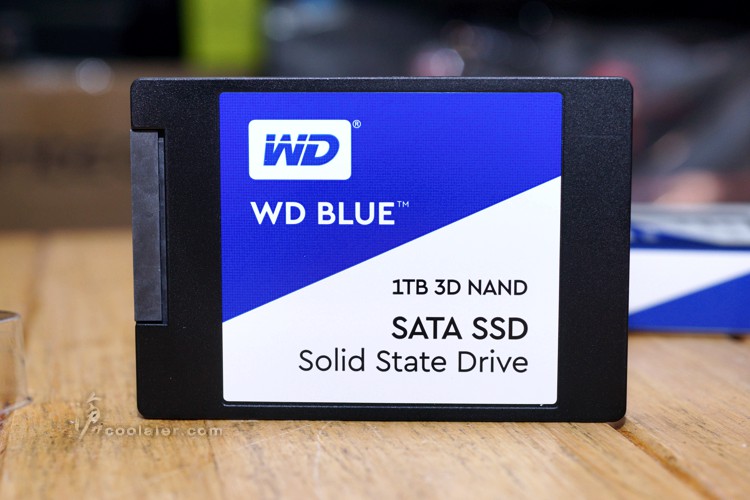
入手的這款容量為1TB。
測試平台
CPU: Intel Core i7-7820X
CPU Cooler: Cooler Master Nepton 240M
RAM: GSKILL DDR4 3600 8GBx4
MB: GIGABYTE X299 AORUS Gaming 7
VGA: MSI RX 460 2GB
HDD: OCZ TRION 150 480GB(OS)、WD Blue SSD 3D NAND 1TB
PSU: INWIN SI-1065W
OS: Windows 10 64bit
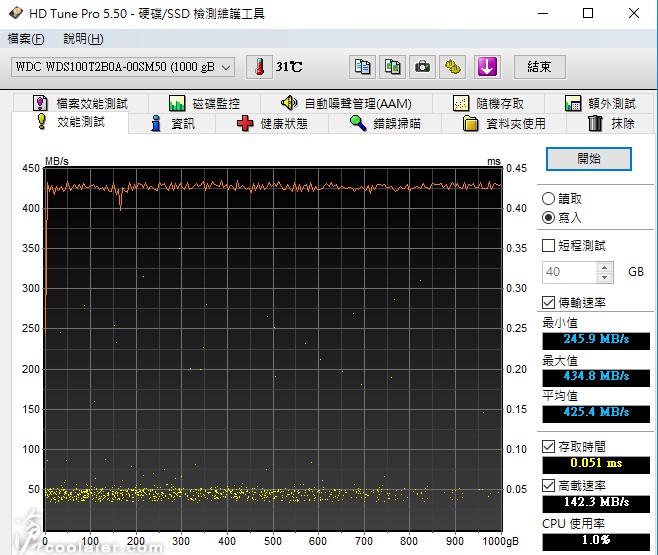
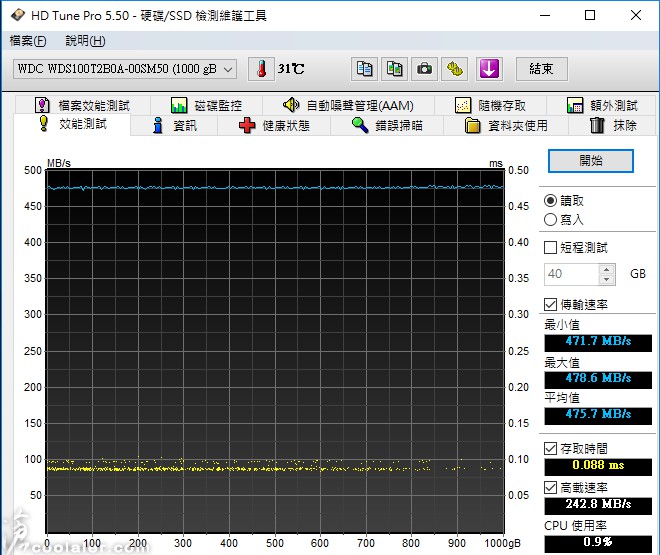
HD Tune Pro
平均寫入:425.4 MB/s
平均讀取:475.7 MB/s
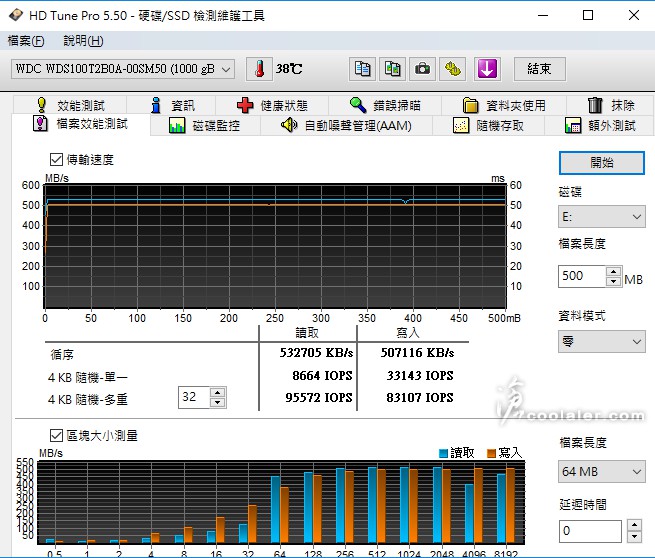
檔案效能測試
讀取:520 MB/s
寫入:495 MB/s
4K隨機讀取:95572 IOPS
4K隨機寫入:83107 IOPS
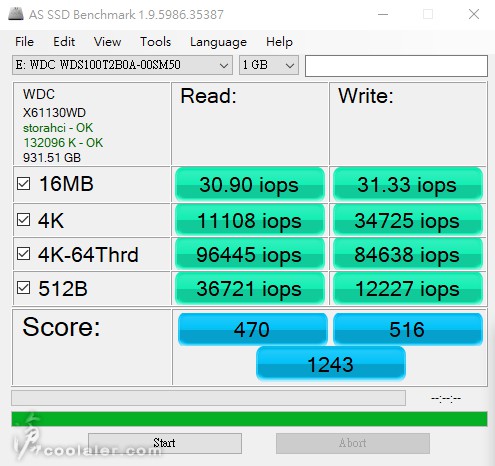
AS SSD Benchmark
讀取:494.46 MB/s
寫入:501.23 MB/s
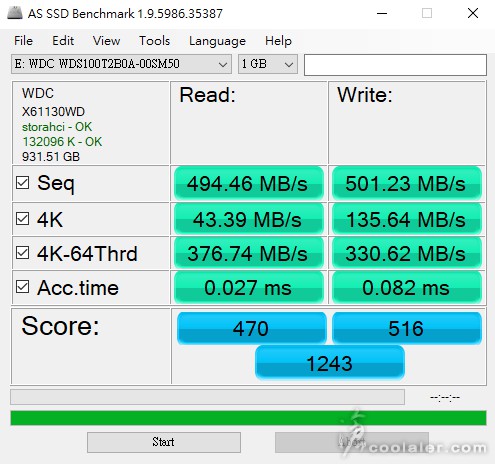
IOPS顯示
4K-64Thrd 讀取:96,445 IOPS
4K-64Thrd 寫入:84,638 IOPS
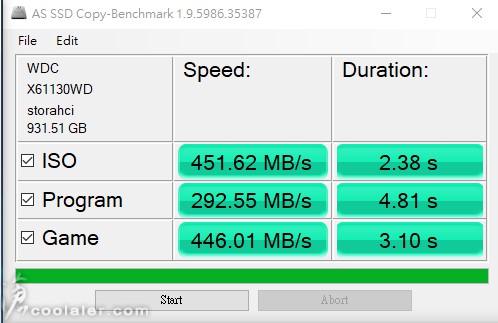
Copy-Benchmark
ISO:451.62 MB/s
Program:292.55 MB/s
Game:446.01 MB/s
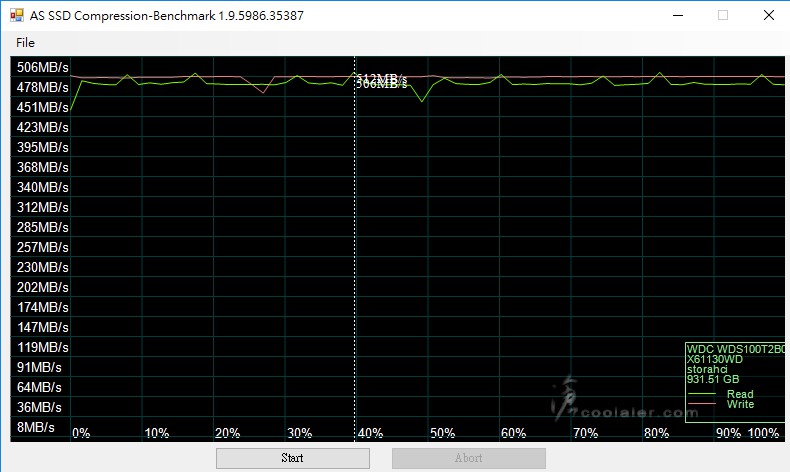
Compression-Benchmark
讀取最高約512MB/s,寫入506MB/s
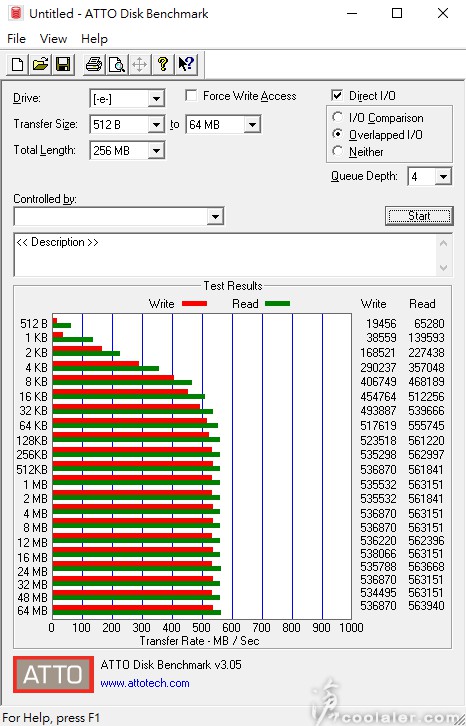
ATTO Disk Benchmark
讀取最大551 MB/s,寫入最大525 MB/s。
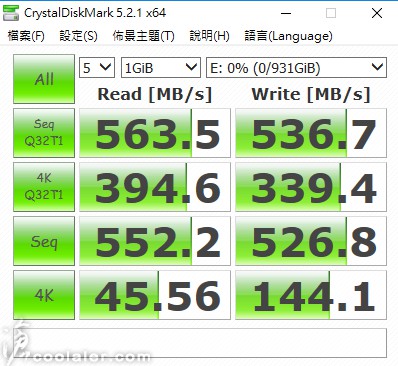
CrystalDiskMark x64
隨機讀寫測試,Seq讀取最大563.5 MB/s,寫入最大536.7 MB/s。
4K Q32換算成IOPS讀取為 101,017 IOPS,寫入 86,886 IOPS。
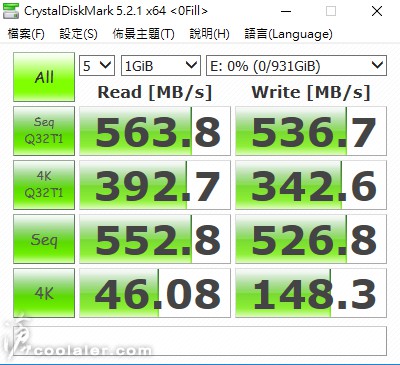
0Fill,Seq讀取最大563.8 MB/s,寫入最大536.7MB/s。
4K Q32換算成IOPS讀取為 100,531 IOPS,寫入 87,706 IOPS。
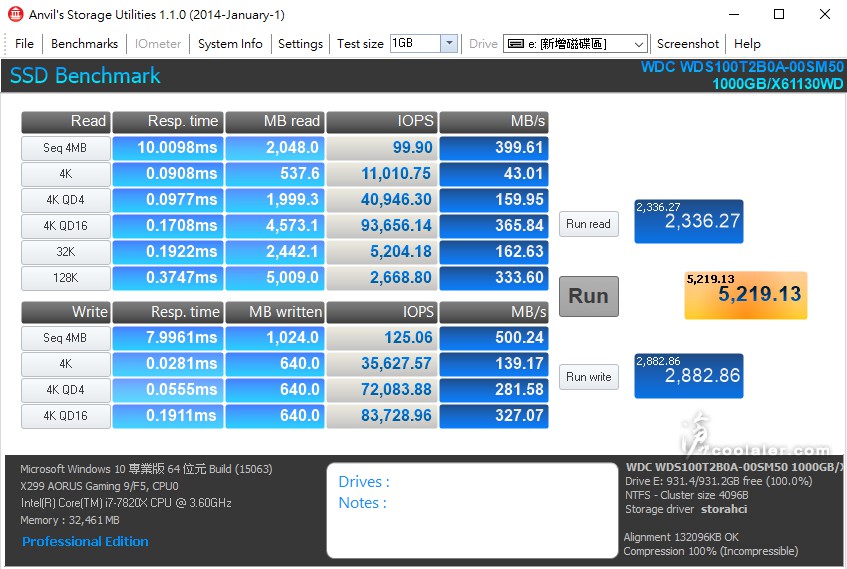
Anvil's Storage Utilities
讀取最快為399.61 MB/s,寫入最快為500.24 MB/s。
4K QD16 讀取為 93,656 IOPS,寫入為 83,728 IOPS。
小結
以上測試,WD Blue SSD 3D NAND 1TB 效能最高皆超過官方給的數據,讀取最大為563MB/s,寫入536MB/s,4K讀取最高甚至突破100K IOPS,寫入也有87K IOPS,以 SATA 介面來看傳輸效率算是相當不錯,至於 TLC,這就不要過於糾結了,畢竟現在大多是 TLC 為主,相對於 MLC 在價格上會較為便宜。
WD Blue SSD 3D NAND 系列提供250GB、500GB、1TB、2TB四款容量,採用 SATA 介面,提供2.5吋以及M.2兩種尺寸,效能受限於頻寬的關係,與前一代相比,並沒有過多的效能提升,讀取最高為560MB/s,寫入530MB/s,4K隨機讀取效能為95,000IOPS,寫入84,000IOPS,TBW 總寫輛依容量分別為100、200、400以及500,效能與總寫量與先前推出的 Blue 系列差不多是一樣的,保固的部分皆為三年。
外觀幾乎與先前推出的 Blue SSD 是一樣的,新的外觀上面有加註 3D NAND 的字樣。
WD Blue SSD 3D NAND 採用 Marvell 88SS1074 主控晶片,顆粒則是搭配 SanDisk 3D NAND TLC。
入手的這款容量為1TB。
測試平台
CPU: Intel Core i7-7820X
CPU Cooler: Cooler Master Nepton 240M
RAM: GSKILL DDR4 3600 8GBx4
MB: GIGABYTE X299 AORUS Gaming 7
VGA: MSI RX 460 2GB
HDD: OCZ TRION 150 480GB(OS)、WD Blue SSD 3D NAND 1TB
PSU: INWIN SI-1065W
OS: Windows 10 64bit
HD Tune Pro
平均寫入:425.4 MB/s
平均讀取:475.7 MB/s
檔案效能測試
讀取:520 MB/s
寫入:495 MB/s
4K隨機讀取:95572 IOPS
4K隨機寫入:83107 IOPS
AS SSD Benchmark
讀取:494.46 MB/s
寫入:501.23 MB/s
IOPS顯示
4K-64Thrd 讀取:96,445 IOPS
4K-64Thrd 寫入:84,638 IOPS
Copy-Benchmark
ISO:451.62 MB/s
Program:292.55 MB/s
Game:446.01 MB/s
Compression-Benchmark
讀取最高約512MB/s,寫入506MB/s
ATTO Disk Benchmark
讀取最大551 MB/s,寫入最大525 MB/s。
CrystalDiskMark x64
隨機讀寫測試,Seq讀取最大563.5 MB/s,寫入最大536.7 MB/s。
4K Q32換算成IOPS讀取為 101,017 IOPS,寫入 86,886 IOPS。
0Fill,Seq讀取最大563.8 MB/s,寫入最大536.7MB/s。
4K Q32換算成IOPS讀取為 100,531 IOPS,寫入 87,706 IOPS。
Anvil's Storage Utilities
讀取最快為399.61 MB/s,寫入最快為500.24 MB/s。
4K QD16 讀取為 93,656 IOPS,寫入為 83,728 IOPS。
小結
以上測試,WD Blue SSD 3D NAND 1TB 效能最高皆超過官方給的數據,讀取最大為563MB/s,寫入536MB/s,4K讀取最高甚至突破100K IOPS,寫入也有87K IOPS,以 SATA 介面來看傳輸效率算是相當不錯,至於 TLC,這就不要過於糾結了,畢竟現在大多是 TLC 為主,相對於 MLC 在價格上會較為便宜。