此篇針對 Intel 新一代的 Core i9-12900K 進行測試,並比較前兩代的 Core i9-11900K 以及 Core i9-10900K,沒有針對 AMD 平台,因為手上並沒有比較適合的處理器。看看這次 Intel 12代帶來不同大小核心架構以及 Intel 7 製程(10nm)有甚麼樣的有感效能。
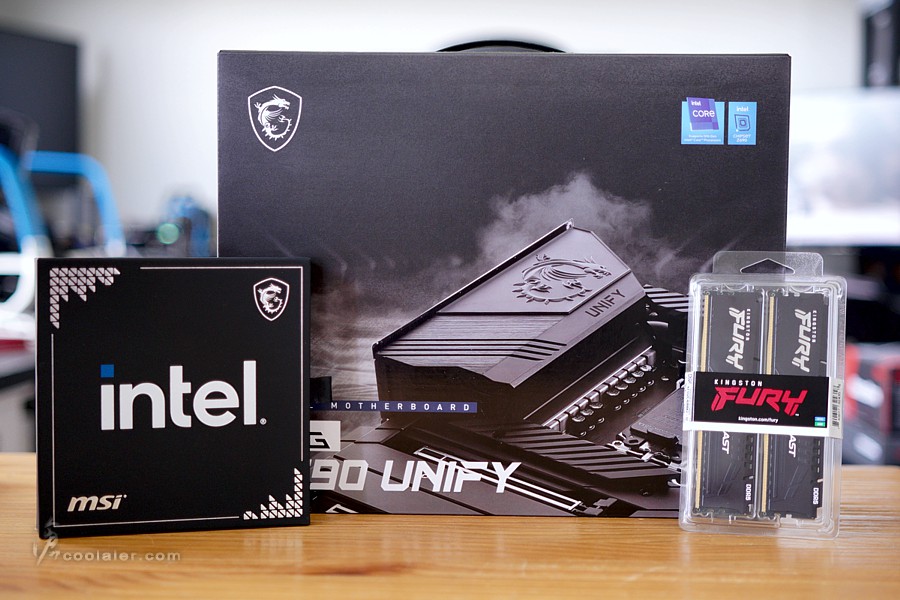
關於開箱以及產品細節可以參考之前所發的文章 MSI MEG Z690 UNIFY + Core i9-12900K + Kingston FURY DDR5 5200 開箱 。
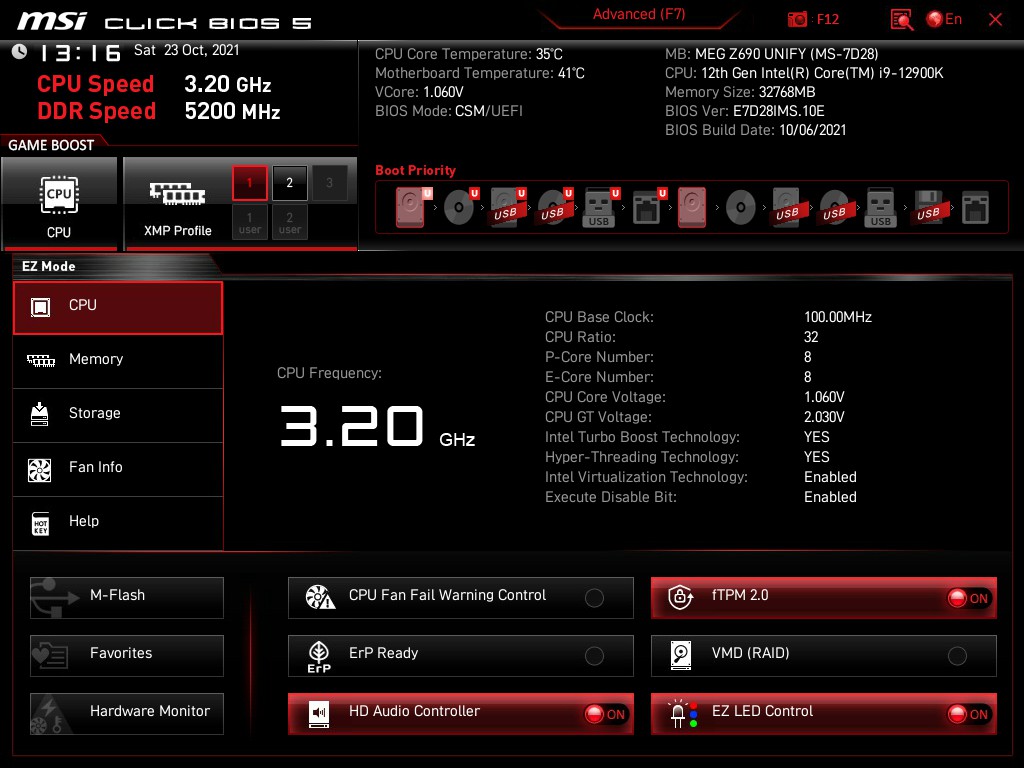
測試之前先來看看 MEG Z690 UNIFY BIOS 的部分。
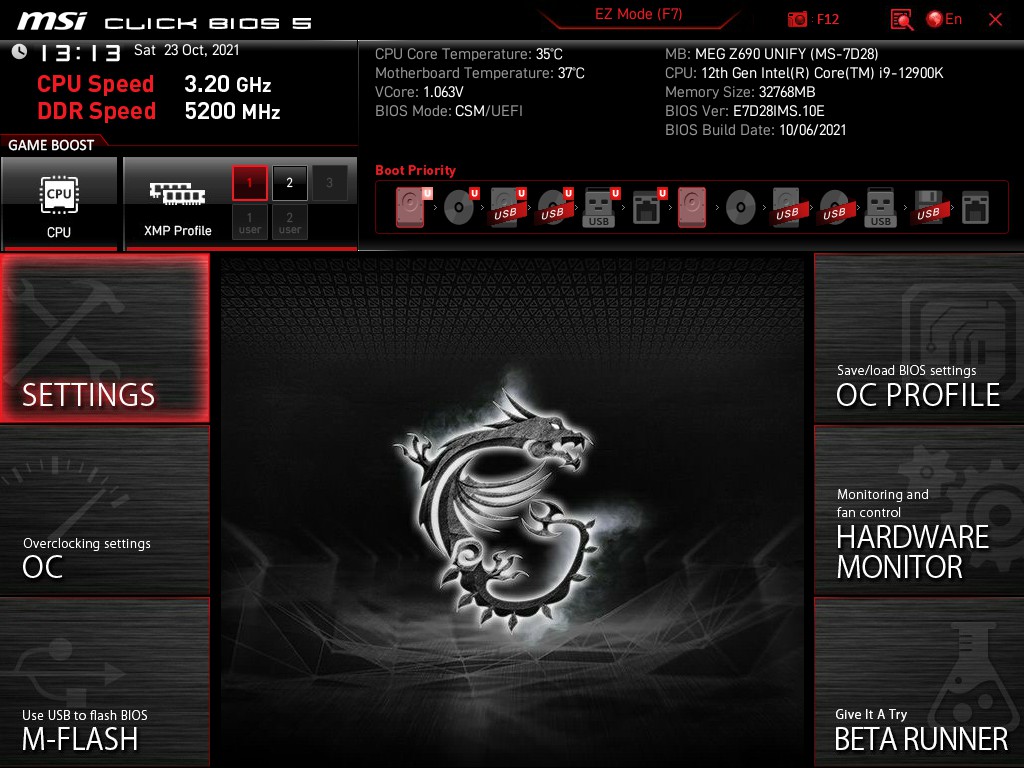
BIOS簡介
整體 BIOS 介面沒有太大的改變,可以看到 XMP Profile 有五組,有兩組是可以自設儲存調用。
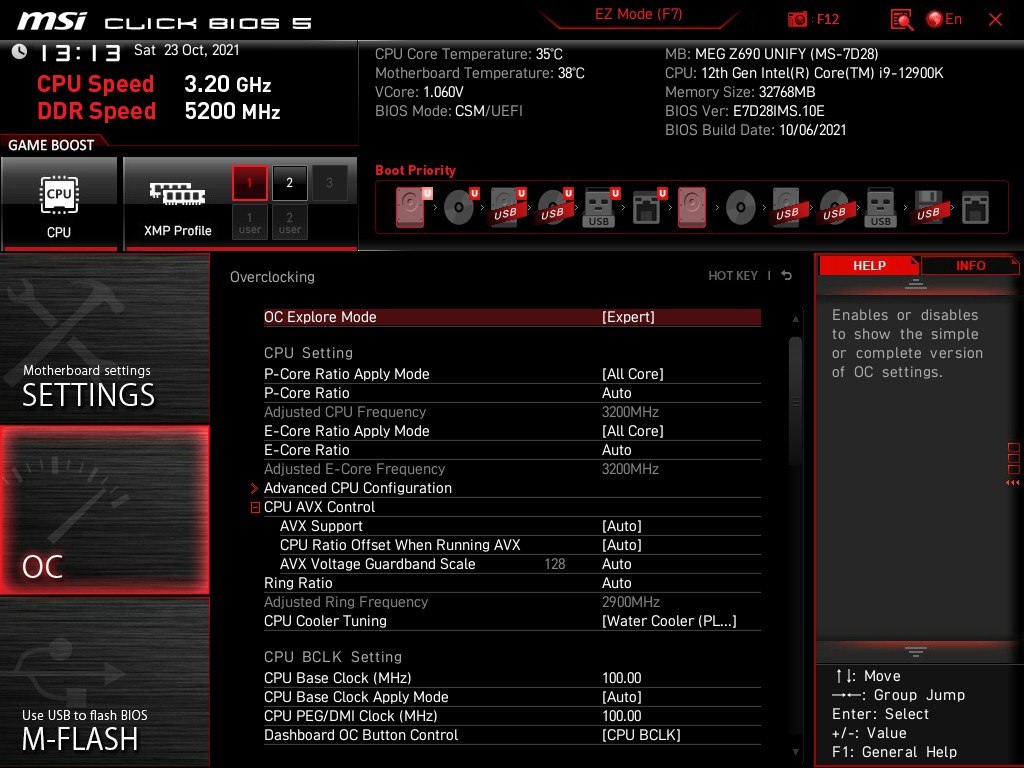
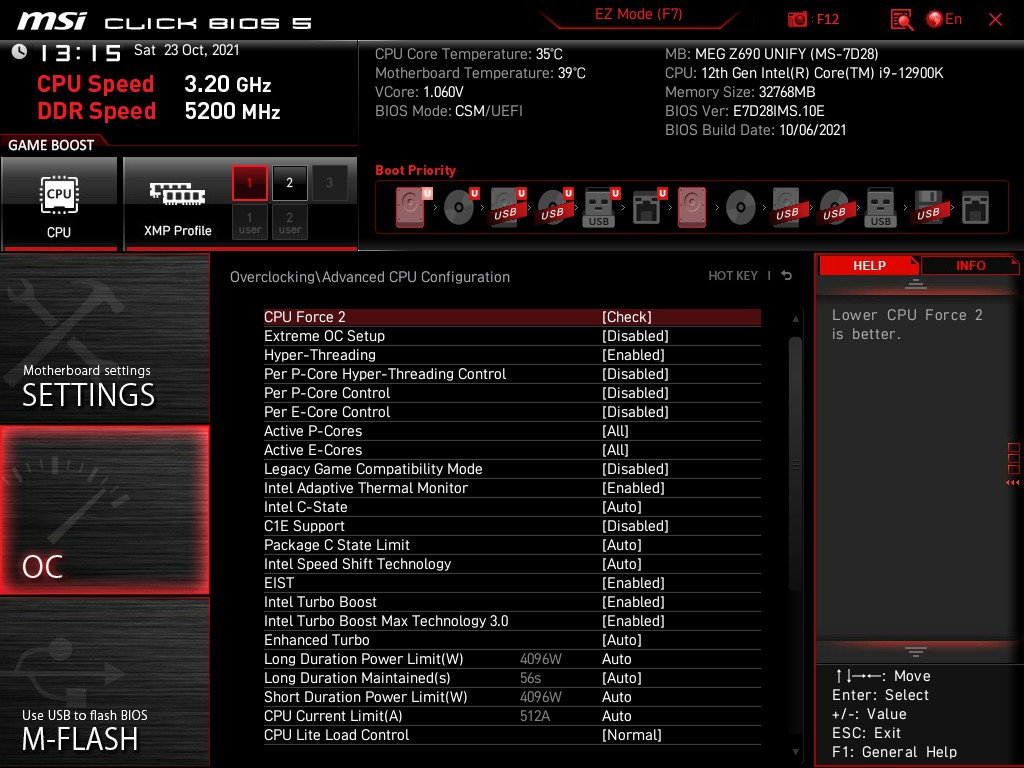
超頻選項,P-Core 大核心與 E-Core 小核心可以個別調整,CPU Cooler Tuning 選擇散熱器就能解鎖更高效能,這也算是一種超頻,但如果你是原廠散熱器去選水冷那也並不會達到更好的效能就是。
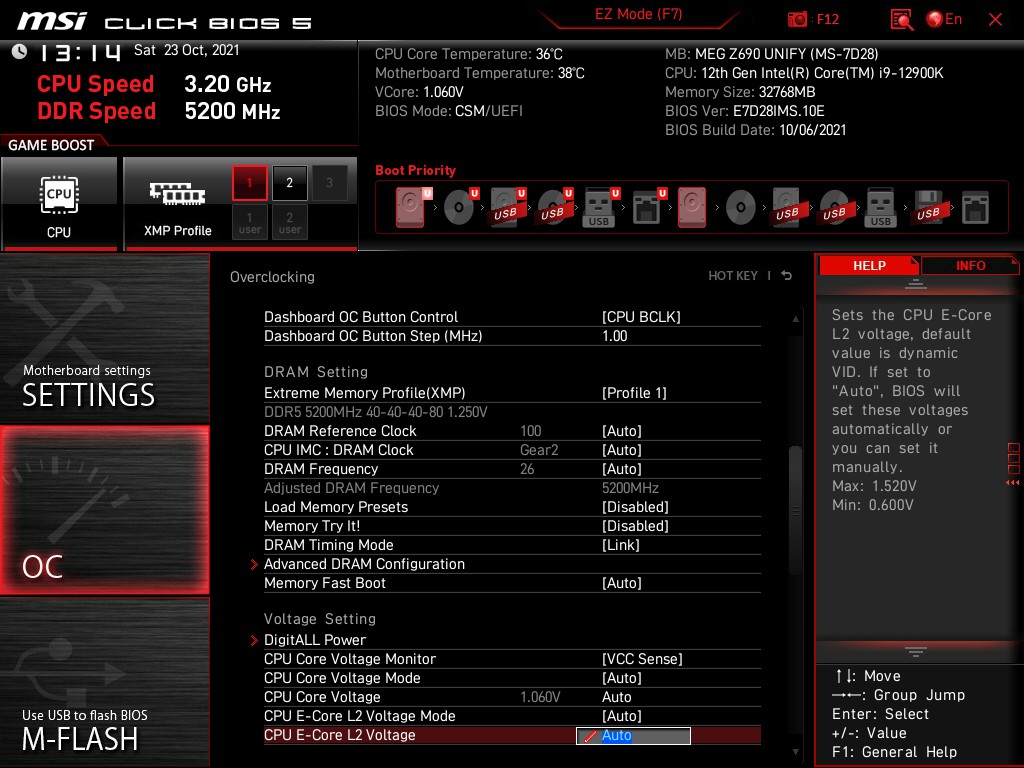
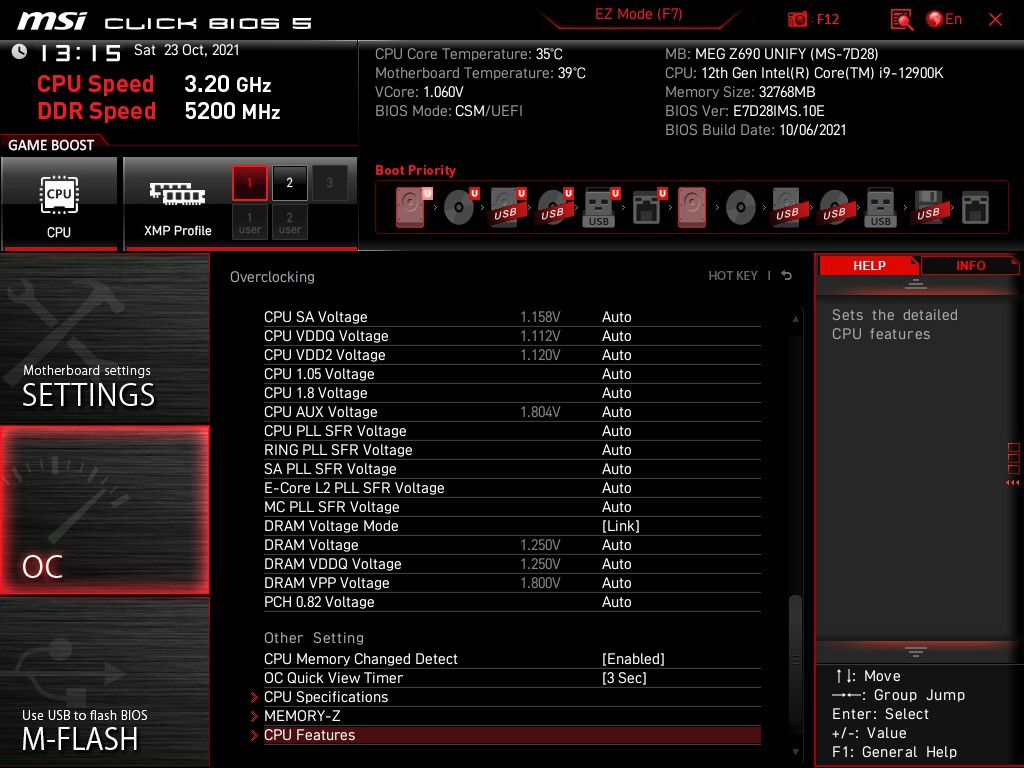
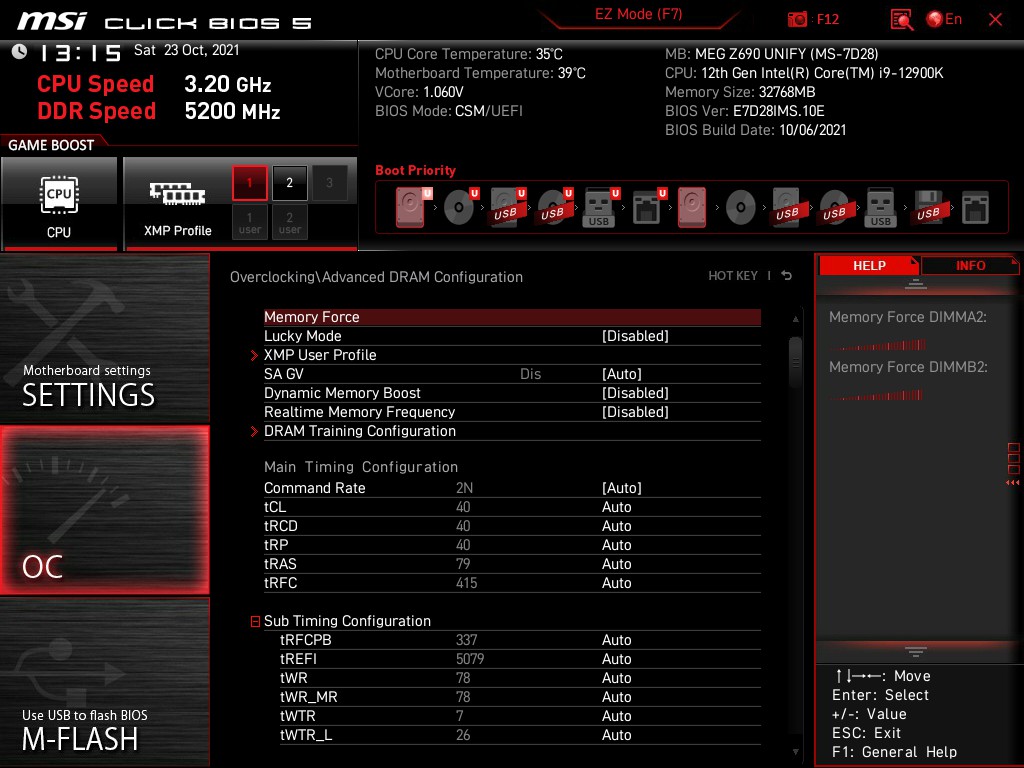
記憶體選項雖然有 Gear 檔位可選,但 MSI 板子很簡單,多數直設 Auto 就可以。電壓的部分也是很完整,甚至能針對小核心 E-Core 微調。
進階 CPU 選項。
記憶體參數調整。
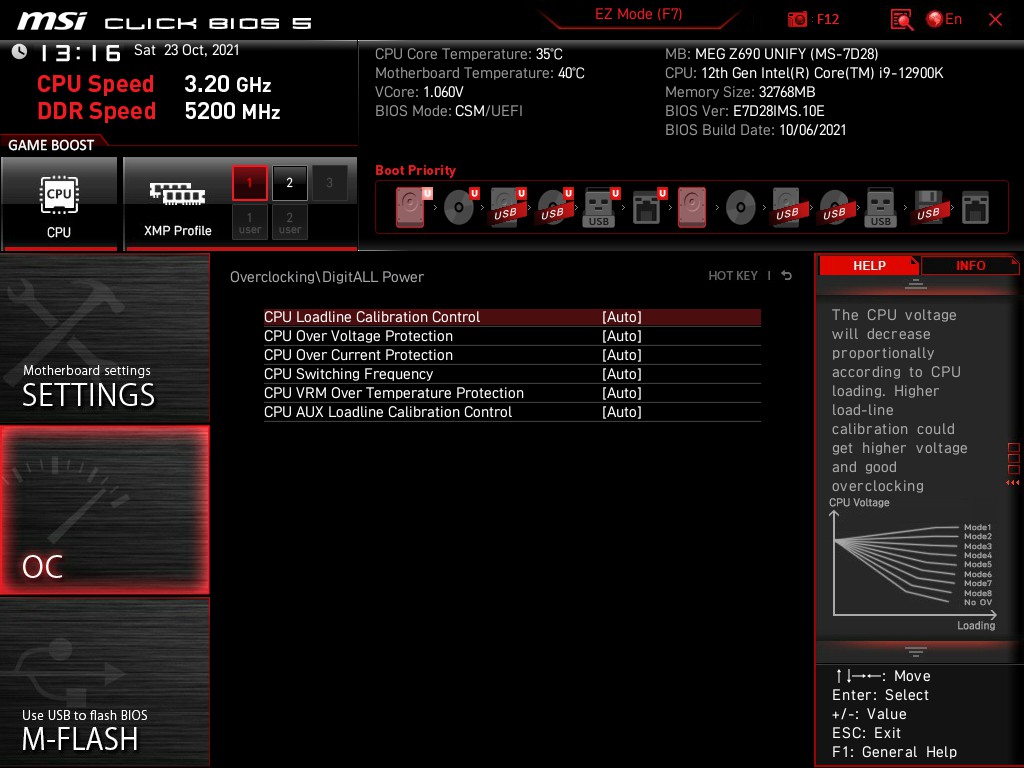
DigitALL Power 電源選項。
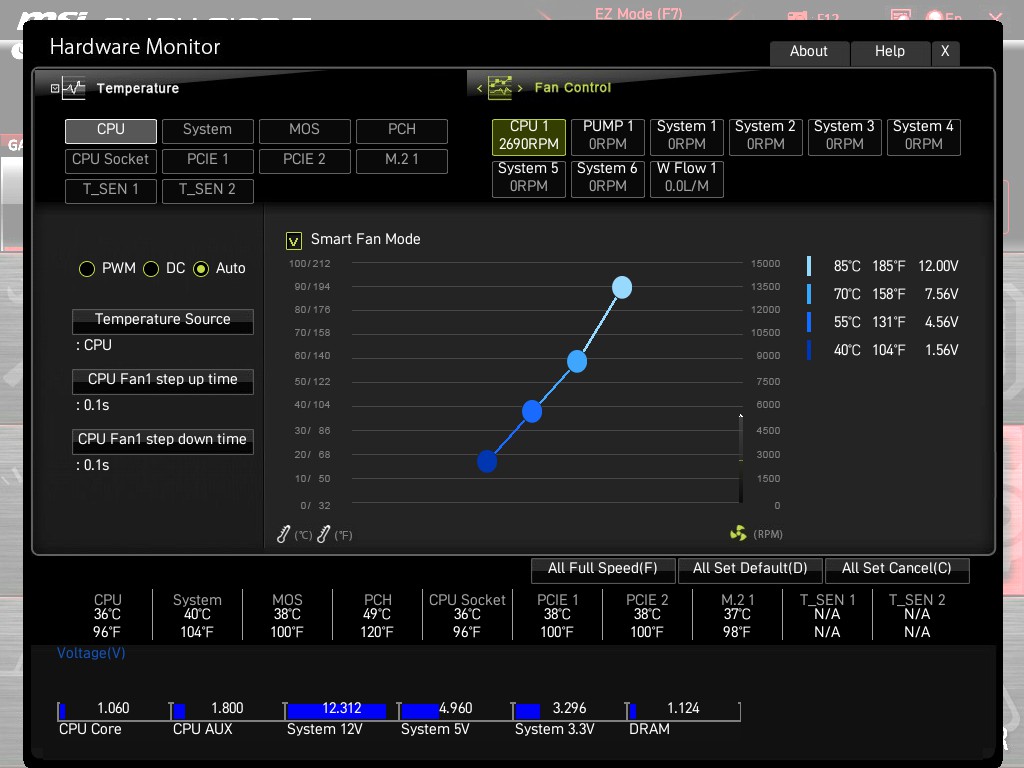
Hardware Monitor,調整風扇轉速與溫度對應。
簡易模式畫面。
測試平台
CPU: Intel Core i9-12900K、11900K、10900K
CPU Cooler: MSI MEG CORELIQUID S360
RAM: Kingston FURY DDR5 5200MHz 16GBx2 / TT DDR4 4400MHz 8GBx2
MB: MSI MEG Z690 UNIFY / MSI MEG Z590 UNIFY
VGA: MSI RTX 3070 GAMING X TRIO
SSD: GIGABYTE AORUS NVMe Gen4 SSD 1TB
PSU: IN WIN SI 1065W
OS: Windows 11
使用平台如上列,Z590 搭配使用 DDR4 記憶體,11900K 直開 ABT 自動超頻,系統一樣是 Windows 11。以下為了節省一些版面方便閱讀,比較就直接上圖表,只有 Core i9-12900K 上測試截圖還請見諒,如果有需要其他測試圖可以留言告知。
核心與時脈
Intel Core i9-12900K:8c+8C24T / 3.2~5.2GHz(P-Core)
Intel Core i9-11900K:8C16T / 3.5~5.3GHz
Intel Core i9-10900K:10C20T / 3.7~5.3GHz
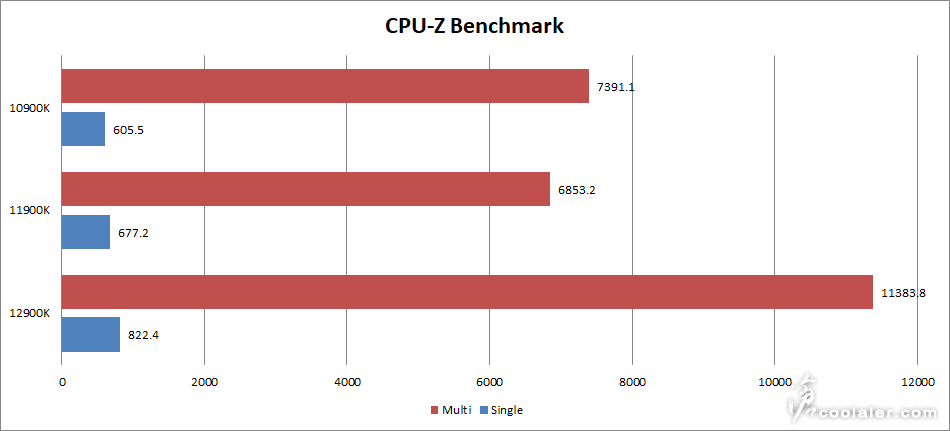
CPU-Z
CPU Single:822.4
CPU Multi:11383.8
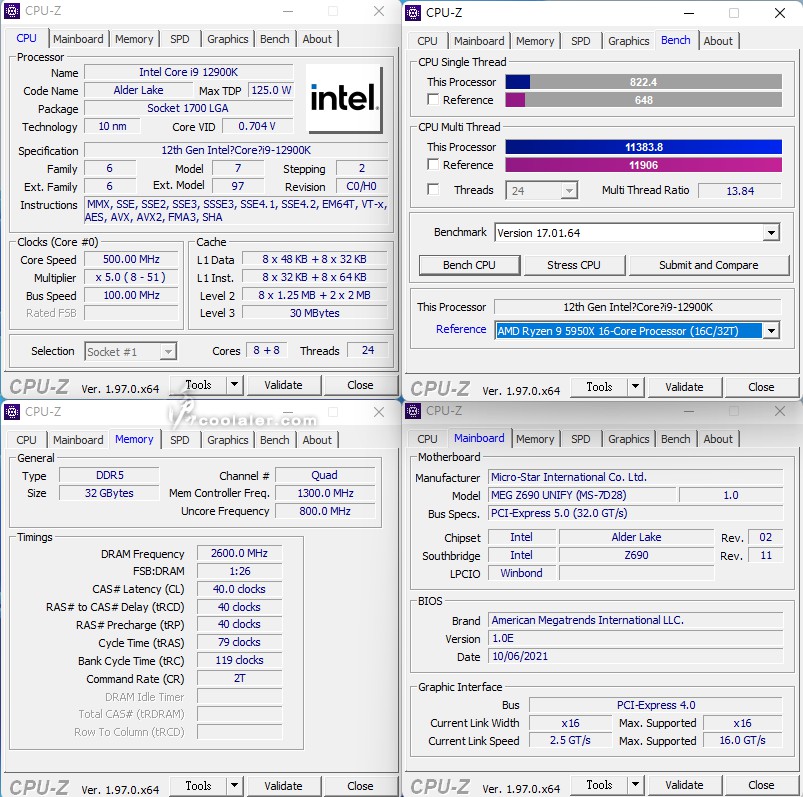
單核心效能 12900K 相較於 11900K 提升了21.4%,多核心提升了66.1%,相比 10C20T 的 10900K 也要多出了54%。
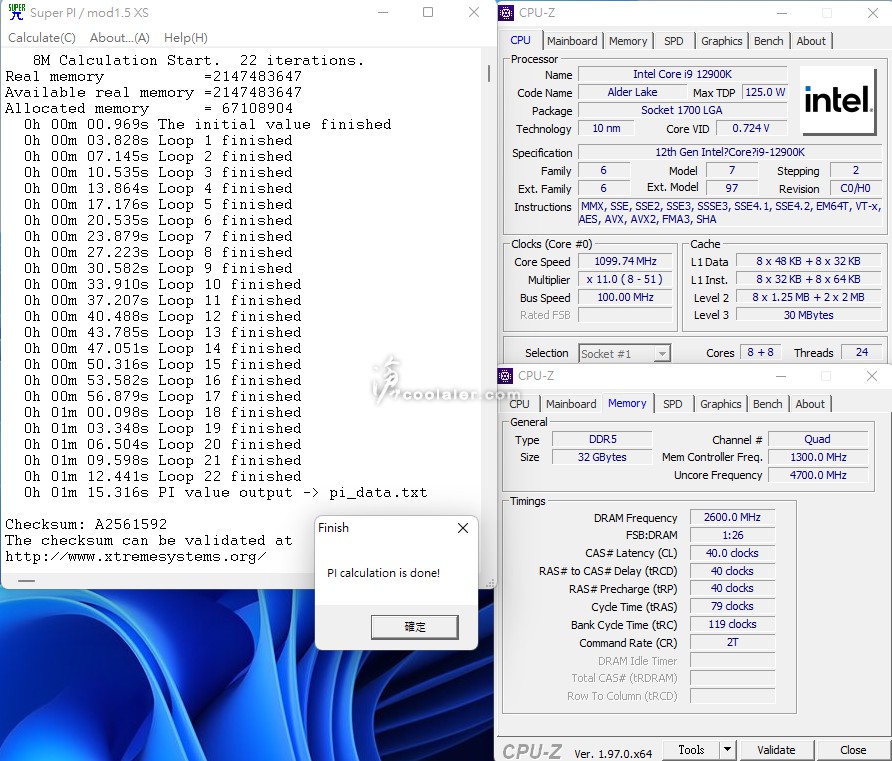
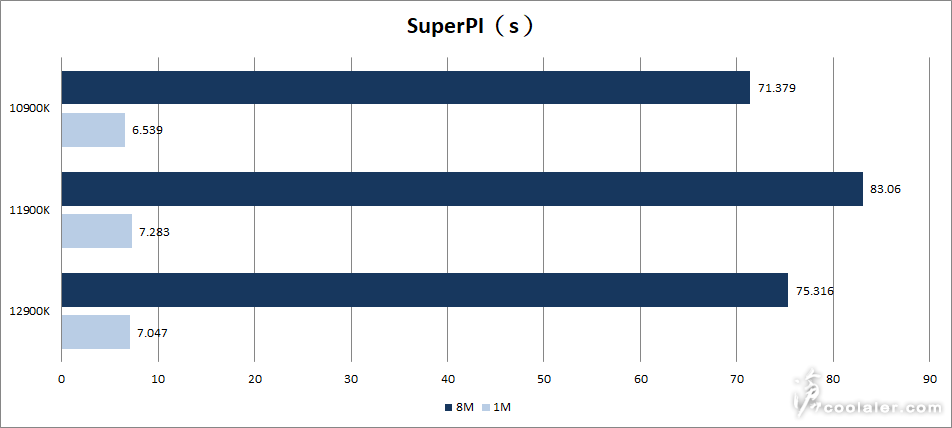
SuperPI 1M:7.047s
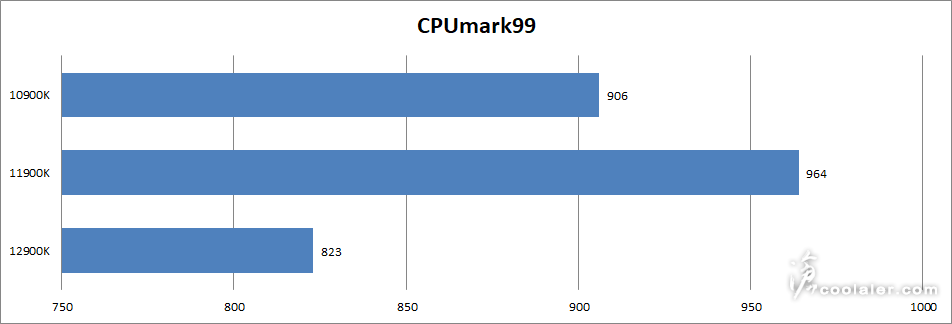
CPUmark99:823
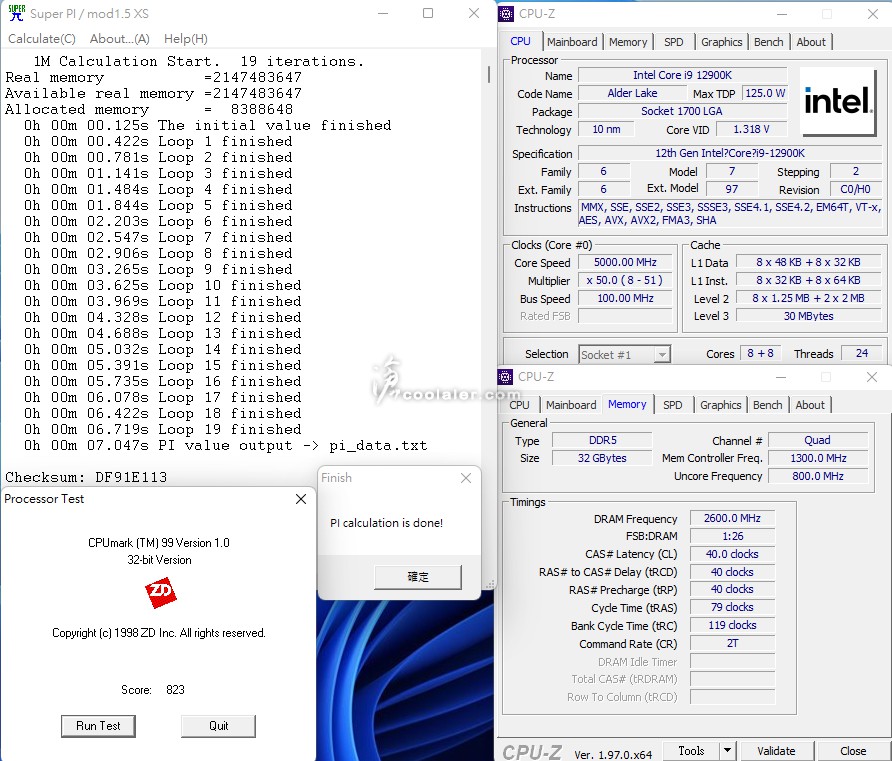
SuperPI 8M:1m15.316s
SuperPI 單位秒越少越好,8M換算成秒進行比較,不確定是否軟體太過老舊或可能是 Windows 11 的關係,因為先前 Windows 10 的平台下測試 11900K 1M大概在6.4秒左右完成,但在 Windows 11 下卻明顯慢許多,這部分確實是有一點問題。
CPUmark99,可能也是軟體過於老舊,大小核心的 12900K 跑起來可能會有點不正常?
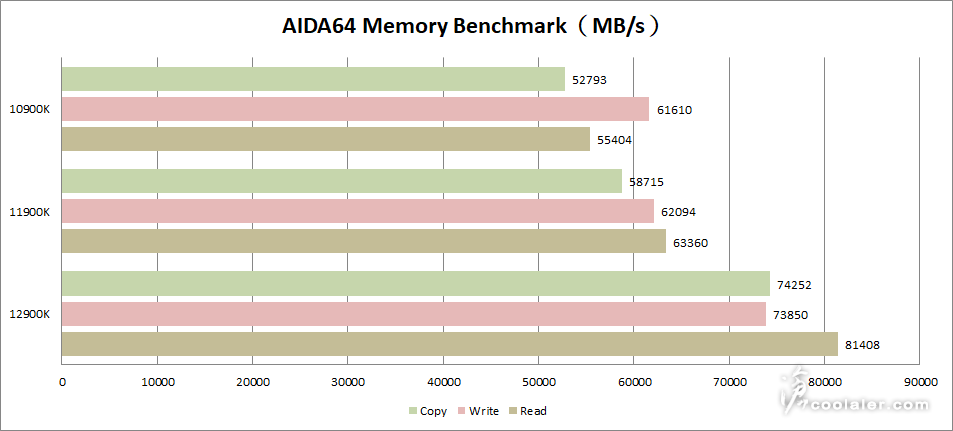
Memory Benchmark
Read:81408 MB/s
Write:73850 MB/s
Copy:74252 MB/s
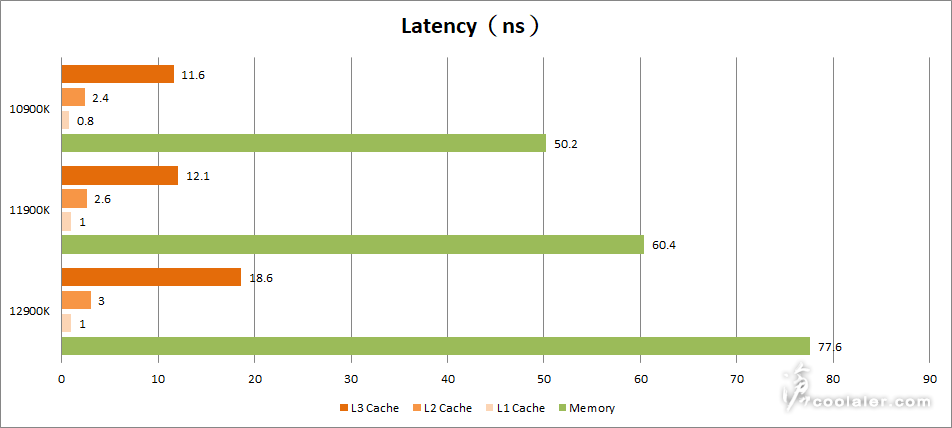
Latency:77.6 ns
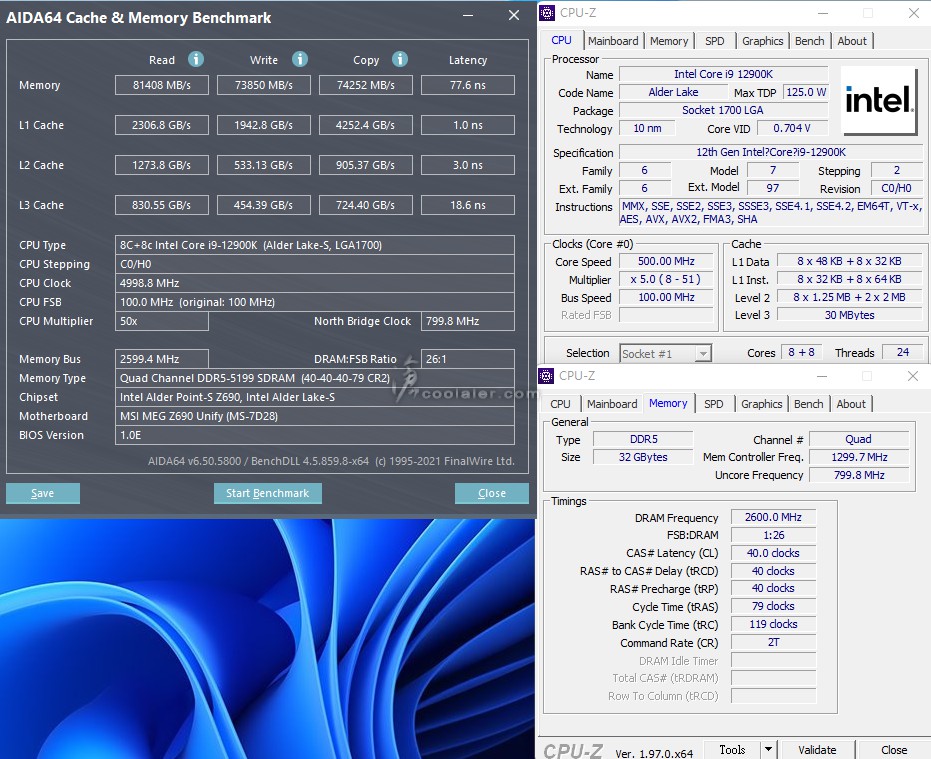
Memory Benchmark 這部分記憶體有差異,因為 12900K 使用的是 DDR5 5200MHz,11900K / 10900K 使用的是 DDR4 4400MHz,所以結果僅供參考。
L1、L2、L3 快取以及記憶體延遲的差異。
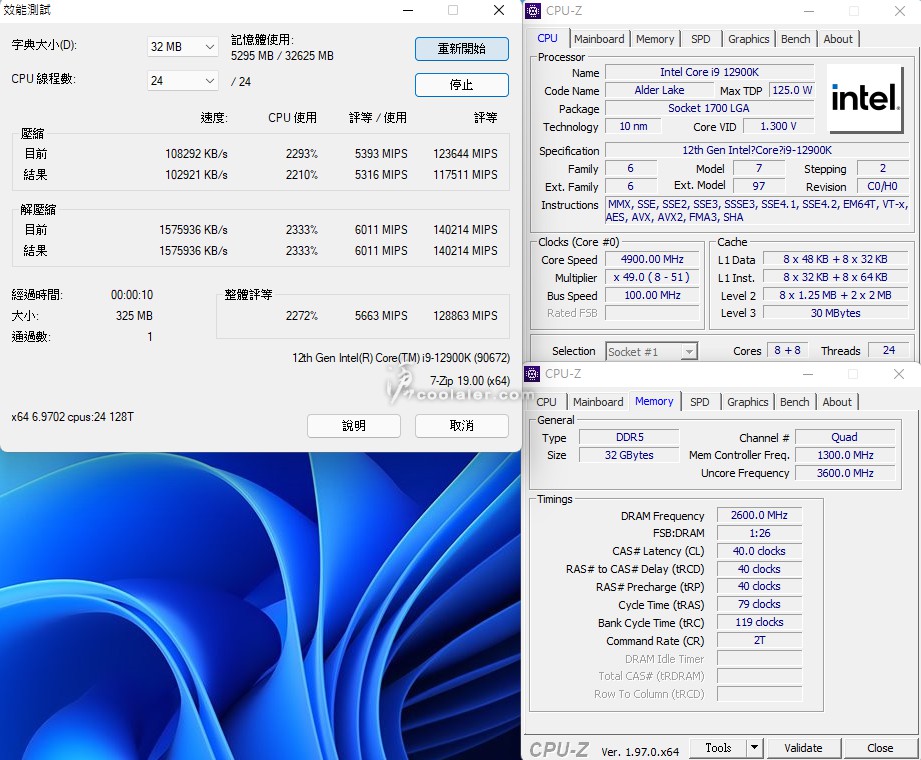
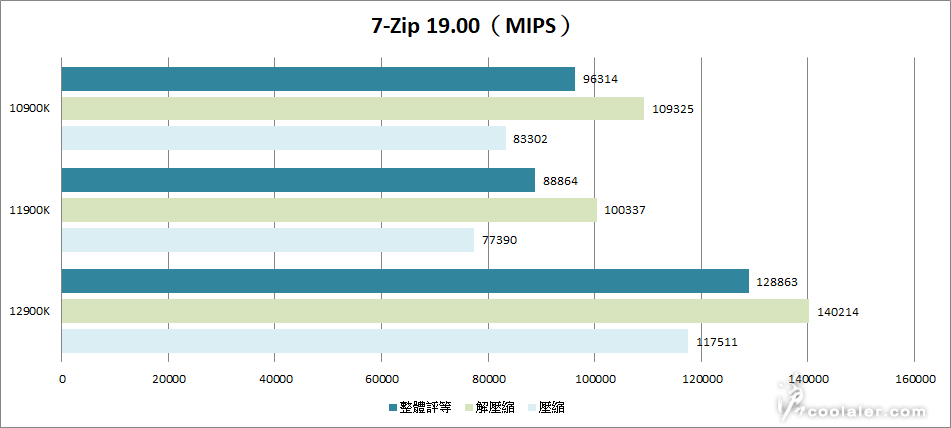
7-Zip 19.00
壓縮:117511 MIPS
解壓縮:140214 MIPS
整體評等:128863 MIPS
7 Zip 以整體評等來看,分別高出 11900K、10900K 有45%、33.8%。
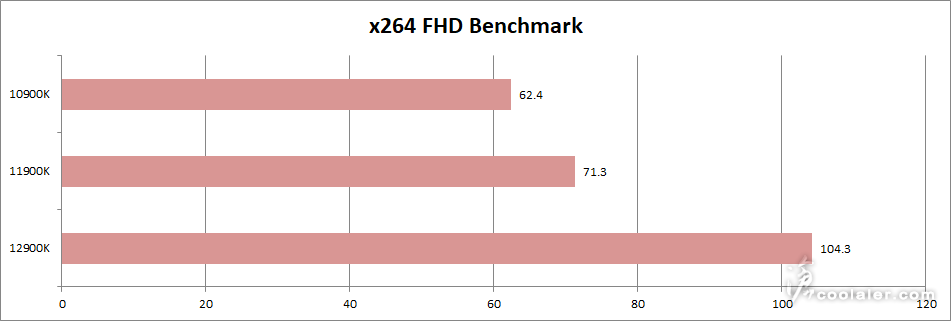
x264 FHD Benchmark:104.3
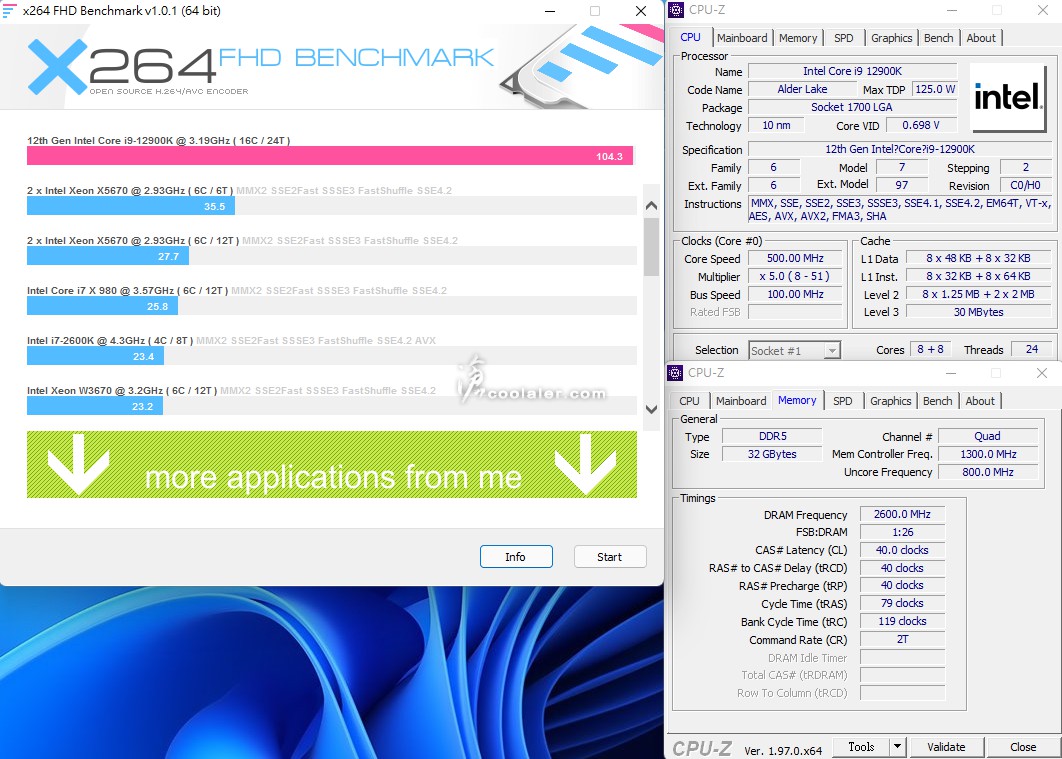
x264 在 12900K 仍跑不到100%,但效能還是不錯,大小核應該都有發揮到80~90%,分別高出 11900K、10900K 有46.3%、67.1%。這部分 10900K 有點異常,之前在 Windows 10 應該會到68分左右,可能是軟體問題。
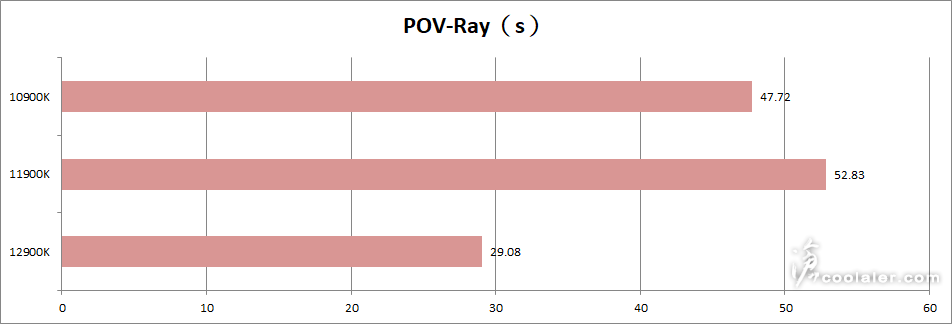
POV-Ray:29.08s
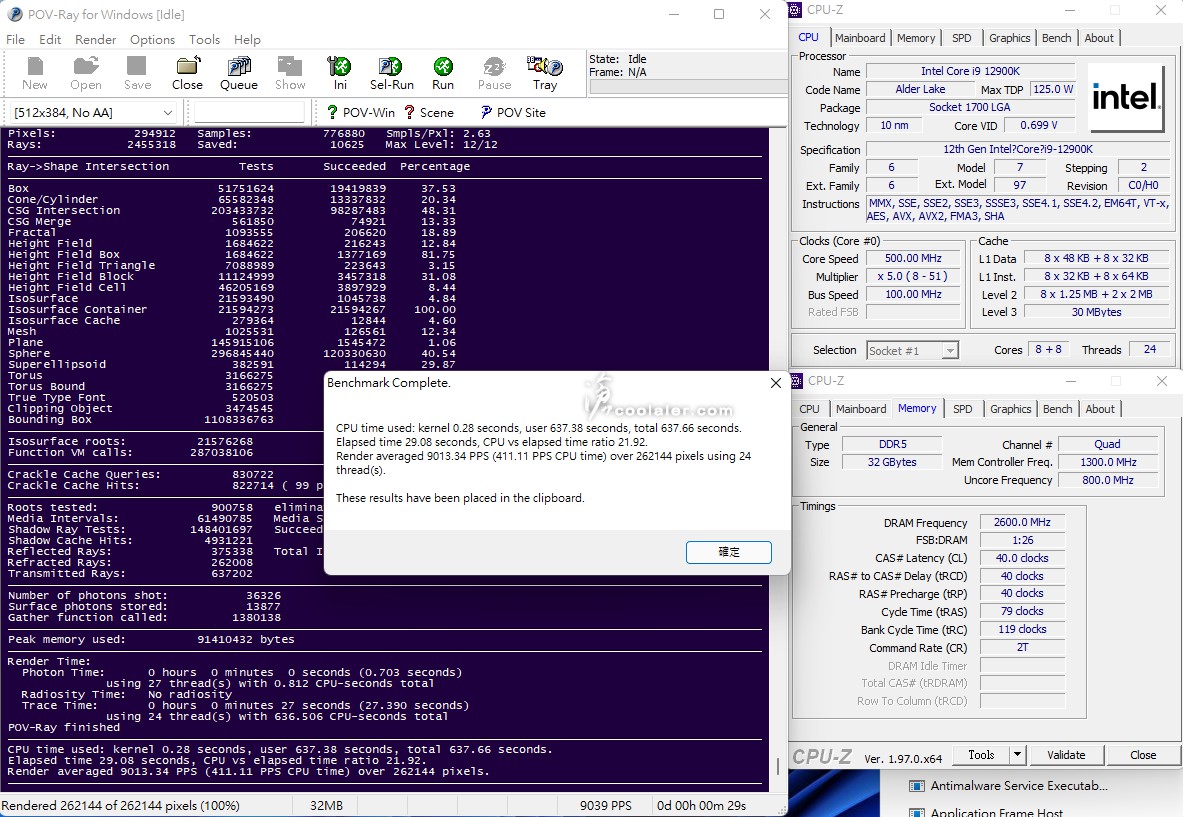
POV-Ray 單位秒越少越好,效能分別高出 11900K、10900K 有45%、39.1%。
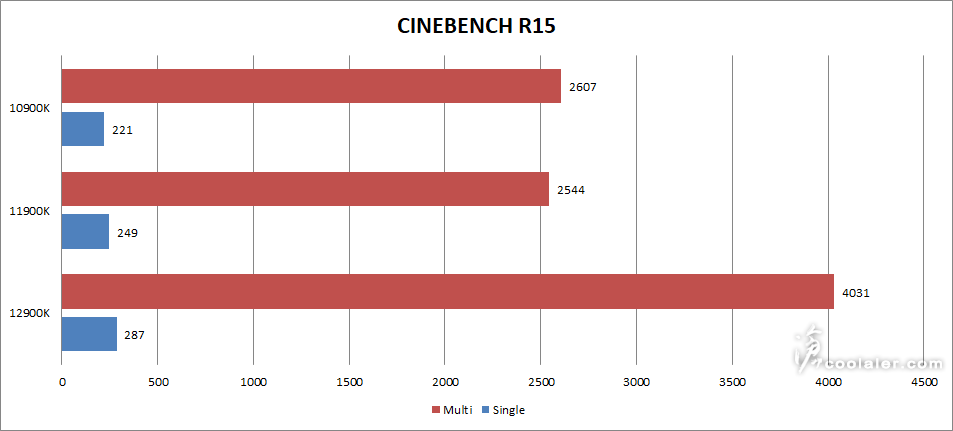
CINEBENCH R15
OpenGL:346.80 fps
CPU:4031 cb
CPU 單核心:287 cb
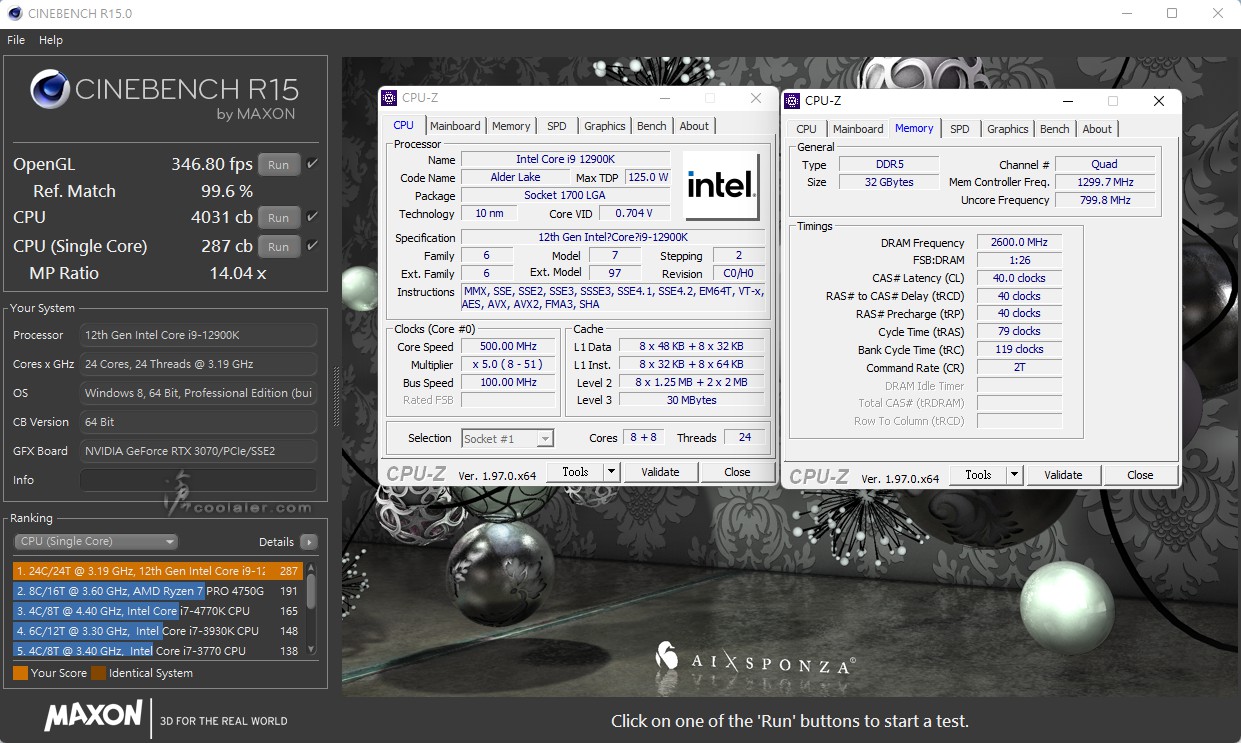
R15 單核心效能分別高出 11900K、10900K 有15.3%、29.9%,多核心 58.5%、54.6%。
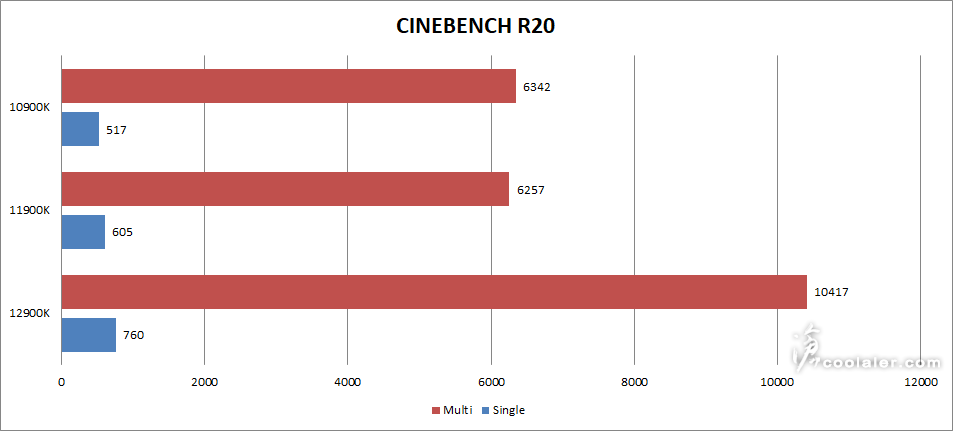
CINEBENCH R20
CPU:10417 cb
CPU 單核心:760 cb
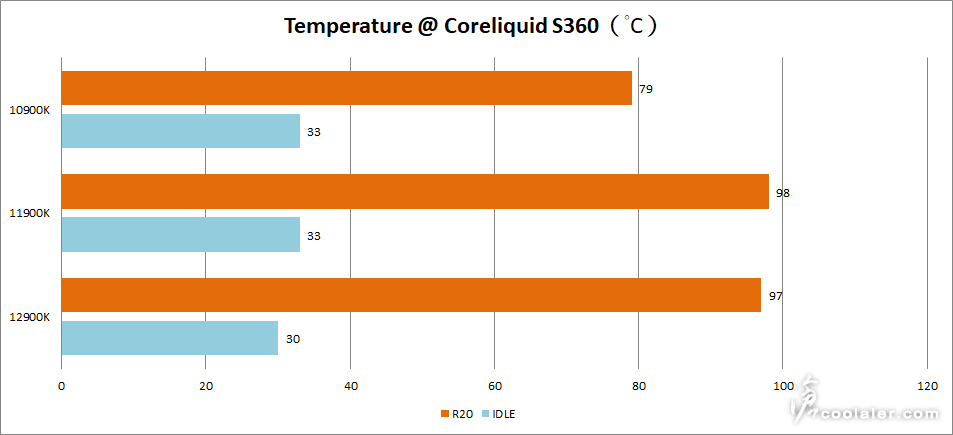
R20 順道測試了溫度與功耗,可以看到下圖 Core Temp,大核心是0~7,小核心是8~15,最低0度是bug。
待機時大小核心溫度:30度
R20 大核心溫度:97度 小核心:84度
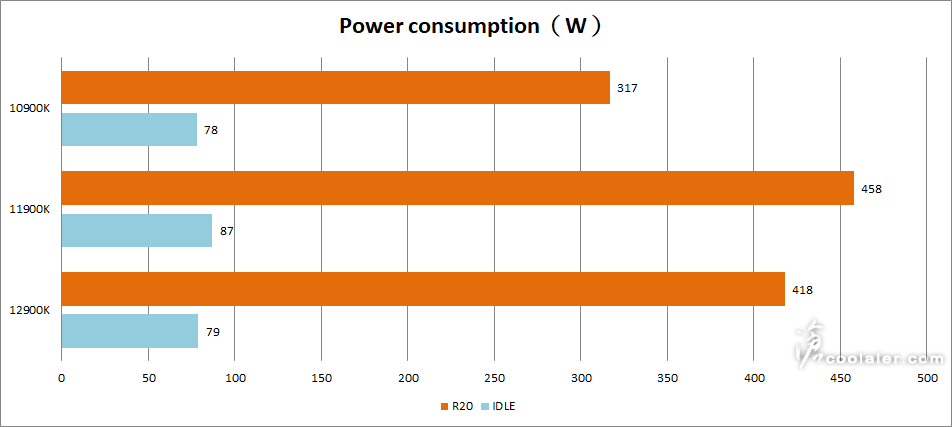
待機全機功耗:79W
R20 全機功耗:418W
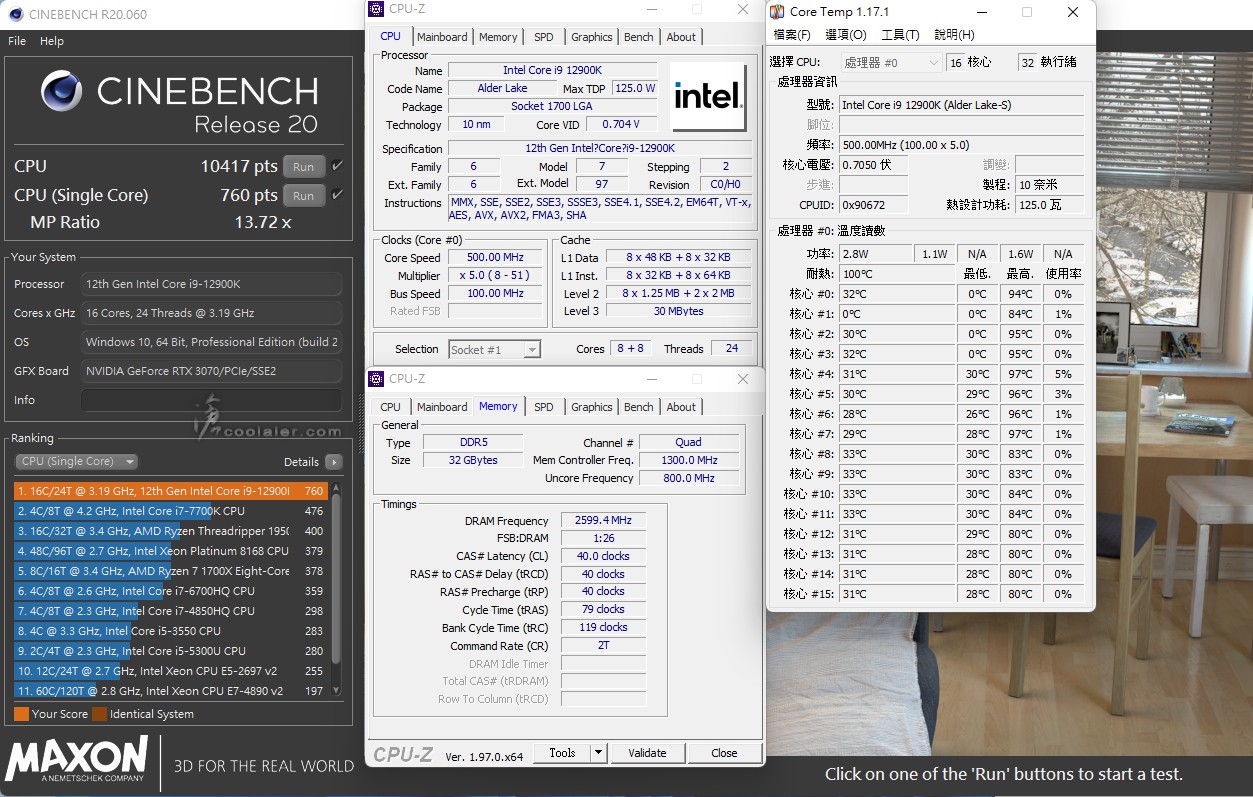
R20 單核心效能分別高出 11900K、10900K 有25.6%、47%,多核心 66.5%、64.3%。
溫度差異,12900K 待機溫度有比較低一些,應該是製程關係,不過全載還是壓得很緊,與 11900K ABT 差不多。這部分與主機板預設設定有關,MSI 選水冷散熱器對於功耗限制就會比較寬一點,效能會較高,但相對溫度也是。
功耗差異,12900K 待機時有比 11900K 還低一些,全載低了40W。不過全載 400W 確實是還頗高,但這也與上述一樣,MSI BIOS 選水冷散熱器對於功耗限制就會寬一點。
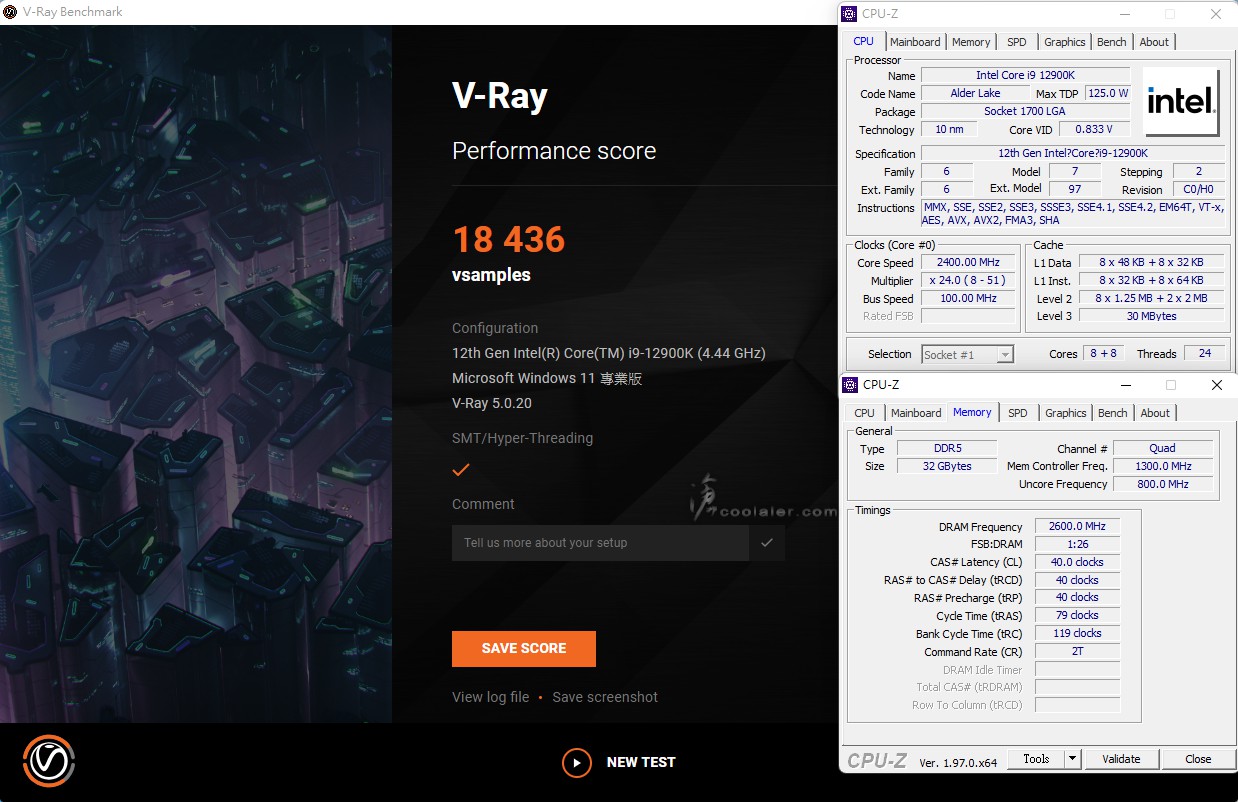
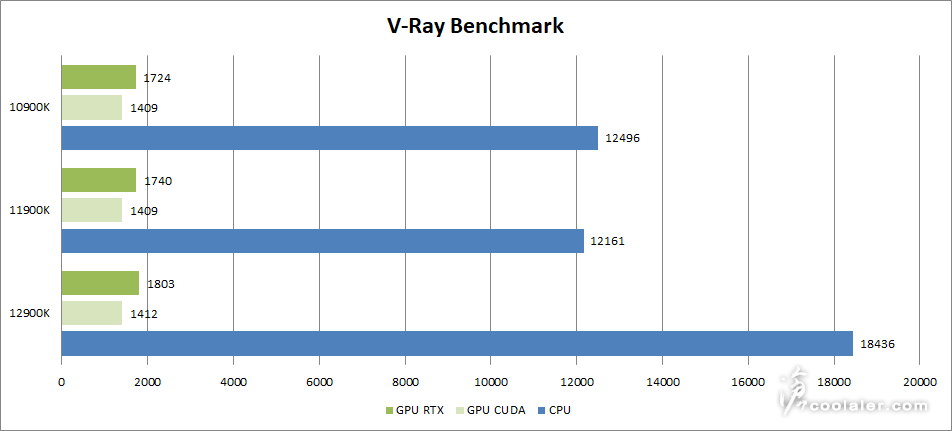
V-Ray:18436
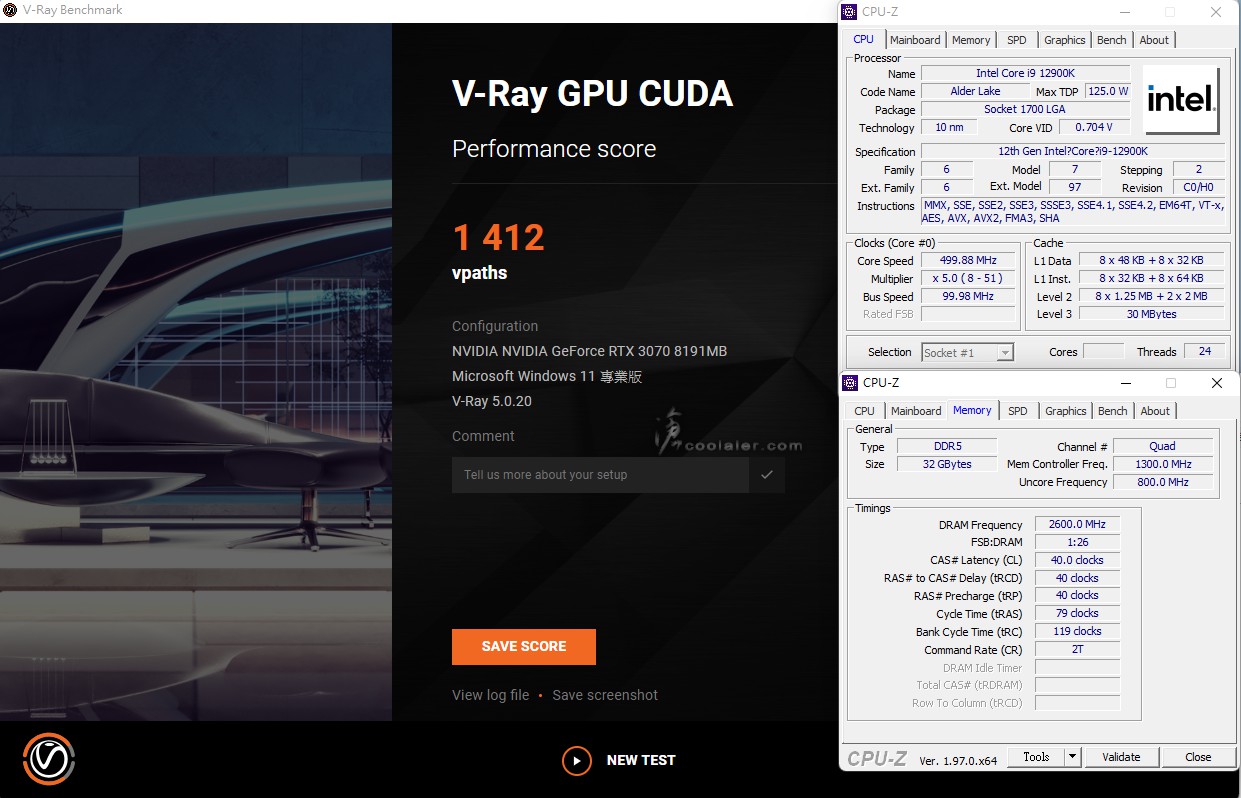
V-Ray GPU CUDA:1412
V-Ray GPU RTX:1803
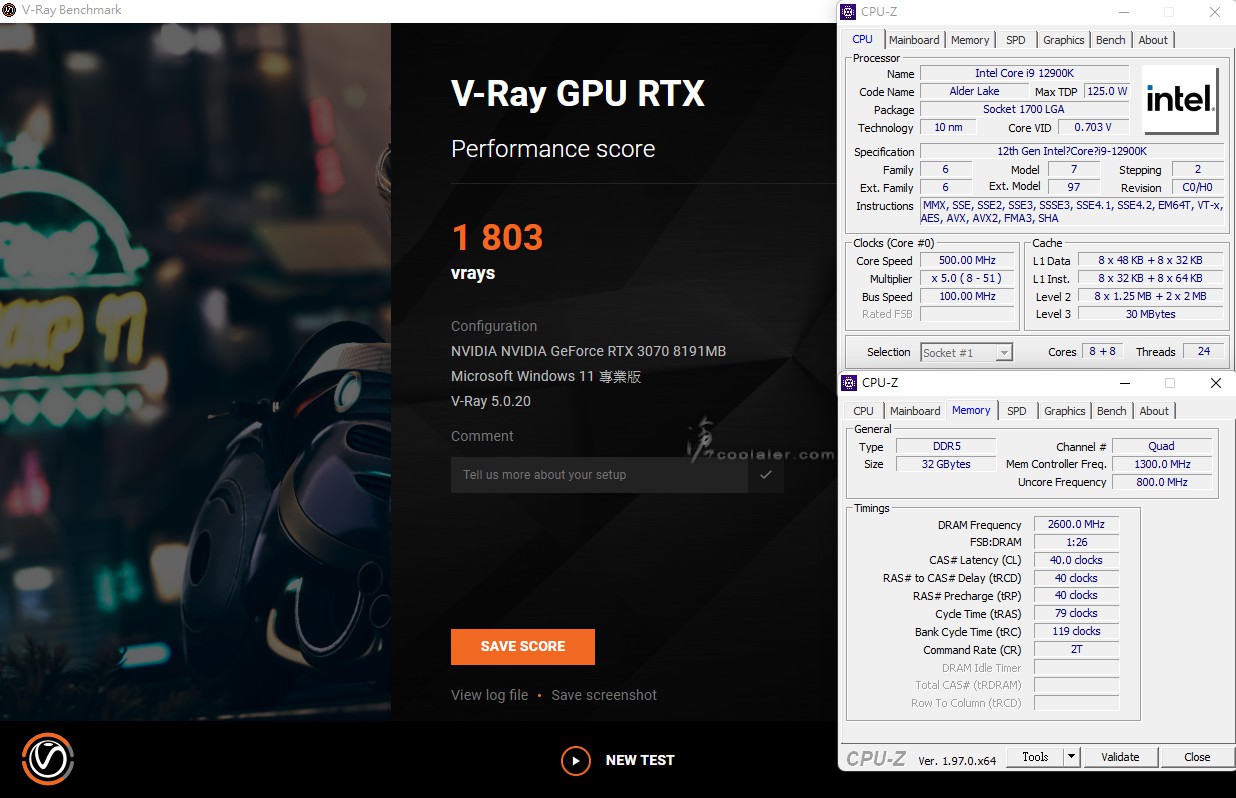
V-Ray CPU 的部分無疑是差異最高,分別高出 11900K、10900K 有51.6%、47.5%。CUDA 以及 RTX 也有一些影響,前者差異不大,RTX 約差了3.6%。
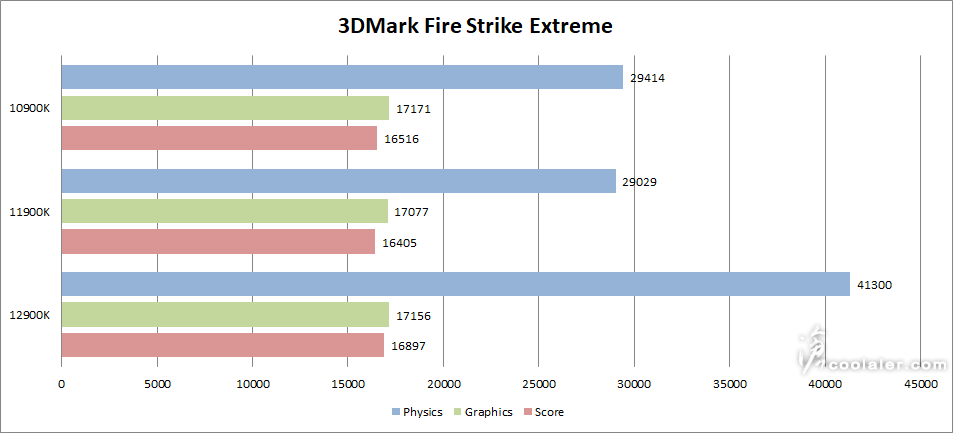
3DMark Fire Strike Extreme:16897
Graphics score:17156
Physics score:41300
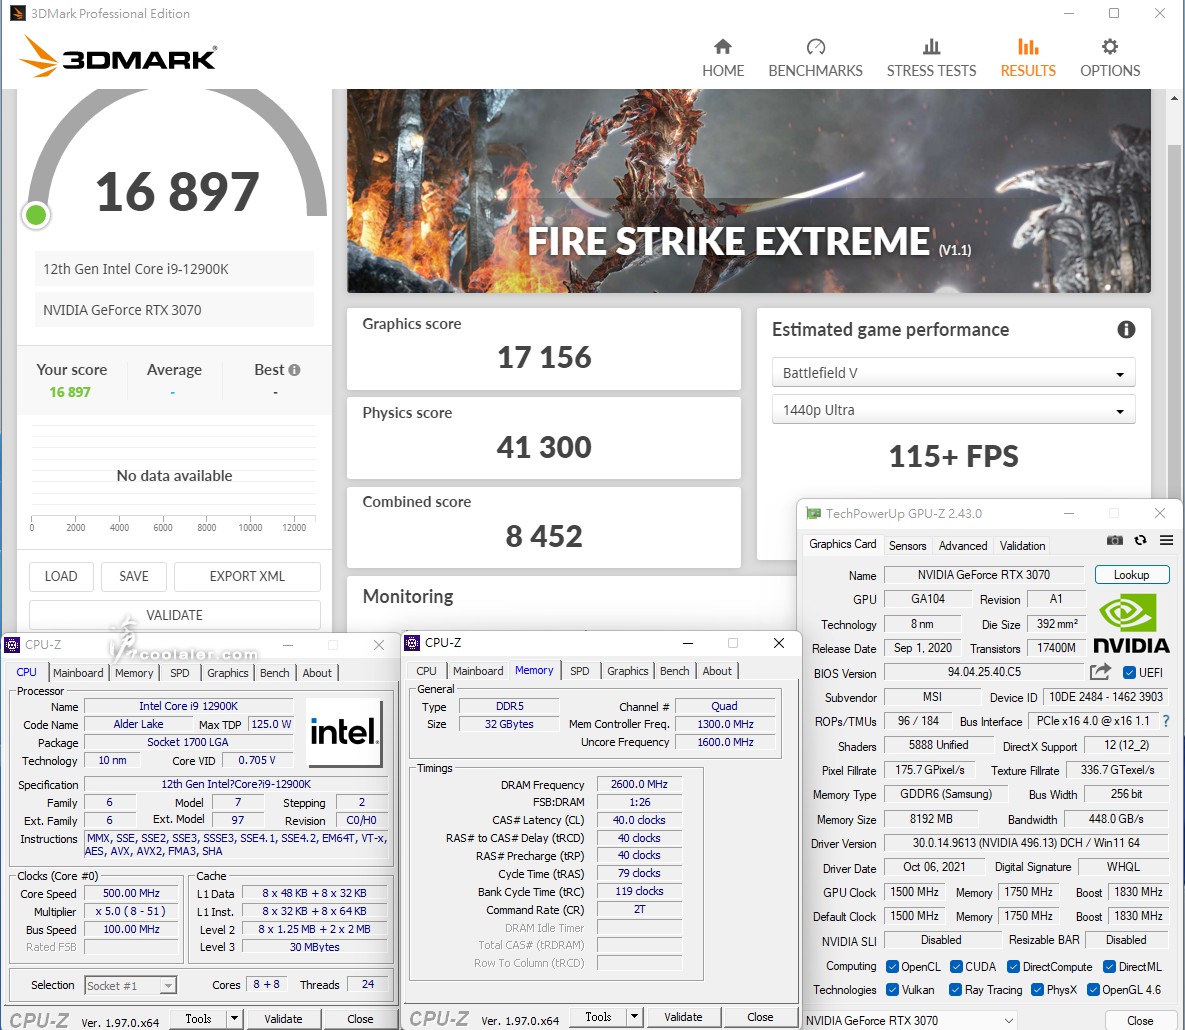
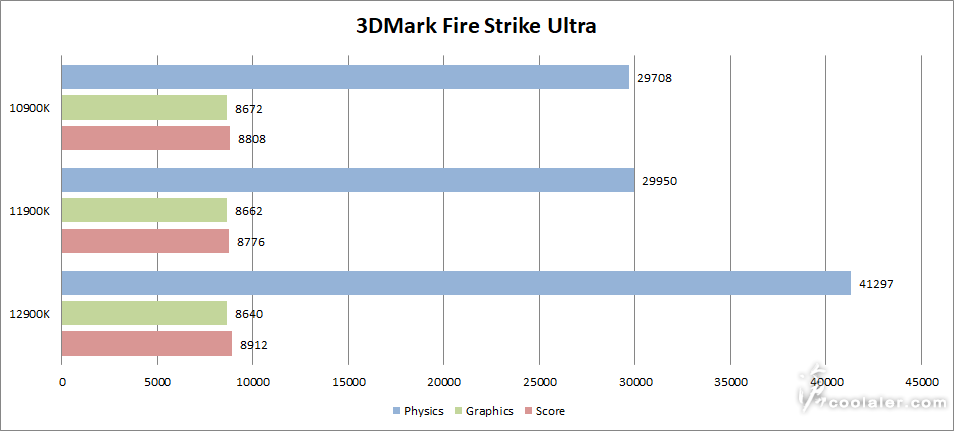
3DMark Fire Strike 主要就還是差在 CPU 部分,分別高出 11900K、10900K 有42.2%、40.4%。
3DMark Fire Strike Ultra:8912
Graphics score:8640
Physics score:41297
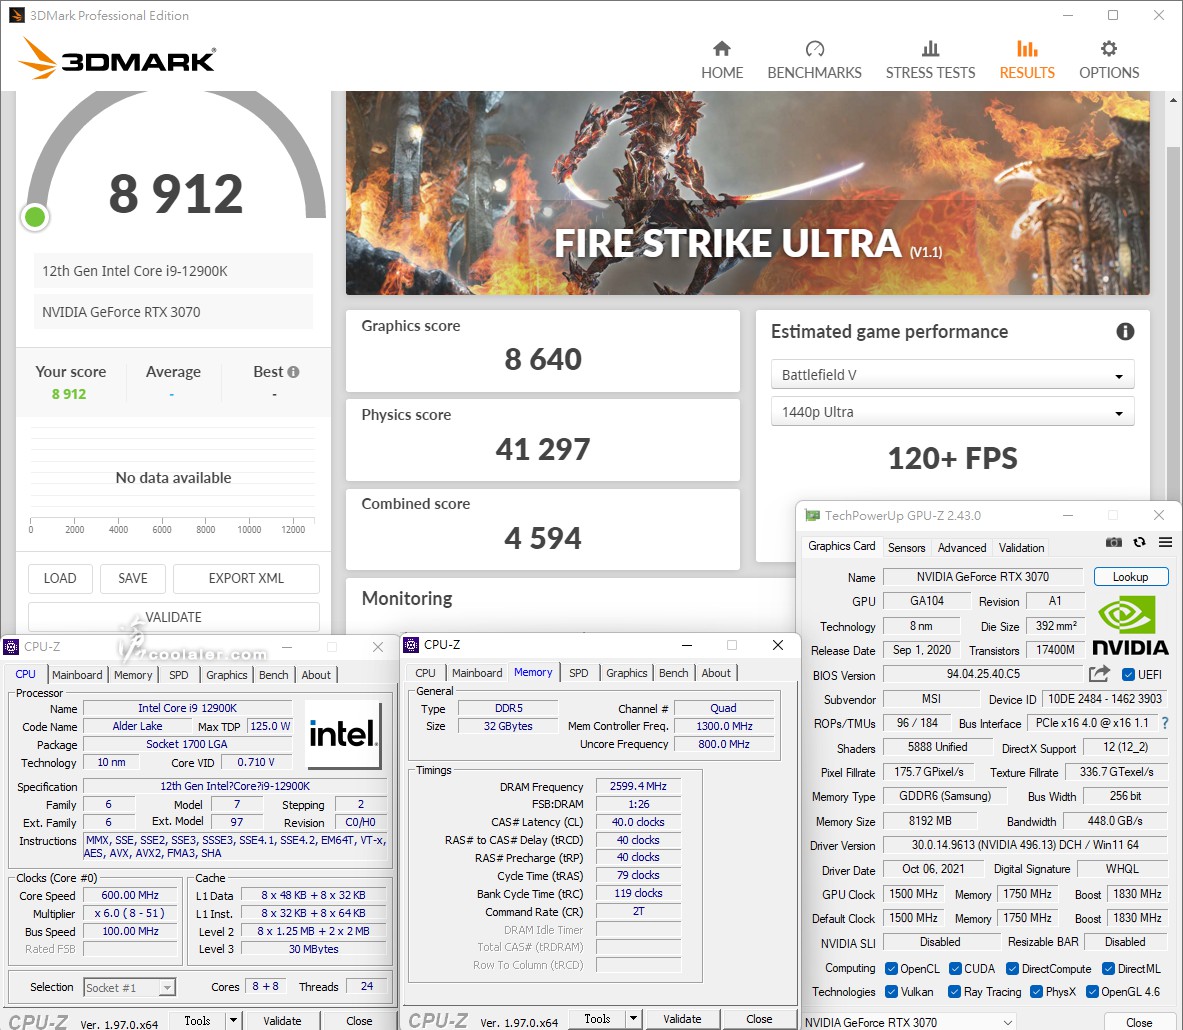
CPU 部分分別高出 11900K、10900K 有37.9%、39%。
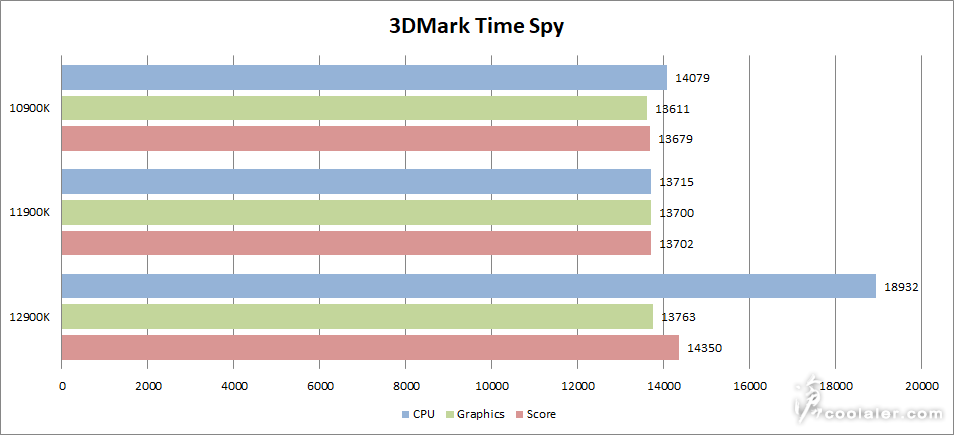
3DMark Time Spy:14350
Graphics score:13763
CPU score:18932
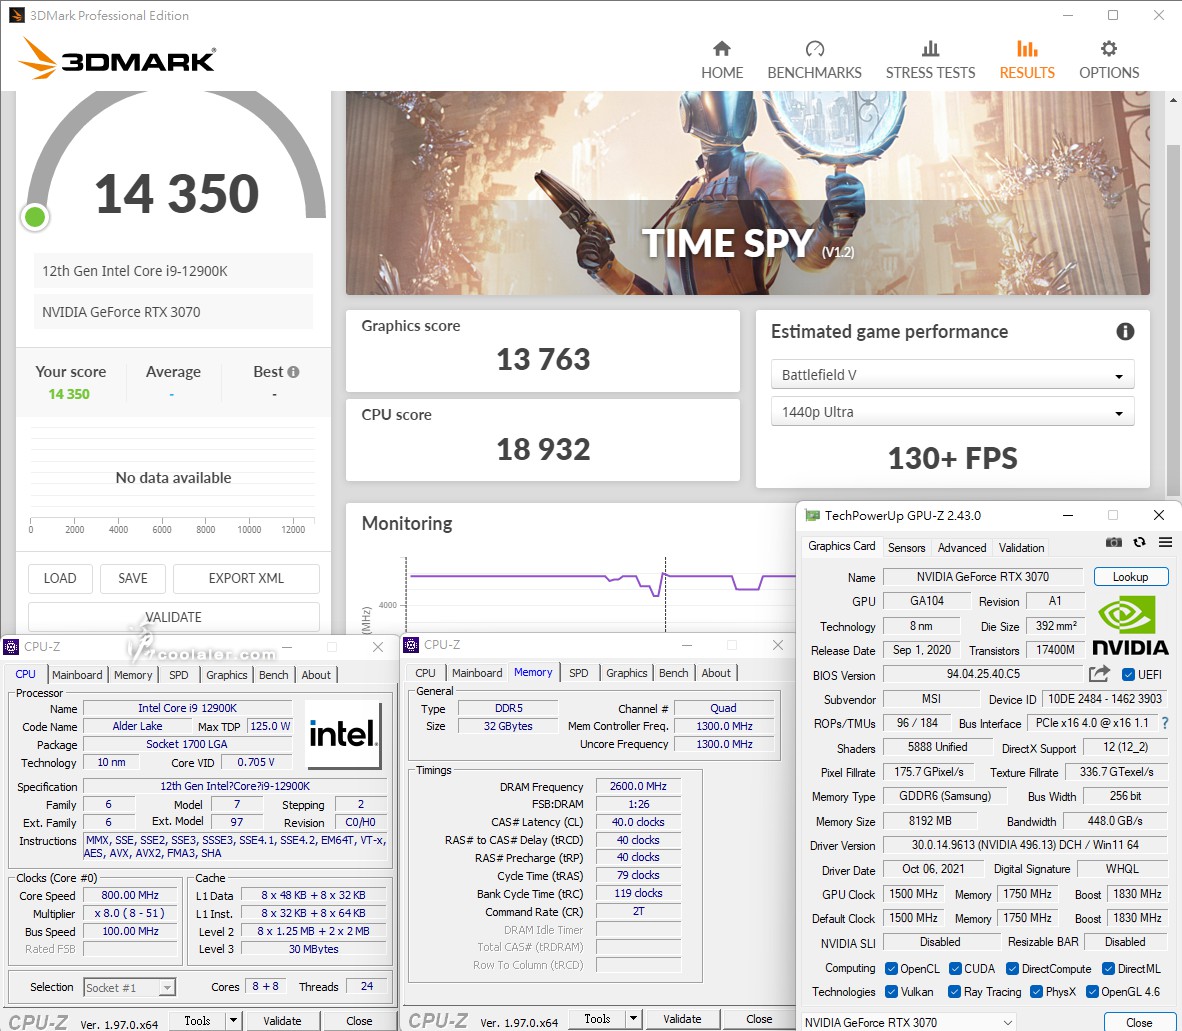
Time Spy 項目 CPU 對於總分也有些影響,可作為一些遊戲有應用到處理器資源的考量,但當然不是全然如此,CPU 分數分別高出 11900K、10900K 有38%、34.5%。總分比則是4.7%、4.9%。
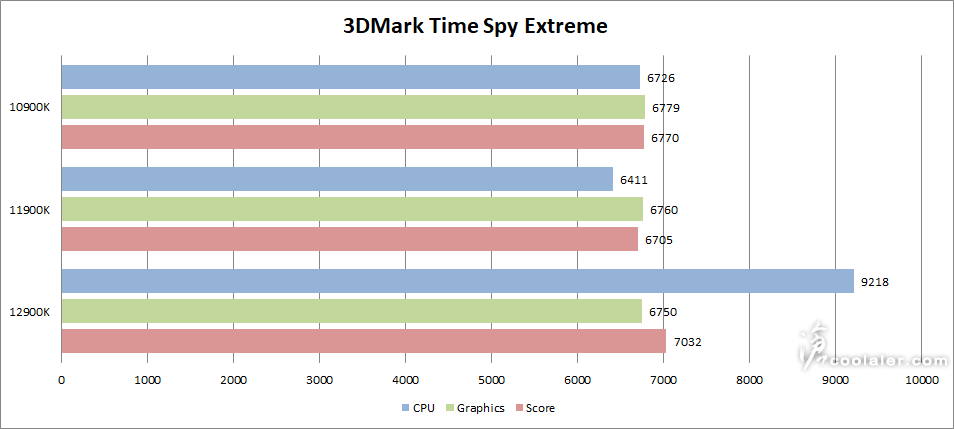
3DMark Time Spy Extreme:7032
Graphics score:6750
CPU score:9218
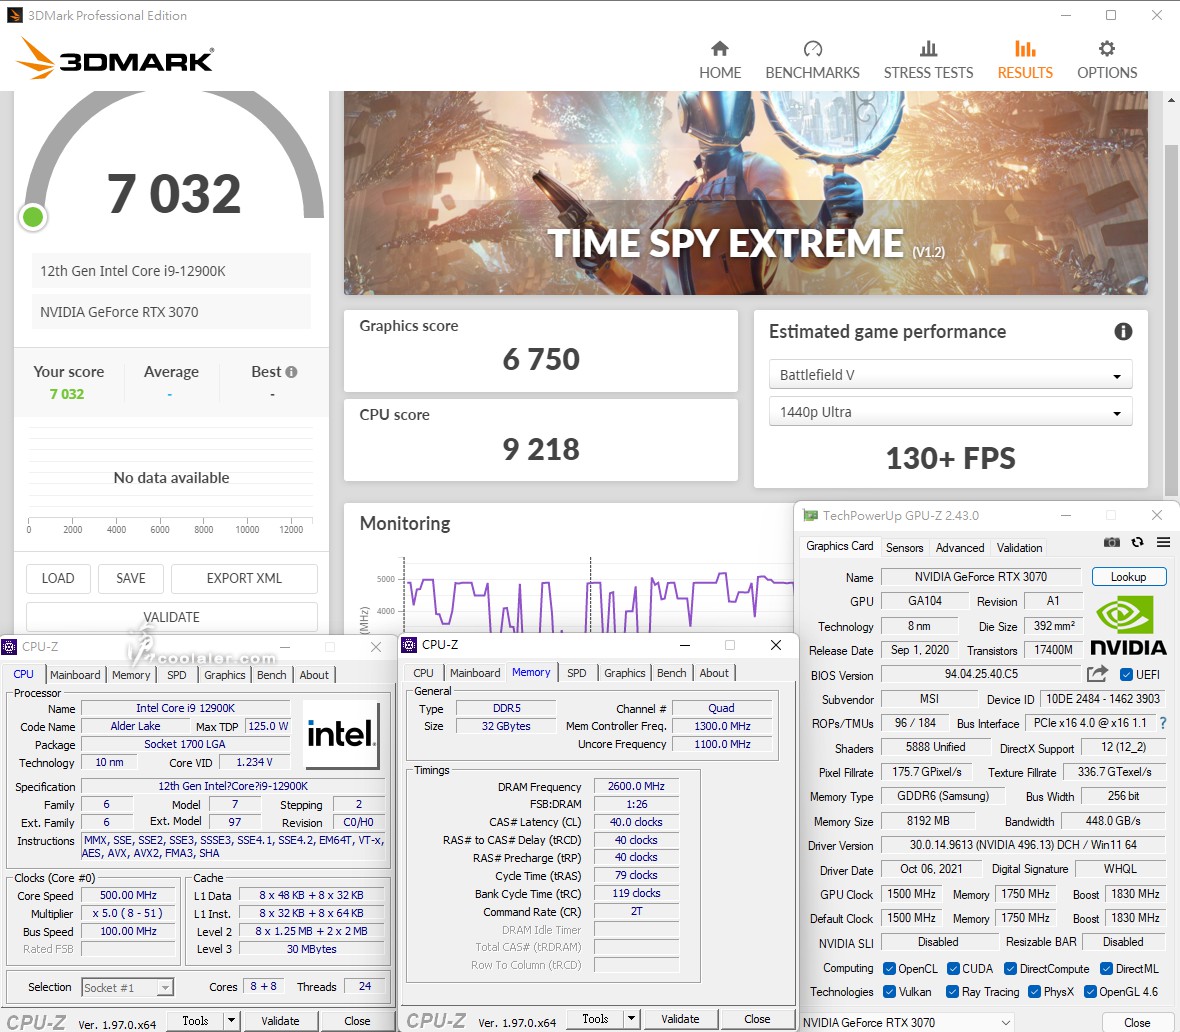
Time Spy Extreme CPU 分數分別高出 11900K、10900K 有43.8%、37.1%。總分比則是4.9%、3.9%。
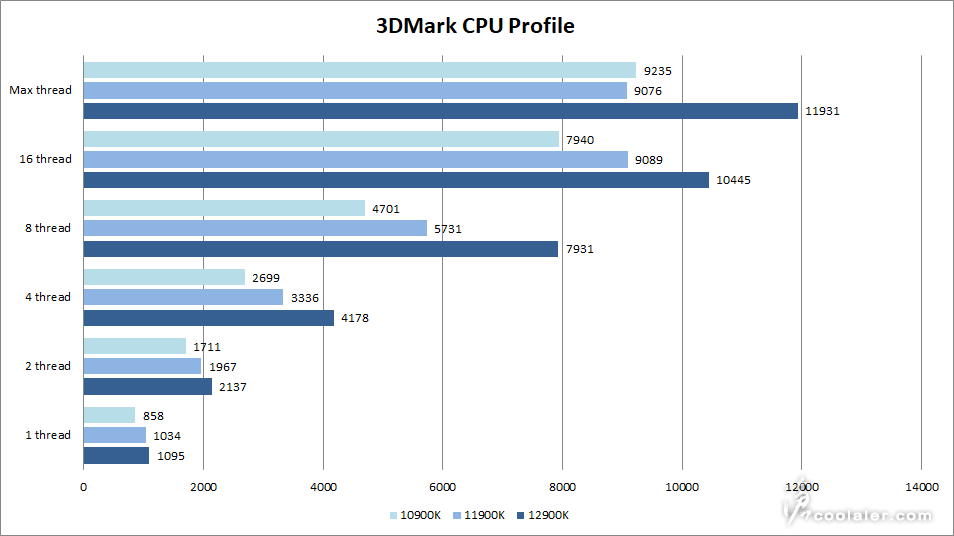
3DMark CPU Profile
1 thread:1095
2 threads:2137
4 threads:4178
8 threads:7931
16 threads:10445
Max threads:11931
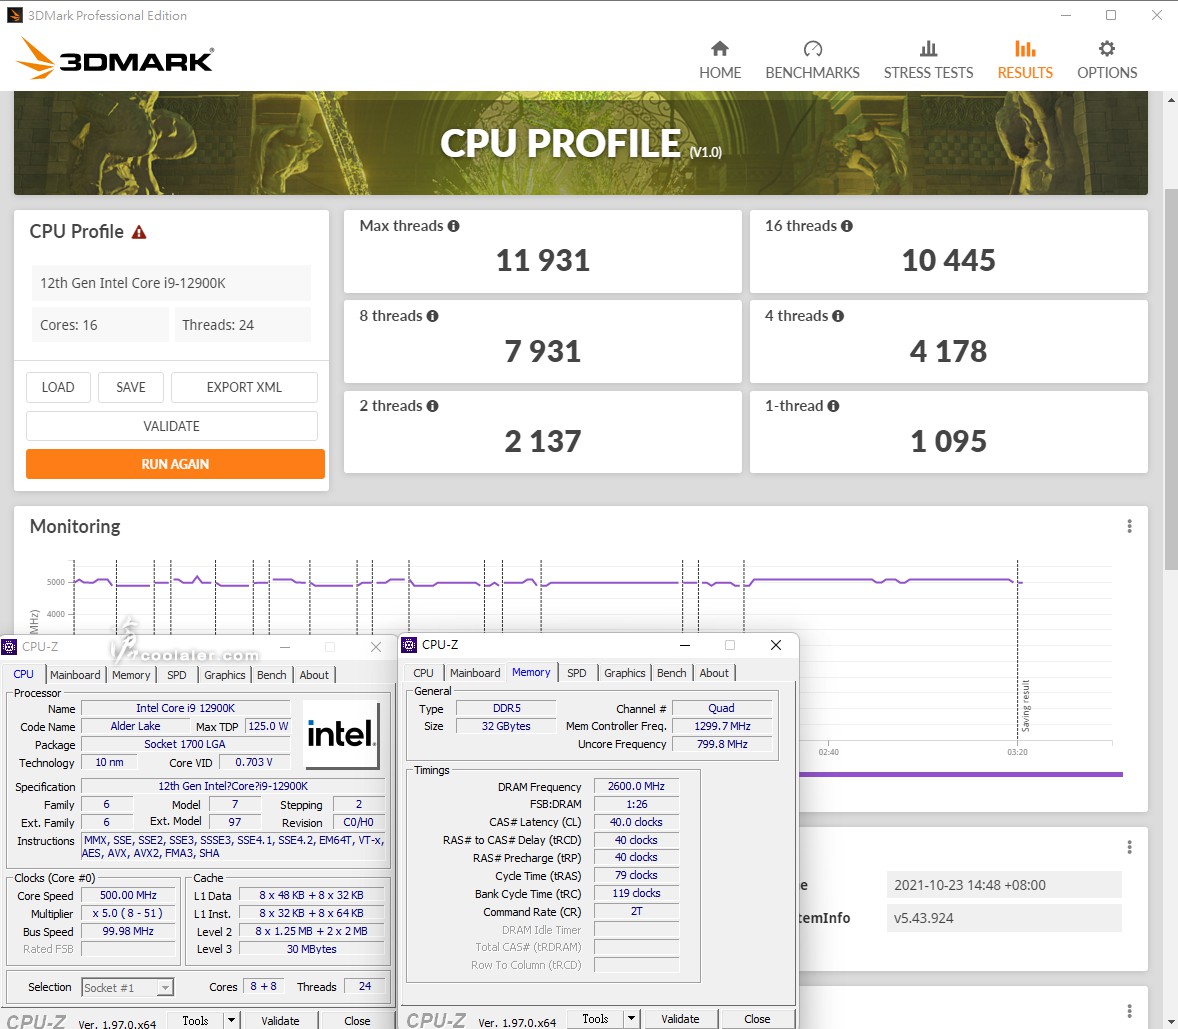
3DMark 的 CPU Profile 測試是針對執行緒對於效能的影響,分別以 1、2、4、8、16 以及 Max 執行緒進行測試。單執行緒的分數分別高出 11900K、10900K 有5.9%、27.6%。16執行緒下分別高出有14.9%、31.5%。全部核心執行緒差異則是31.5%、29.2%。
超頻測試,說實在沒有甚麼空間,預設跑 R20 已經有97度,所以可預期是很有限。稍微測試一下,可超頻到全核心5.2GHz,BIOS CPU 電壓設為1.335V,CPU-Z 判讀是1.375V,過測 R20,成績是10872,相比預設值高出4.4%。超頻全核心5.2GHz在執行 R20 全載下最高達到107度,最高功耗約469W。
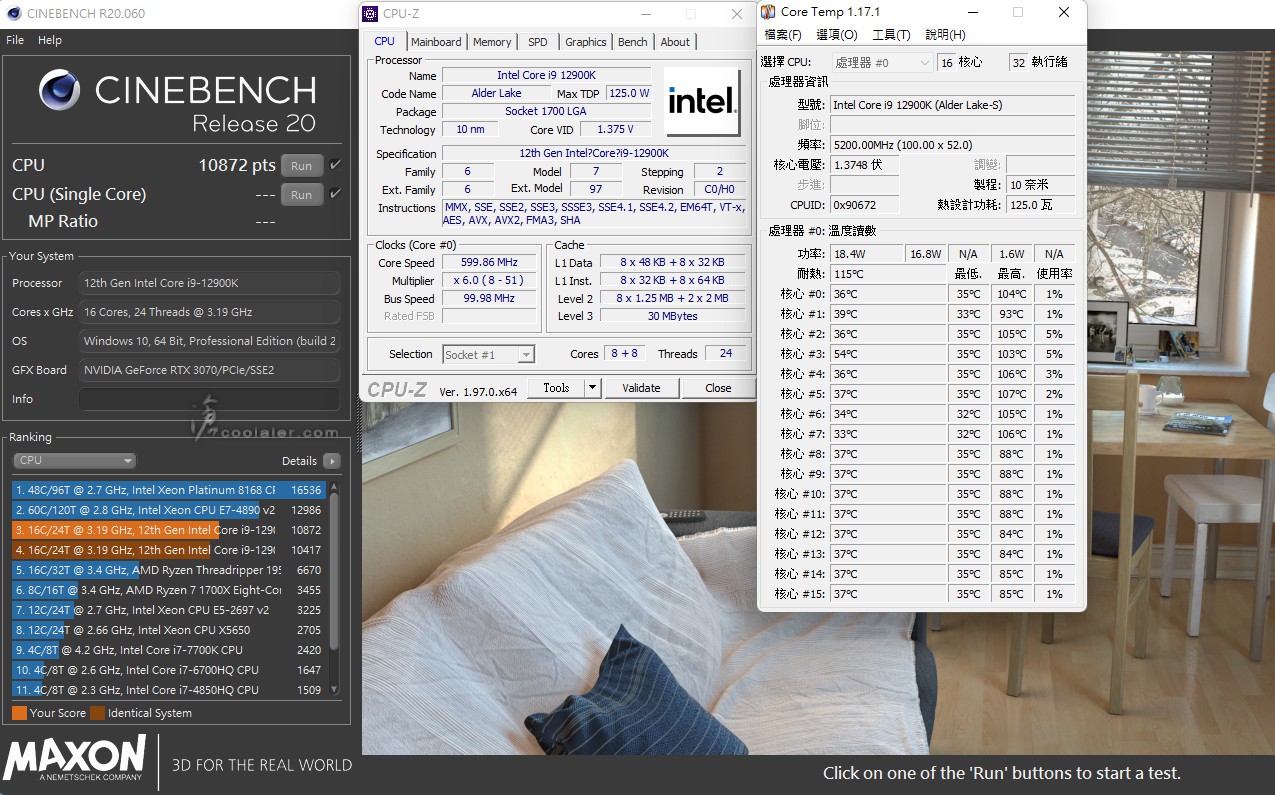
不過這邊得講一下,MSI Z690 UNIFY 在 BIOS 內你如果選擇水冷散熱器對於功耗限制就會拉得比較高,主要目的就是在預設值上就可以壓榨出更高的效能,但相對功耗溫度就會提升。
小結
Intel 第12代是相當大躍進的一代,不論在架構上、平台支援上相比上一代都算很有感,如 DDR5 記憶體以及 PCIe Gen5,雖然後者還沒有周邊支援,也有著更多的擴充應用通道。效能部分,綜觀以上測試無疑 Intel 在 Alder Lake-S 有相當的效能提升,而且就官方定價來看似乎也還不錯,目前看到 Core i9-12900K 為18700元,相比 11900K 15900元價差不到3000元,效能是相當有感的提升,不過明顯在主機板是需要更換到 Z690,是不是要換 DDR5 就看個人預算了,現階段看到也有一些 DDR4 的板子可選。
溫度與功耗或許高了一點,畢竟這一代擠得較用力,來提升更高的競爭力以及效能有感。Core i9-12900K 搭配 MSI MEG Z690 UNIFY 在 BIOS 下直接選用水冷散熱就能榨出較高的效能,當然前提是真的要用上能壓制住溫度的水冷,建議搭配28或36公分的一體式水冷,這樣比較不會因為溫度保護而降頻,不過效能提升下溫度以及功耗更高是必然的。
關於開箱以及產品細節可以參考之前所發的文章 MSI MEG Z690 UNIFY + Core i9-12900K + Kingston FURY DDR5 5200 開箱 。
測試之前先來看看 MEG Z690 UNIFY BIOS 的部分。
BIOS簡介
整體 BIOS 介面沒有太大的改變,可以看到 XMP Profile 有五組,有兩組是可以自設儲存調用。
超頻選項,P-Core 大核心與 E-Core 小核心可以個別調整,CPU Cooler Tuning 選擇散熱器就能解鎖更高效能,這也算是一種超頻,但如果你是原廠散熱器去選水冷那也並不會達到更好的效能就是。
記憶體選項雖然有 Gear 檔位可選,但 MSI 板子很簡單,多數直設 Auto 就可以。電壓的部分也是很完整,甚至能針對小核心 E-Core 微調。
進階 CPU 選項。
記憶體參數調整。
DigitALL Power 電源選項。
Hardware Monitor,調整風扇轉速與溫度對應。
簡易模式畫面。
測試平台
CPU: Intel Core i9-12900K、11900K、10900K
CPU Cooler: MSI MEG CORELIQUID S360
RAM: Kingston FURY DDR5 5200MHz 16GBx2 / TT DDR4 4400MHz 8GBx2
MB: MSI MEG Z690 UNIFY / MSI MEG Z590 UNIFY
VGA: MSI RTX 3070 GAMING X TRIO
SSD: GIGABYTE AORUS NVMe Gen4 SSD 1TB
PSU: IN WIN SI 1065W
OS: Windows 11
使用平台如上列,Z590 搭配使用 DDR4 記憶體,11900K 直開 ABT 自動超頻,系統一樣是 Windows 11。以下為了節省一些版面方便閱讀,比較就直接上圖表,只有 Core i9-12900K 上測試截圖還請見諒,如果有需要其他測試圖可以留言告知。
核心與時脈
Intel Core i9-12900K:8c+8C24T / 3.2~5.2GHz(P-Core)
Intel Core i9-11900K:8C16T / 3.5~5.3GHz
Intel Core i9-10900K:10C20T / 3.7~5.3GHz
CPU-Z
CPU Single:822.4
CPU Multi:11383.8
單核心效能 12900K 相較於 11900K 提升了21.4%,多核心提升了66.1%,相比 10C20T 的 10900K 也要多出了54%。
SuperPI 1M:7.047s
CPUmark99:823
SuperPI 8M:1m15.316s
SuperPI 單位秒越少越好,8M換算成秒進行比較,不確定是否軟體太過老舊或可能是 Windows 11 的關係,因為先前 Windows 10 的平台下測試 11900K 1M大概在6.4秒左右完成,但在 Windows 11 下卻明顯慢許多,這部分確實是有一點問題。
CPUmark99,可能也是軟體過於老舊,大小核心的 12900K 跑起來可能會有點不正常?
Memory Benchmark
Read:81408 MB/s
Write:73850 MB/s
Copy:74252 MB/s
Latency:77.6 ns
Memory Benchmark 這部分記憶體有差異,因為 12900K 使用的是 DDR5 5200MHz,11900K / 10900K 使用的是 DDR4 4400MHz,所以結果僅供參考。
L1、L2、L3 快取以及記憶體延遲的差異。
7-Zip 19.00
壓縮:117511 MIPS
解壓縮:140214 MIPS
整體評等:128863 MIPS
7 Zip 以整體評等來看,分別高出 11900K、10900K 有45%、33.8%。
x264 FHD Benchmark:104.3
x264 在 12900K 仍跑不到100%,但效能還是不錯,大小核應該都有發揮到80~90%,分別高出 11900K、10900K 有46.3%、67.1%。這部分 10900K 有點異常,之前在 Windows 10 應該會到68分左右,可能是軟體問題。
POV-Ray:29.08s
POV-Ray 單位秒越少越好,效能分別高出 11900K、10900K 有45%、39.1%。
CINEBENCH R15
OpenGL:346.80 fps
CPU:4031 cb
CPU 單核心:287 cb
R15 單核心效能分別高出 11900K、10900K 有15.3%、29.9%,多核心 58.5%、54.6%。
CINEBENCH R20
CPU:10417 cb
CPU 單核心:760 cb
R20 順道測試了溫度與功耗,可以看到下圖 Core Temp,大核心是0~7,小核心是8~15,最低0度是bug。
待機時大小核心溫度:30度
R20 大核心溫度:97度 小核心:84度
待機全機功耗:79W
R20 全機功耗:418W
R20 單核心效能分別高出 11900K、10900K 有25.6%、47%,多核心 66.5%、64.3%。
溫度差異,12900K 待機溫度有比較低一些,應該是製程關係,不過全載還是壓得很緊,與 11900K ABT 差不多。這部分與主機板預設設定有關,MSI 選水冷散熱器對於功耗限制就會比較寬一點,效能會較高,但相對溫度也是。
功耗差異,12900K 待機時有比 11900K 還低一些,全載低了40W。不過全載 400W 確實是還頗高,但這也與上述一樣,MSI BIOS 選水冷散熱器對於功耗限制就會寬一點。
V-Ray:18436
V-Ray GPU CUDA:1412
V-Ray GPU RTX:1803
V-Ray CPU 的部分無疑是差異最高,分別高出 11900K、10900K 有51.6%、47.5%。CUDA 以及 RTX 也有一些影響,前者差異不大,RTX 約差了3.6%。
3DMark Fire Strike Extreme:16897
Graphics score:17156
Physics score:41300
3DMark Fire Strike 主要就還是差在 CPU 部分,分別高出 11900K、10900K 有42.2%、40.4%。
3DMark Fire Strike Ultra:8912
Graphics score:8640
Physics score:41297
CPU 部分分別高出 11900K、10900K 有37.9%、39%。
3DMark Time Spy:14350
Graphics score:13763
CPU score:18932
Time Spy 項目 CPU 對於總分也有些影響,可作為一些遊戲有應用到處理器資源的考量,但當然不是全然如此,CPU 分數分別高出 11900K、10900K 有38%、34.5%。總分比則是4.7%、4.9%。
3DMark Time Spy Extreme:7032
Graphics score:6750
CPU score:9218
Time Spy Extreme CPU 分數分別高出 11900K、10900K 有43.8%、37.1%。總分比則是4.9%、3.9%。
3DMark CPU Profile
1 thread:1095
2 threads:2137
4 threads:4178
8 threads:7931
16 threads:10445
Max threads:11931
3DMark 的 CPU Profile 測試是針對執行緒對於效能的影響,分別以 1、2、4、8、16 以及 Max 執行緒進行測試。單執行緒的分數分別高出 11900K、10900K 有5.9%、27.6%。16執行緒下分別高出有14.9%、31.5%。全部核心執行緒差異則是31.5%、29.2%。
超頻測試,說實在沒有甚麼空間,預設跑 R20 已經有97度,所以可預期是很有限。稍微測試一下,可超頻到全核心5.2GHz,BIOS CPU 電壓設為1.335V,CPU-Z 判讀是1.375V,過測 R20,成績是10872,相比預設值高出4.4%。超頻全核心5.2GHz在執行 R20 全載下最高達到107度,最高功耗約469W。
不過這邊得講一下,MSI Z690 UNIFY 在 BIOS 內你如果選擇水冷散熱器對於功耗限制就會拉得比較高,主要目的就是在預設值上就可以壓榨出更高的效能,但相對功耗溫度就會提升。
小結
Intel 第12代是相當大躍進的一代,不論在架構上、平台支援上相比上一代都算很有感,如 DDR5 記憶體以及 PCIe Gen5,雖然後者還沒有周邊支援,也有著更多的擴充應用通道。效能部分,綜觀以上測試無疑 Intel 在 Alder Lake-S 有相當的效能提升,而且就官方定價來看似乎也還不錯,目前看到 Core i9-12900K 為18700元,相比 11900K 15900元價差不到3000元,效能是相當有感的提升,不過明顯在主機板是需要更換到 Z690,是不是要換 DDR5 就看個人預算了,現階段看到也有一些 DDR4 的板子可選。
溫度與功耗或許高了一點,畢竟這一代擠得較用力,來提升更高的競爭力以及效能有感。Core i9-12900K 搭配 MSI MEG Z690 UNIFY 在 BIOS 下直接選用水冷散熱就能榨出較高的效能,當然前提是真的要用上能壓制住溫度的水冷,建議搭配28或36公分的一體式水冷,這樣比較不會因為溫度保護而降頻,不過效能提升下溫度以及功耗更高是必然的。