Intel Creator PC & Measure Performance Demo
台灣的媒體今天來到 Intel南港總部參加美國總部特別為技編準備的 Intel Platform Advance Taiwan Tech Media Gathering聚會
場地的 Intel Logo投影
一進入口即可見玄關上的 POP Intel Platform Advance Taiwan Tech Media Gathering

會場中陳列了 Intel 與友商之 PC & Laptop Show Case並做效能實測比對的 Live Demo
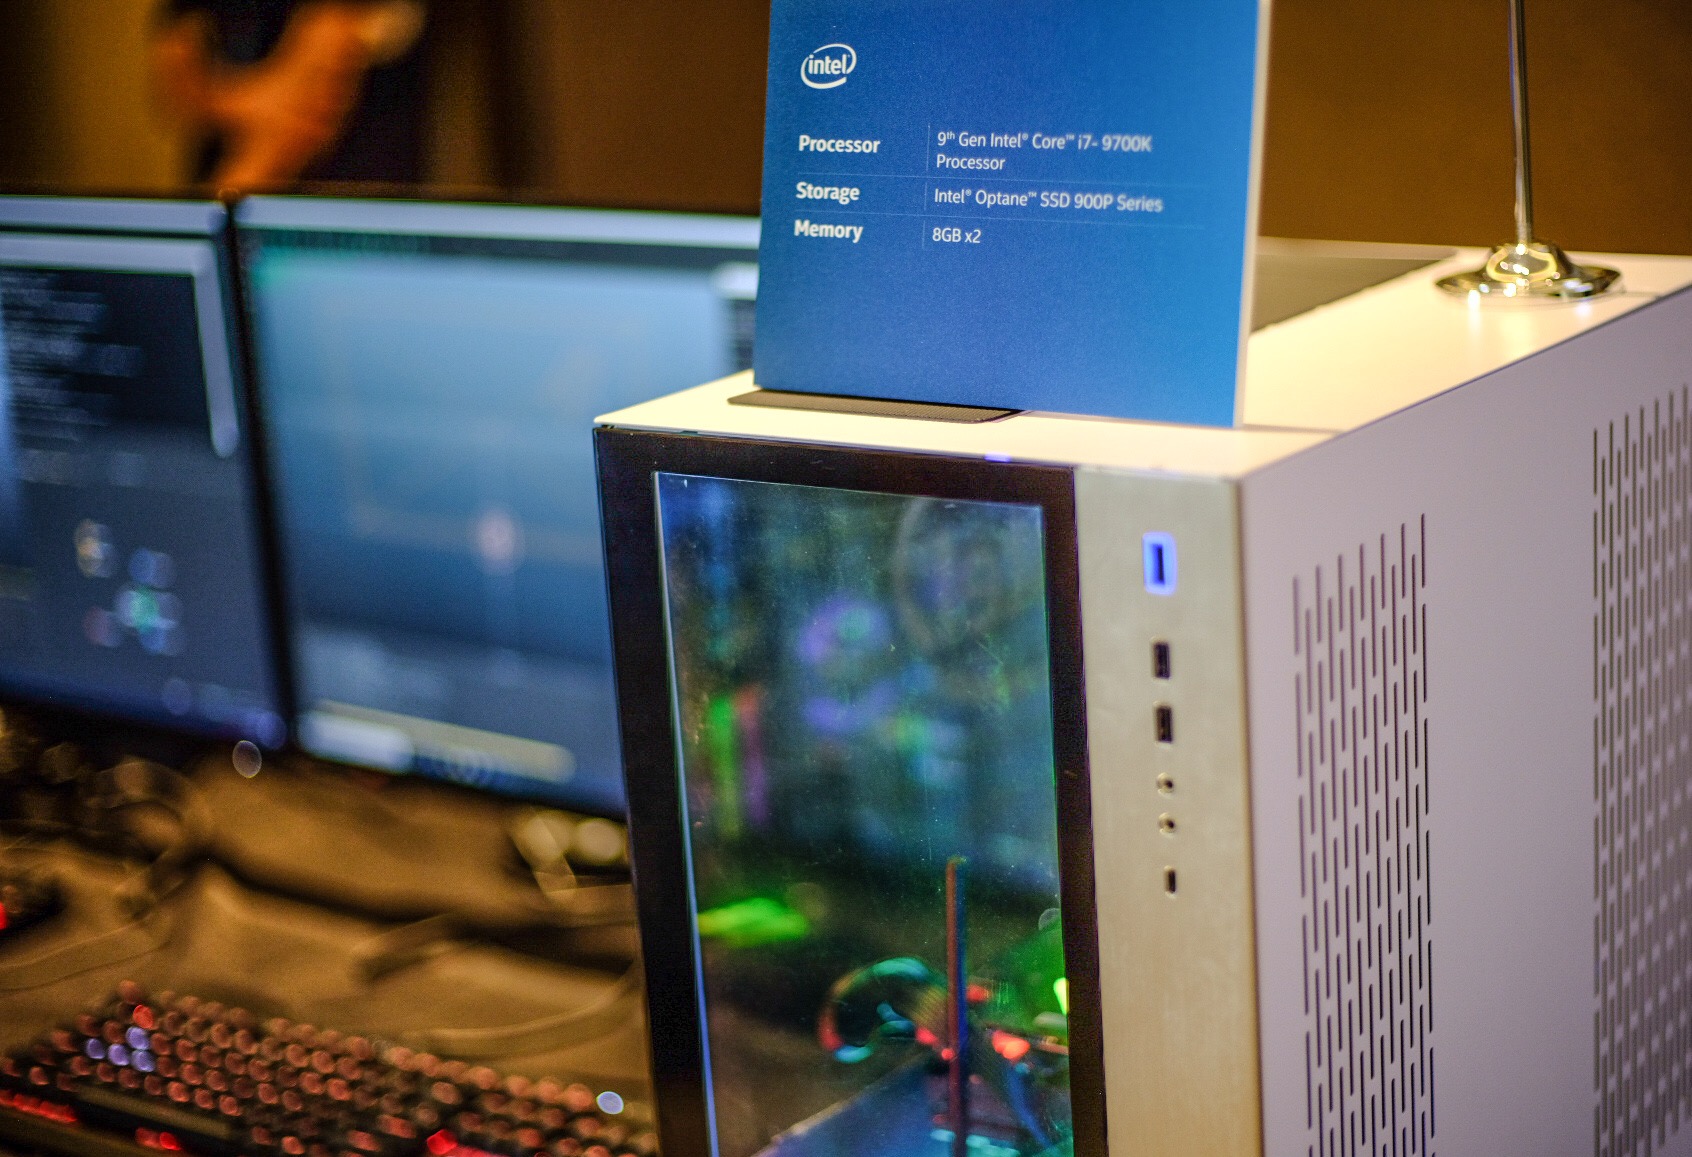
Intel Core i7-9700K PC
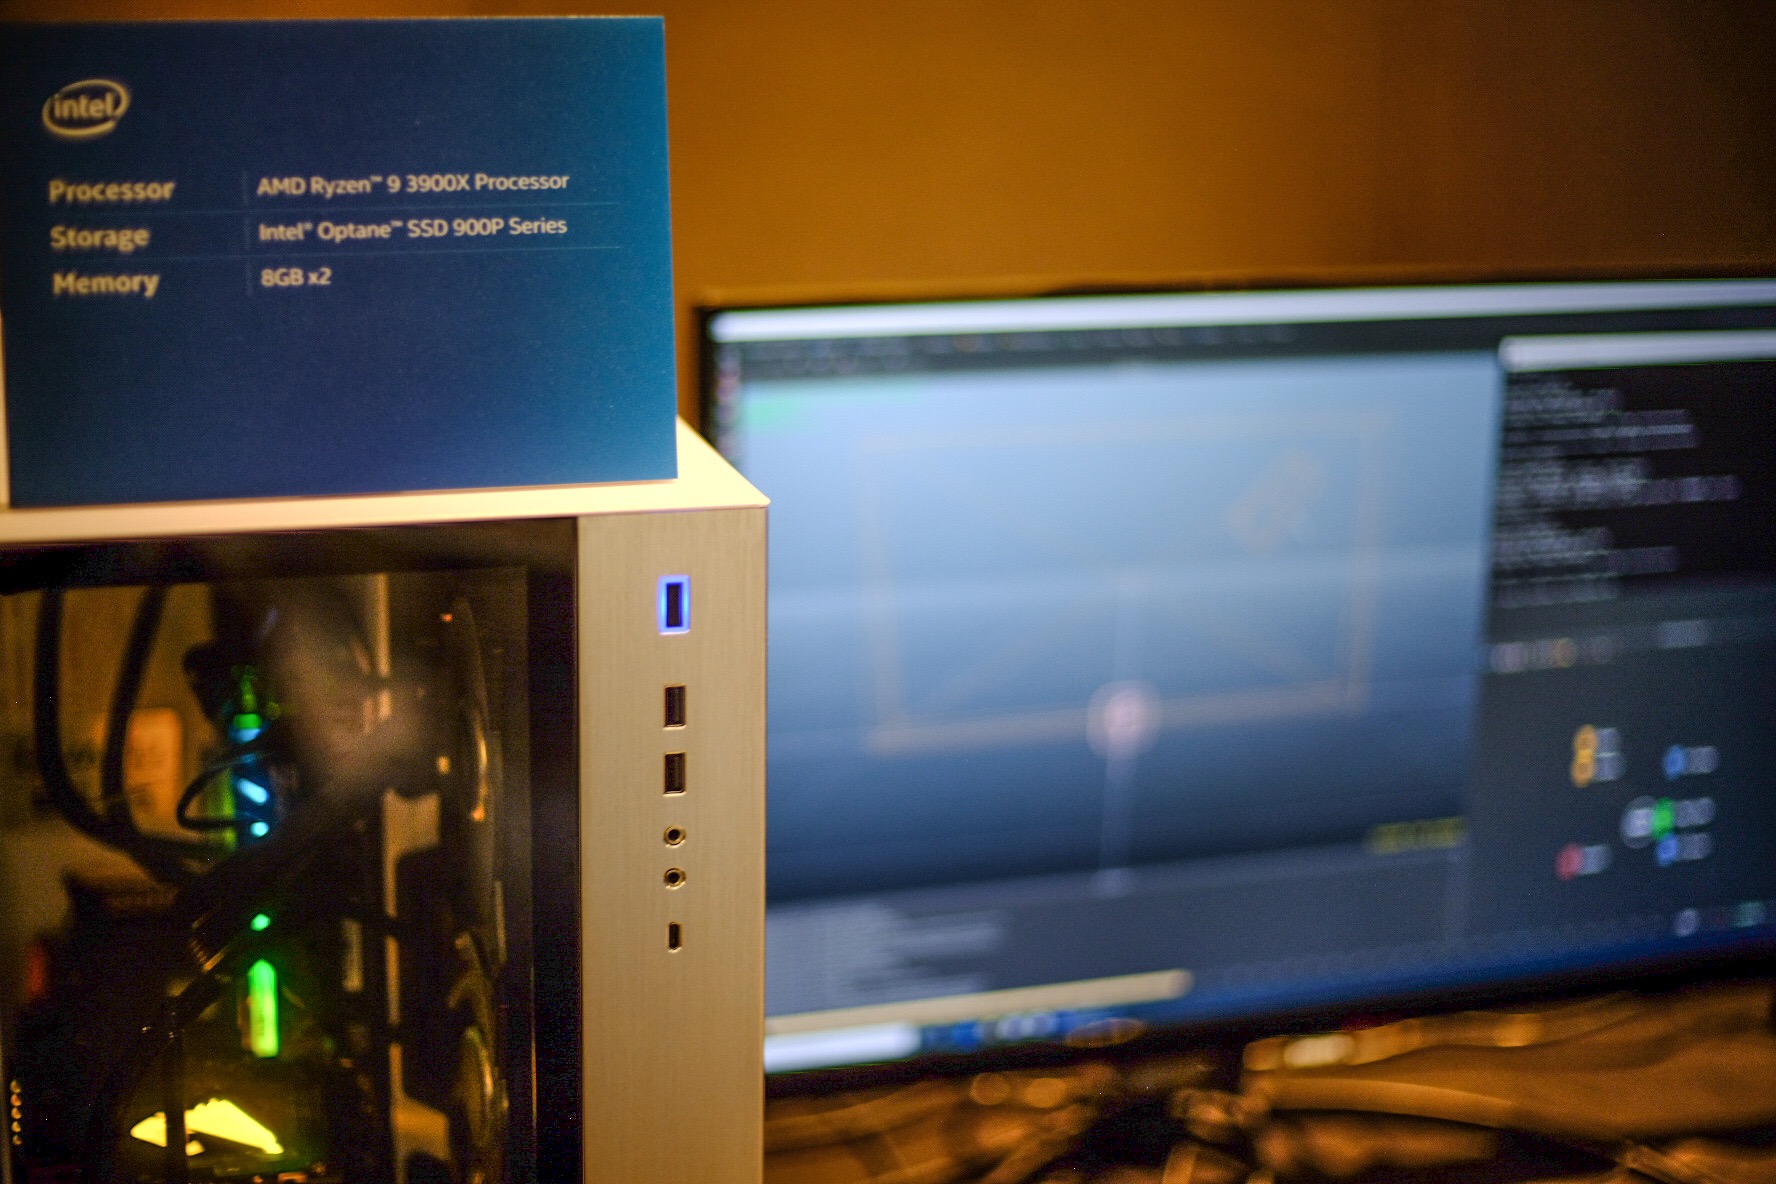
AMD Ryzen 9-3900X PC
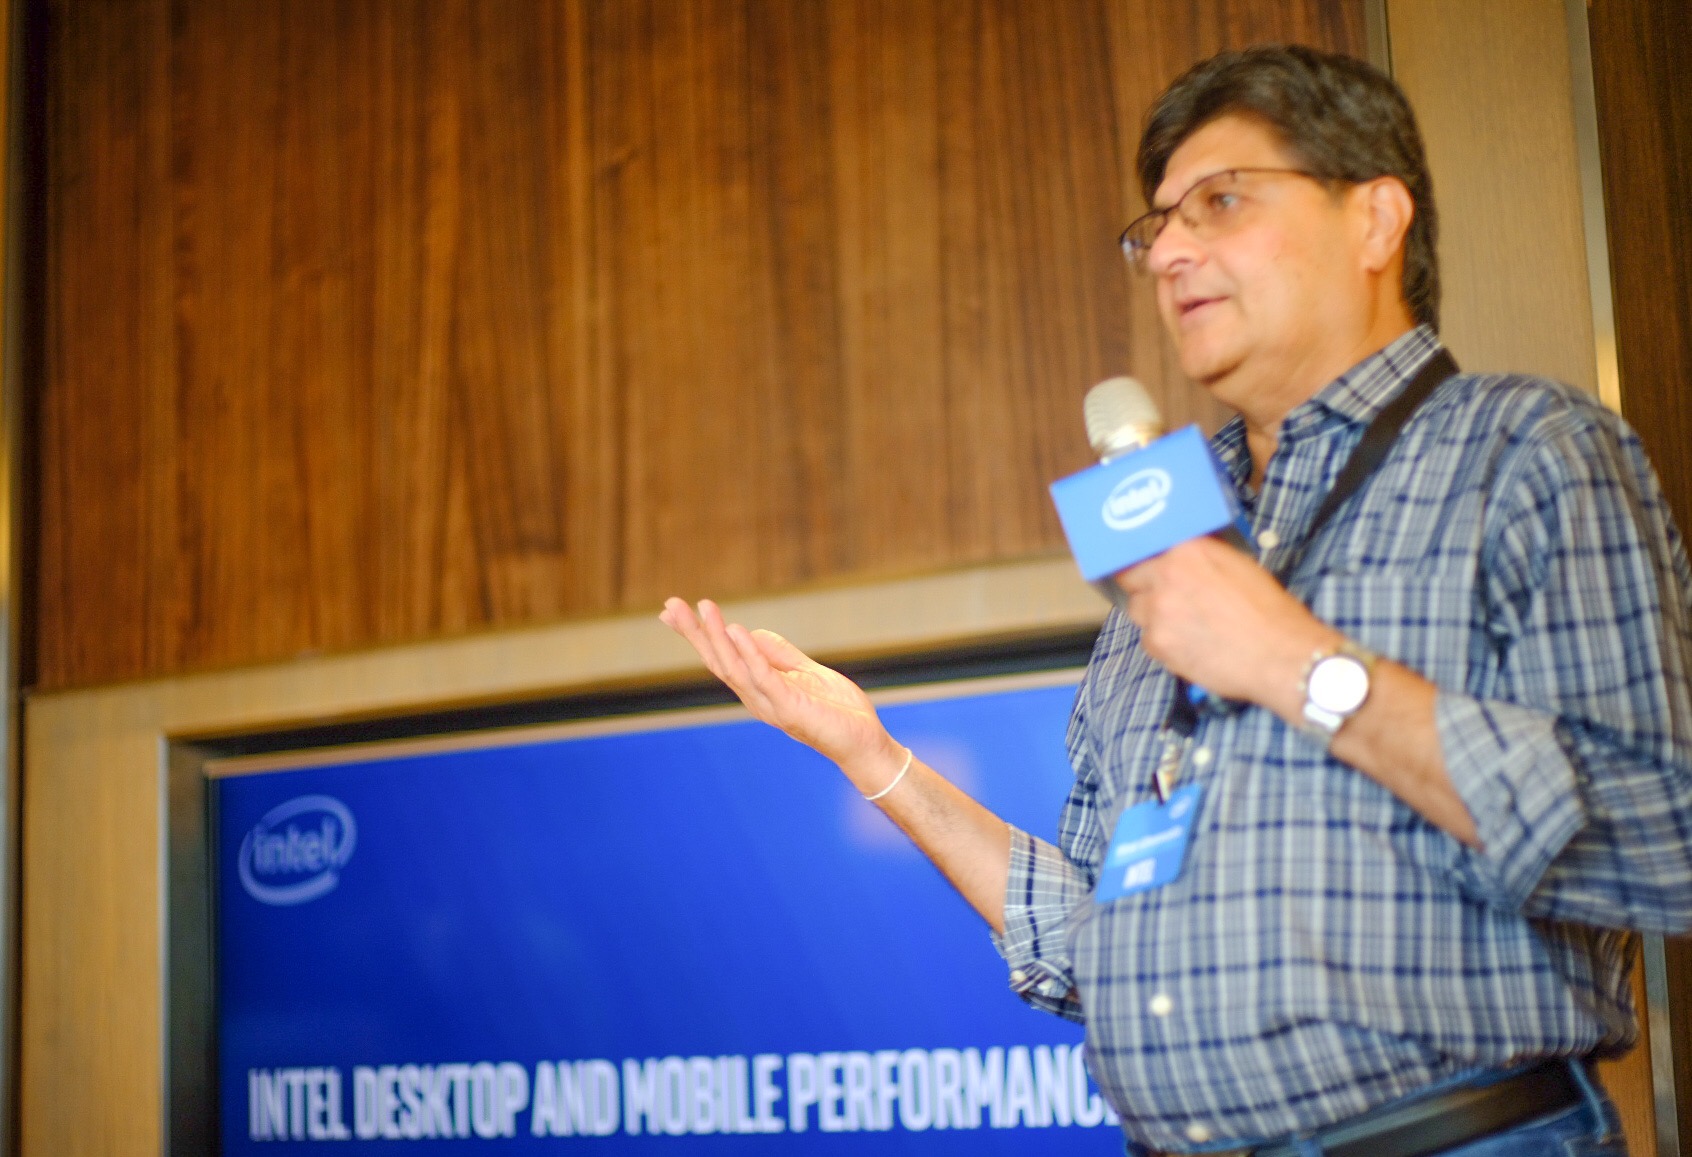
Intel行銷總監 Hiral Gheewala開場就介紹現場 Intel vs AMD裝置之 Live Demo比較
兩台 PC在流體力學 Real Flow Benchmark運算之 Live Demo (Real world Fluid Simulation)
Ryzen 9-3900X 完成評測耗時 17:52
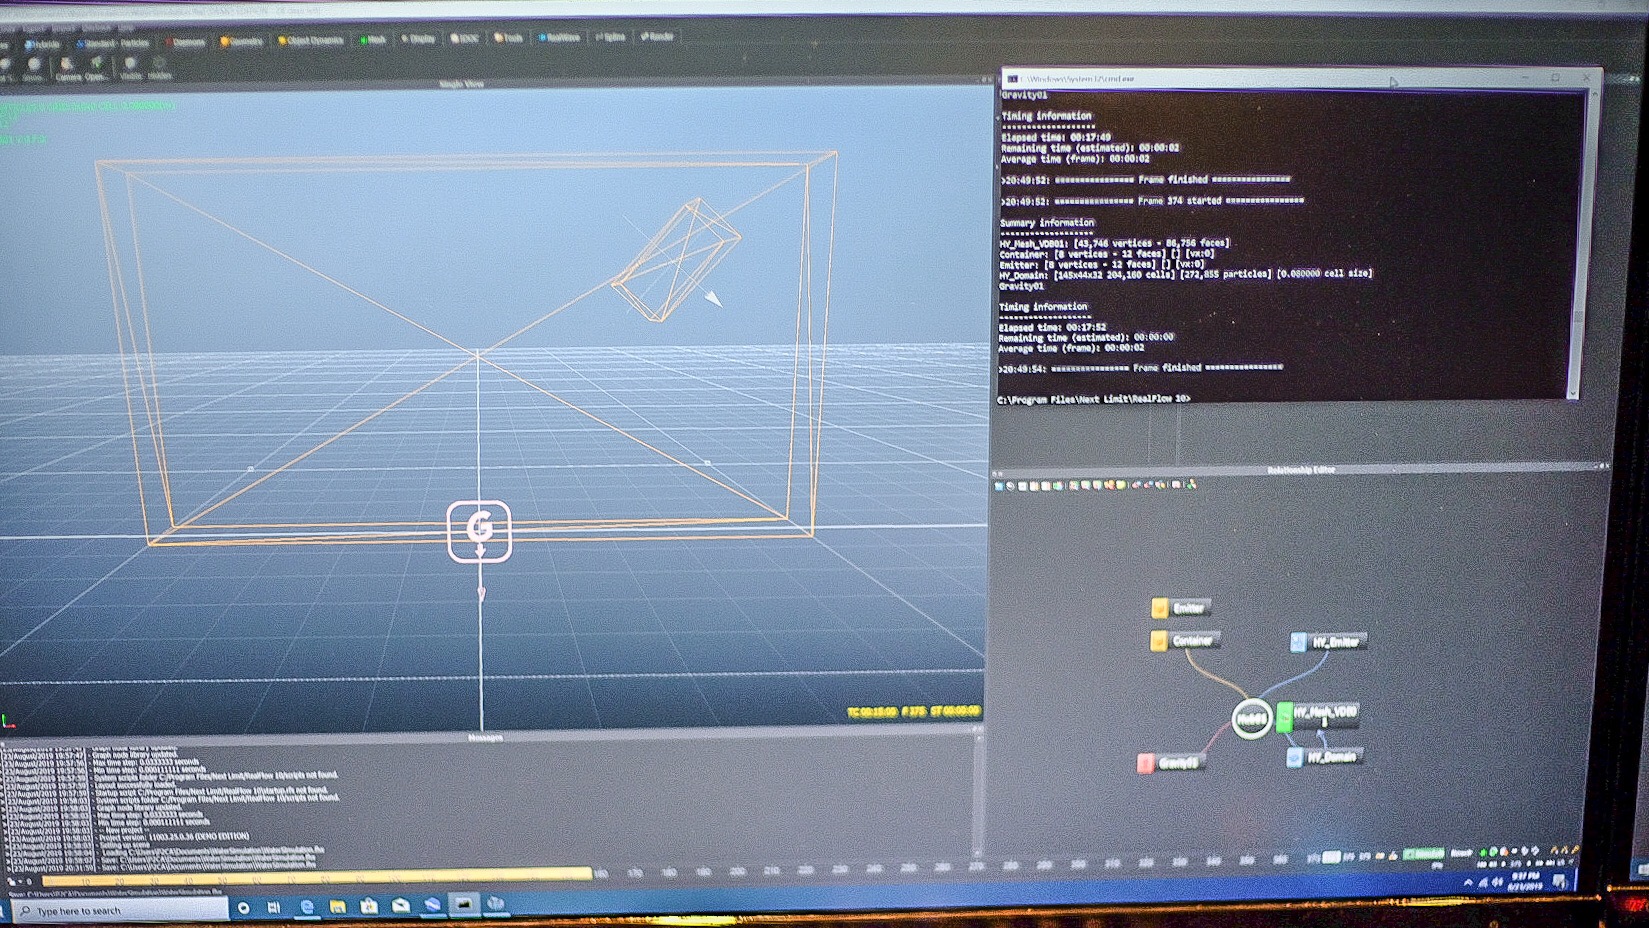
而 Intel Core i7-9700K完成評測耗時15:24,憑藉較低的記憶體延遲而比 Ryzen 9-3900X快了15%的時間

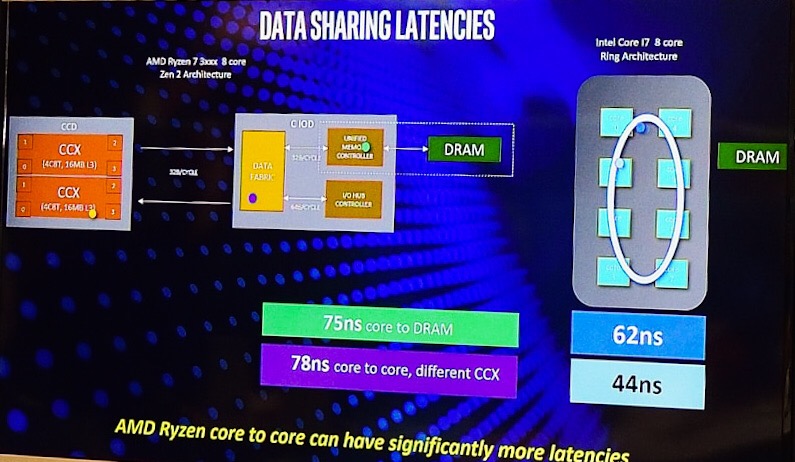
Data Sharing Latency這張圖說明了 Intel在記憶體延遲上的優勢
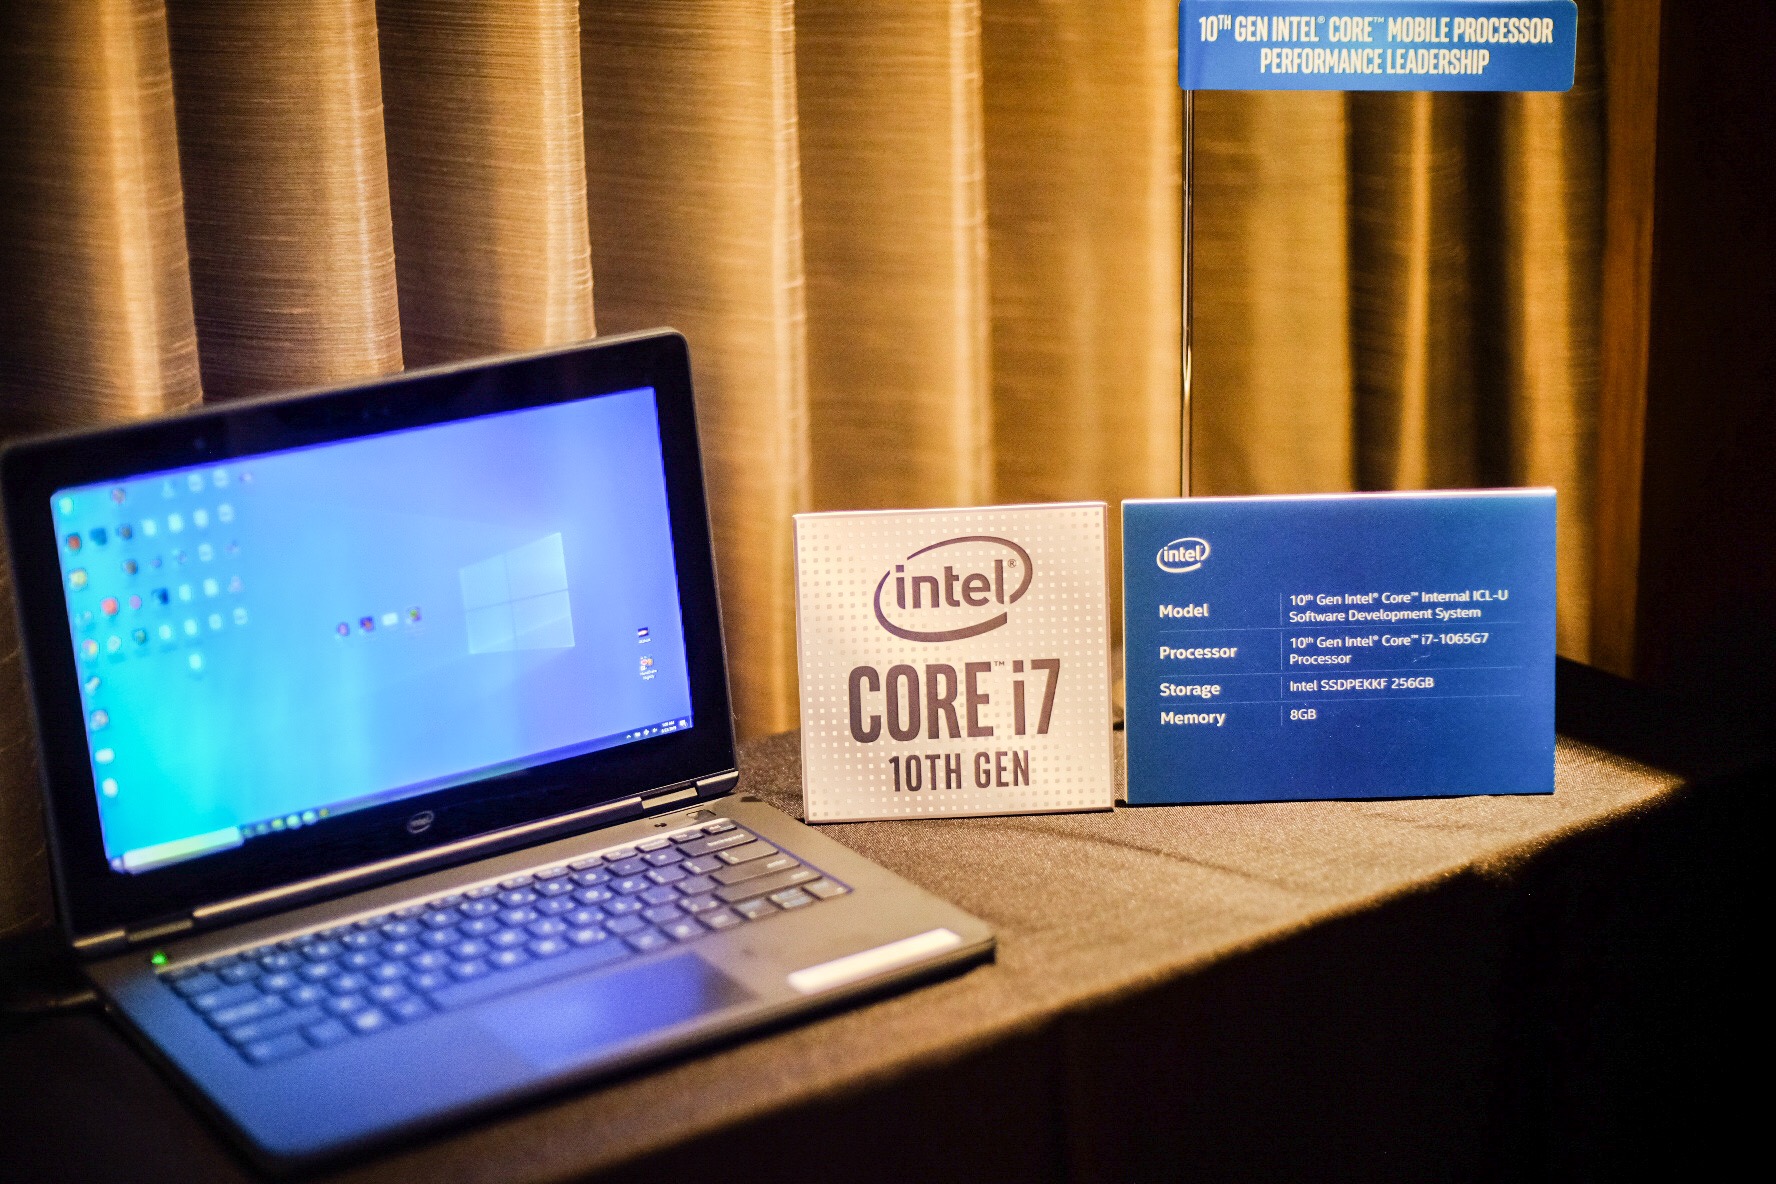
Intel Core i7-1065G7 (Iris Plus 64EU) vs AMD Ryzen 7 3700U在 Total War: THREE KINGDOMS 的 Benchmark之內顯效能
Intel Core i7-1065G7@32.2FPS
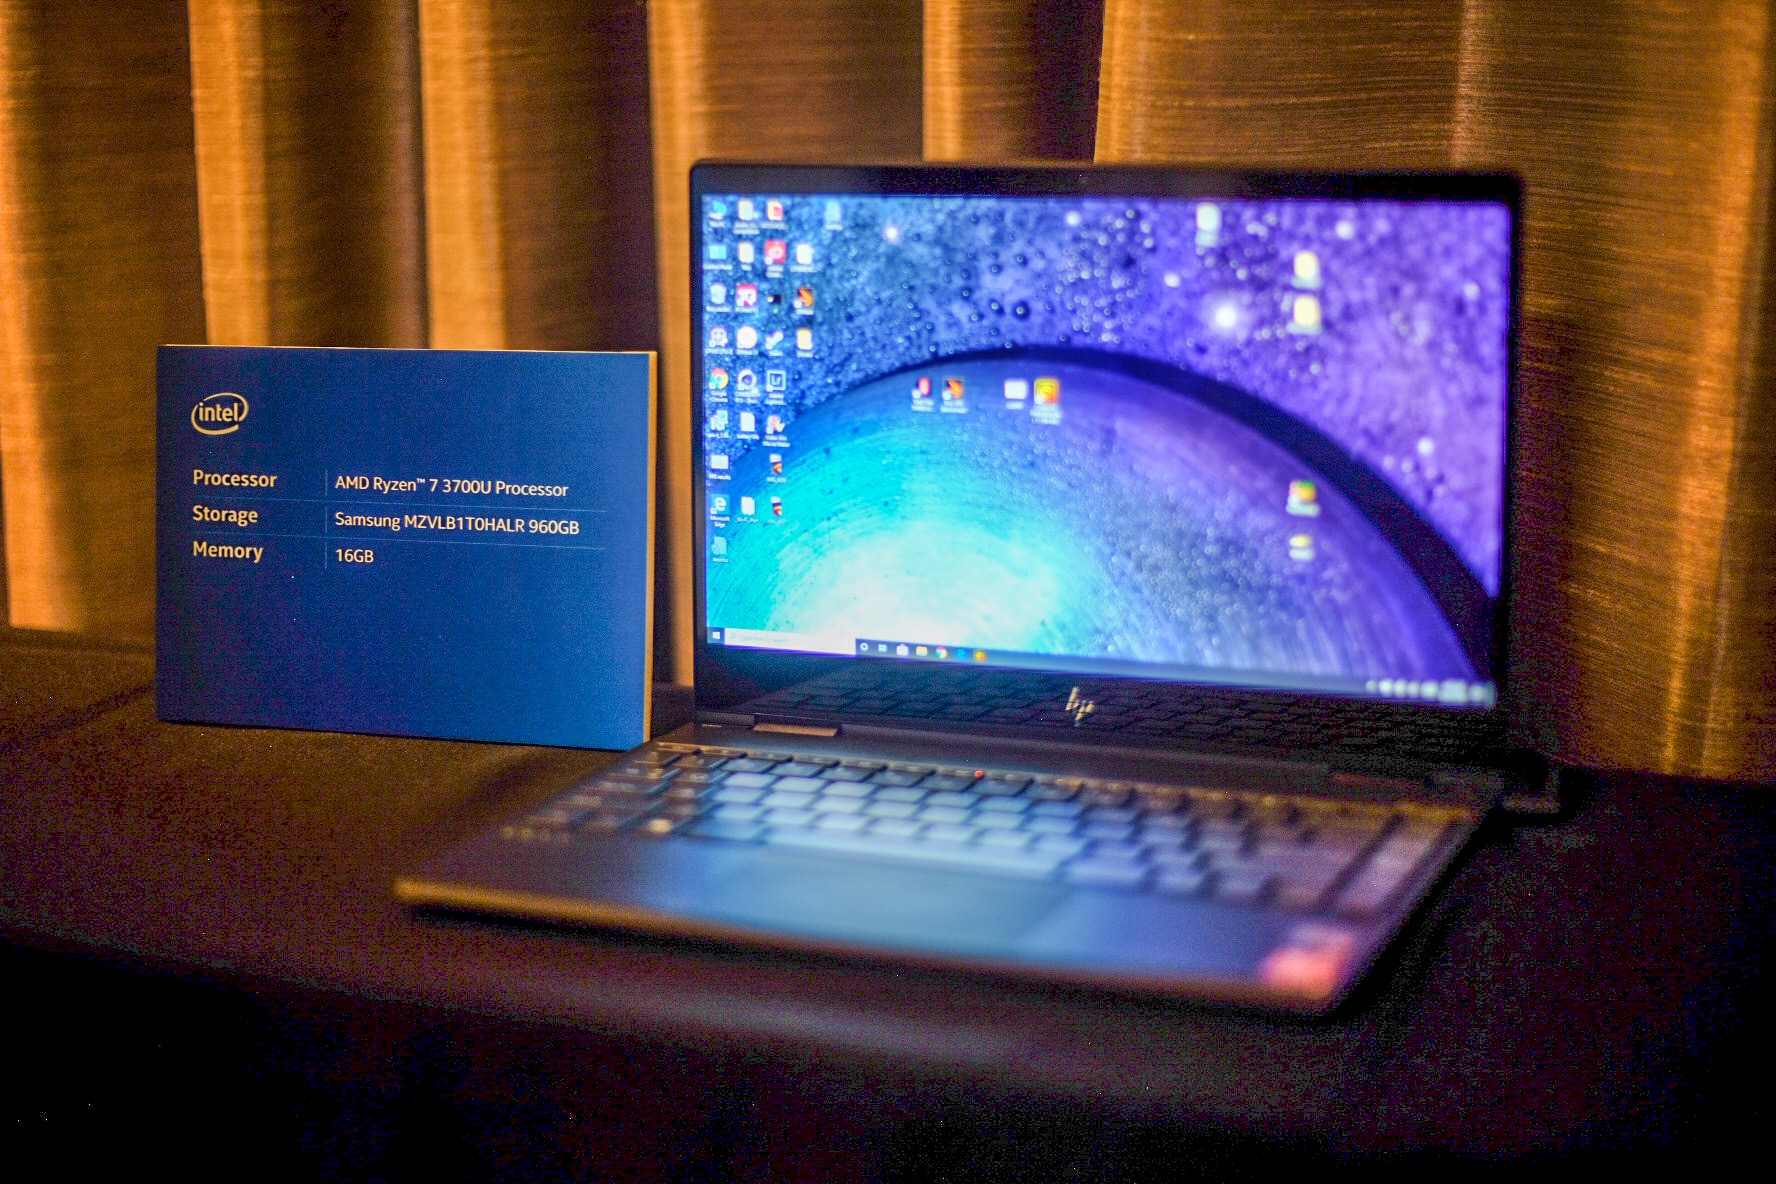
AMD Ryzen 7 3700U@18.5FPS
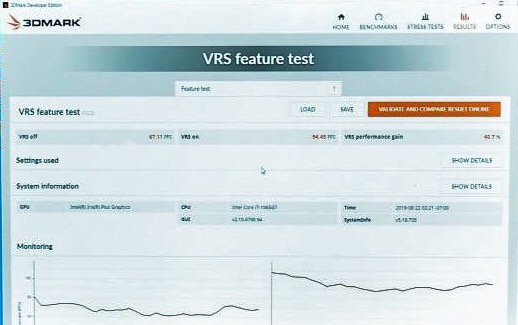
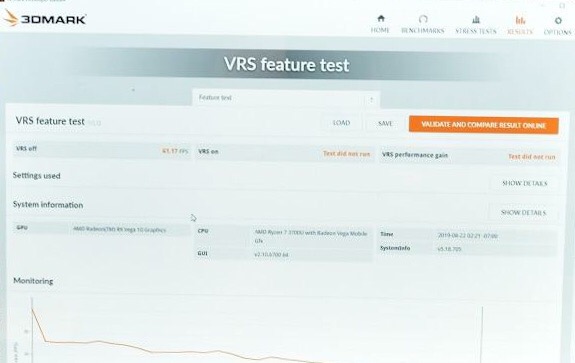
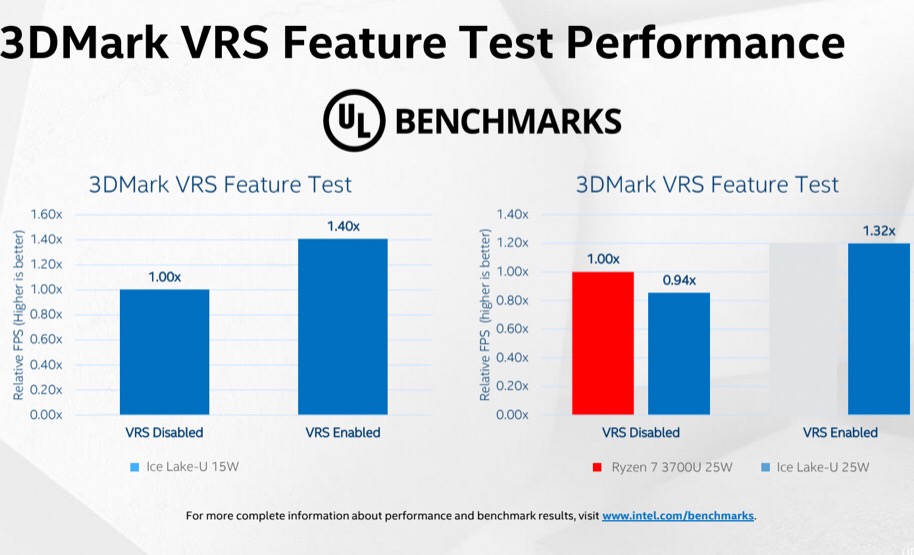
Ryzen 7 3700U vs Ive Lake-U @VRS Feature Test上,Intel Core i7-1065G7所搭載的 Iris Plus內顯,支援著 Variable Rate Shading(VRS)技術,因為在同一個畫面,可針對不同物件定義繪製細節等級以省下資源並提升整體遊戲效能,使得 Core i7-1065G7在 3DMark VRS Feature Test 中領先 Ryzen 7 3700U有 32%的效能
Core i7-1065G7
Ryzen 7 3700U
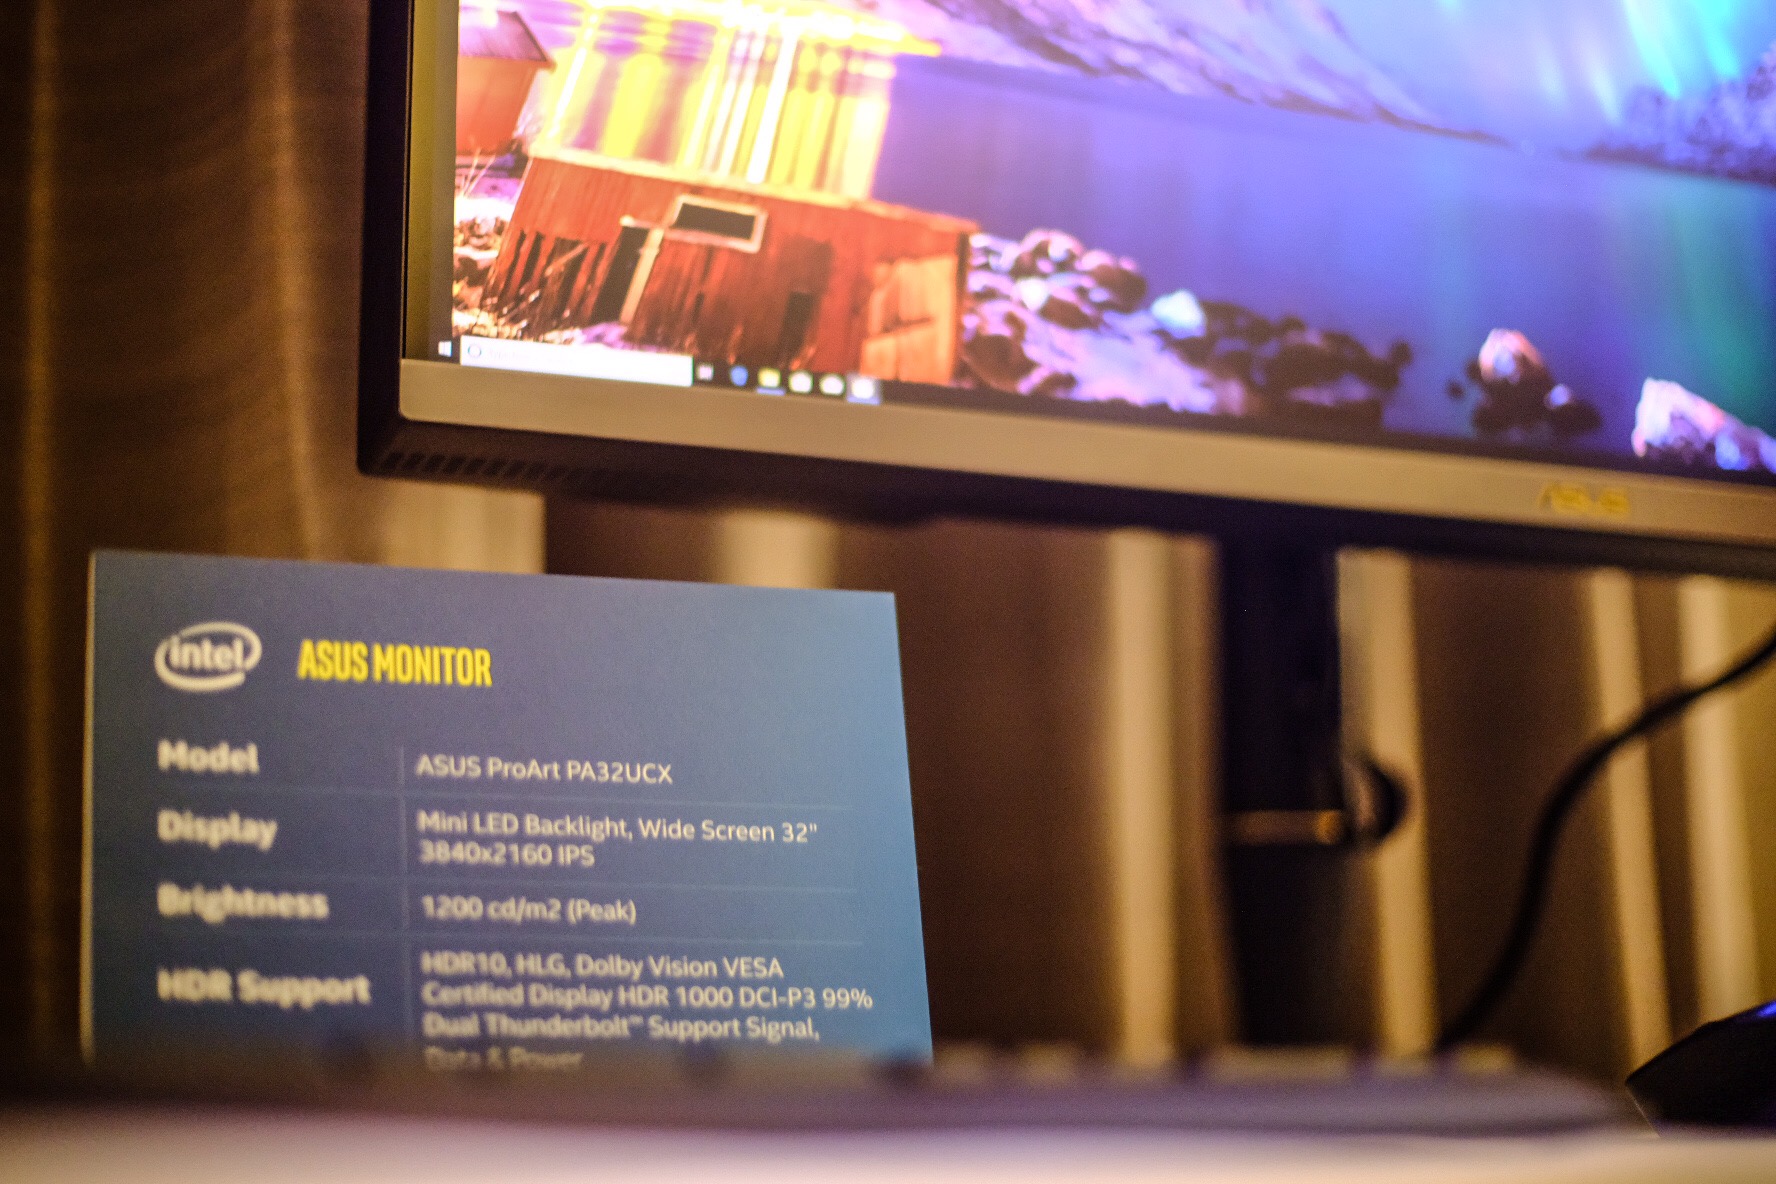
現場還展示了 ASUS 4K Monitor
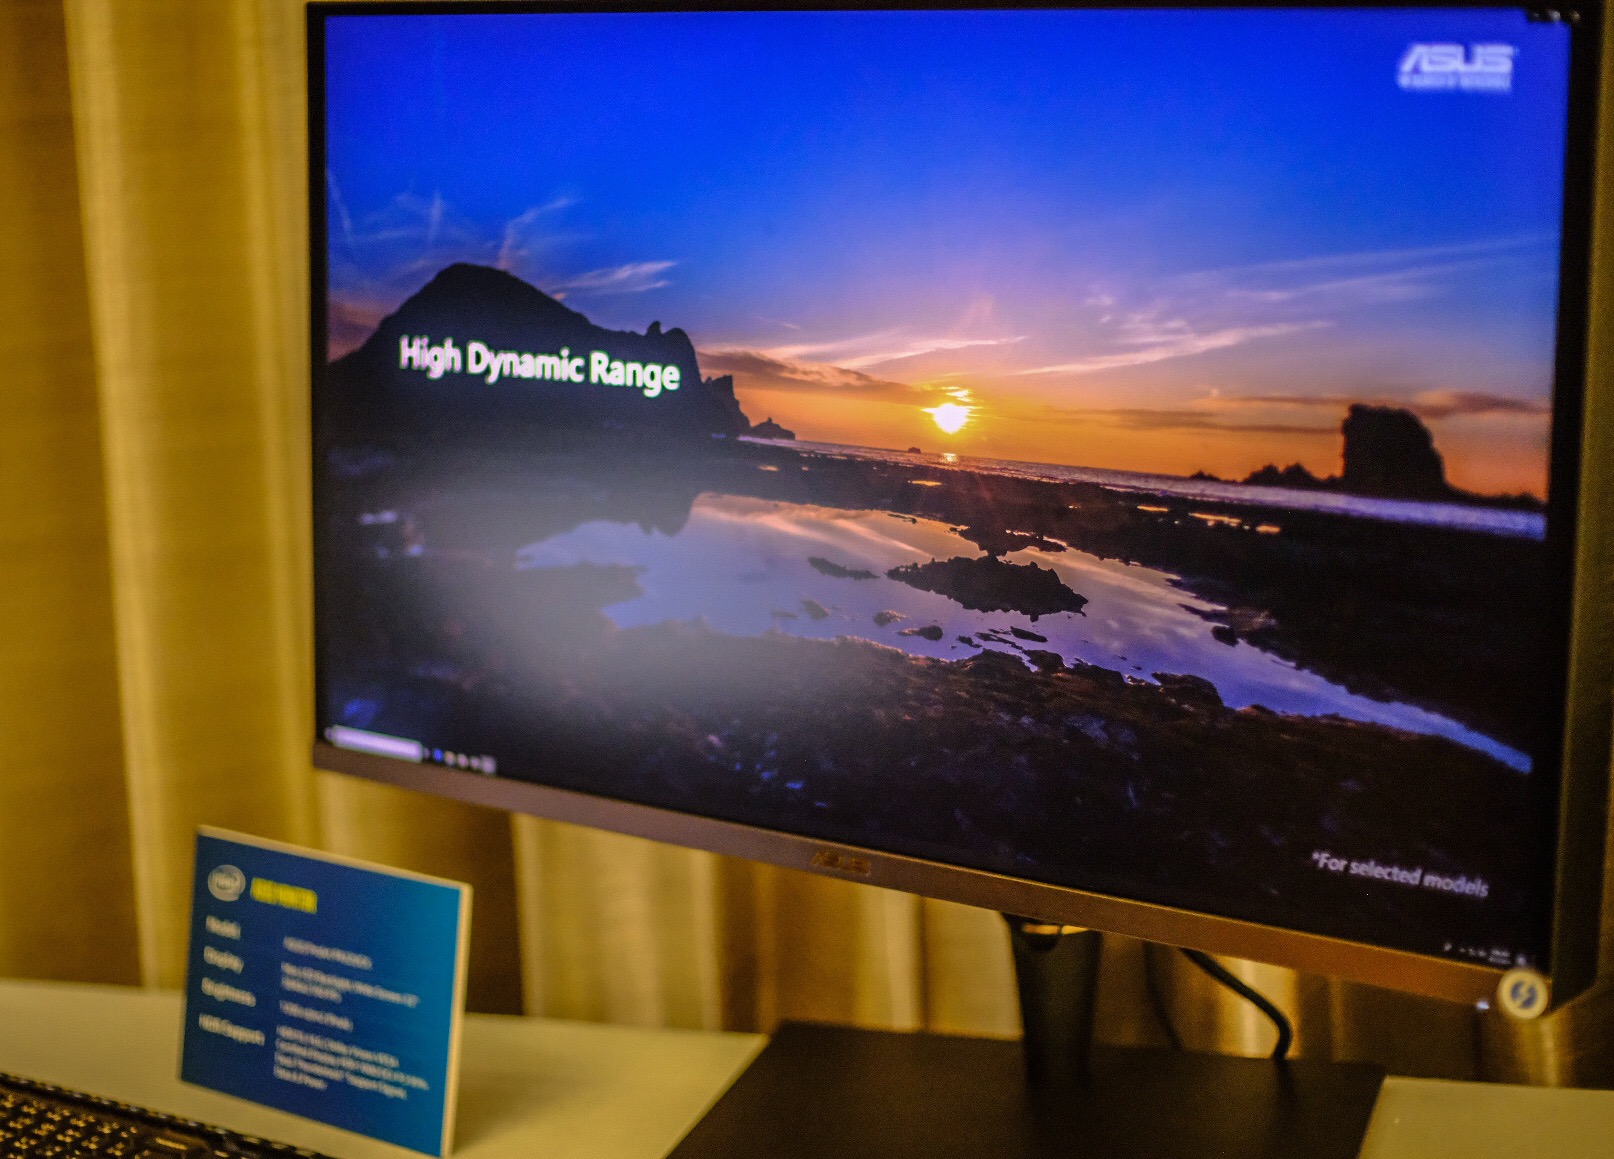
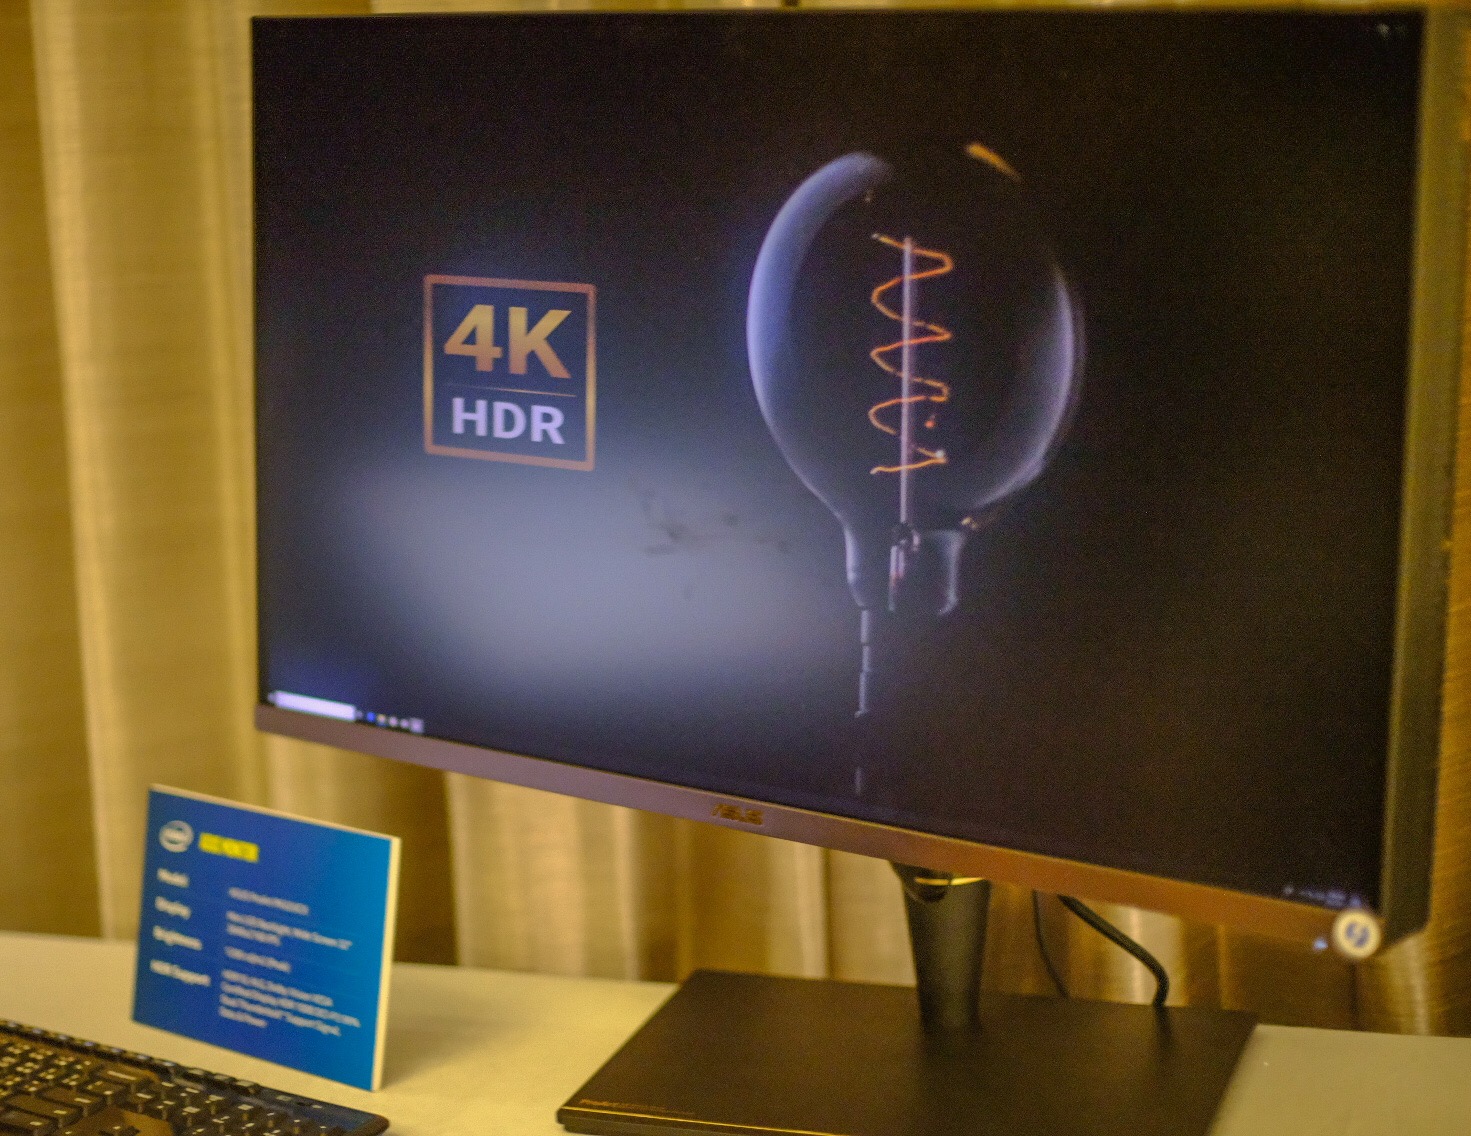
ASUS PA32UCX
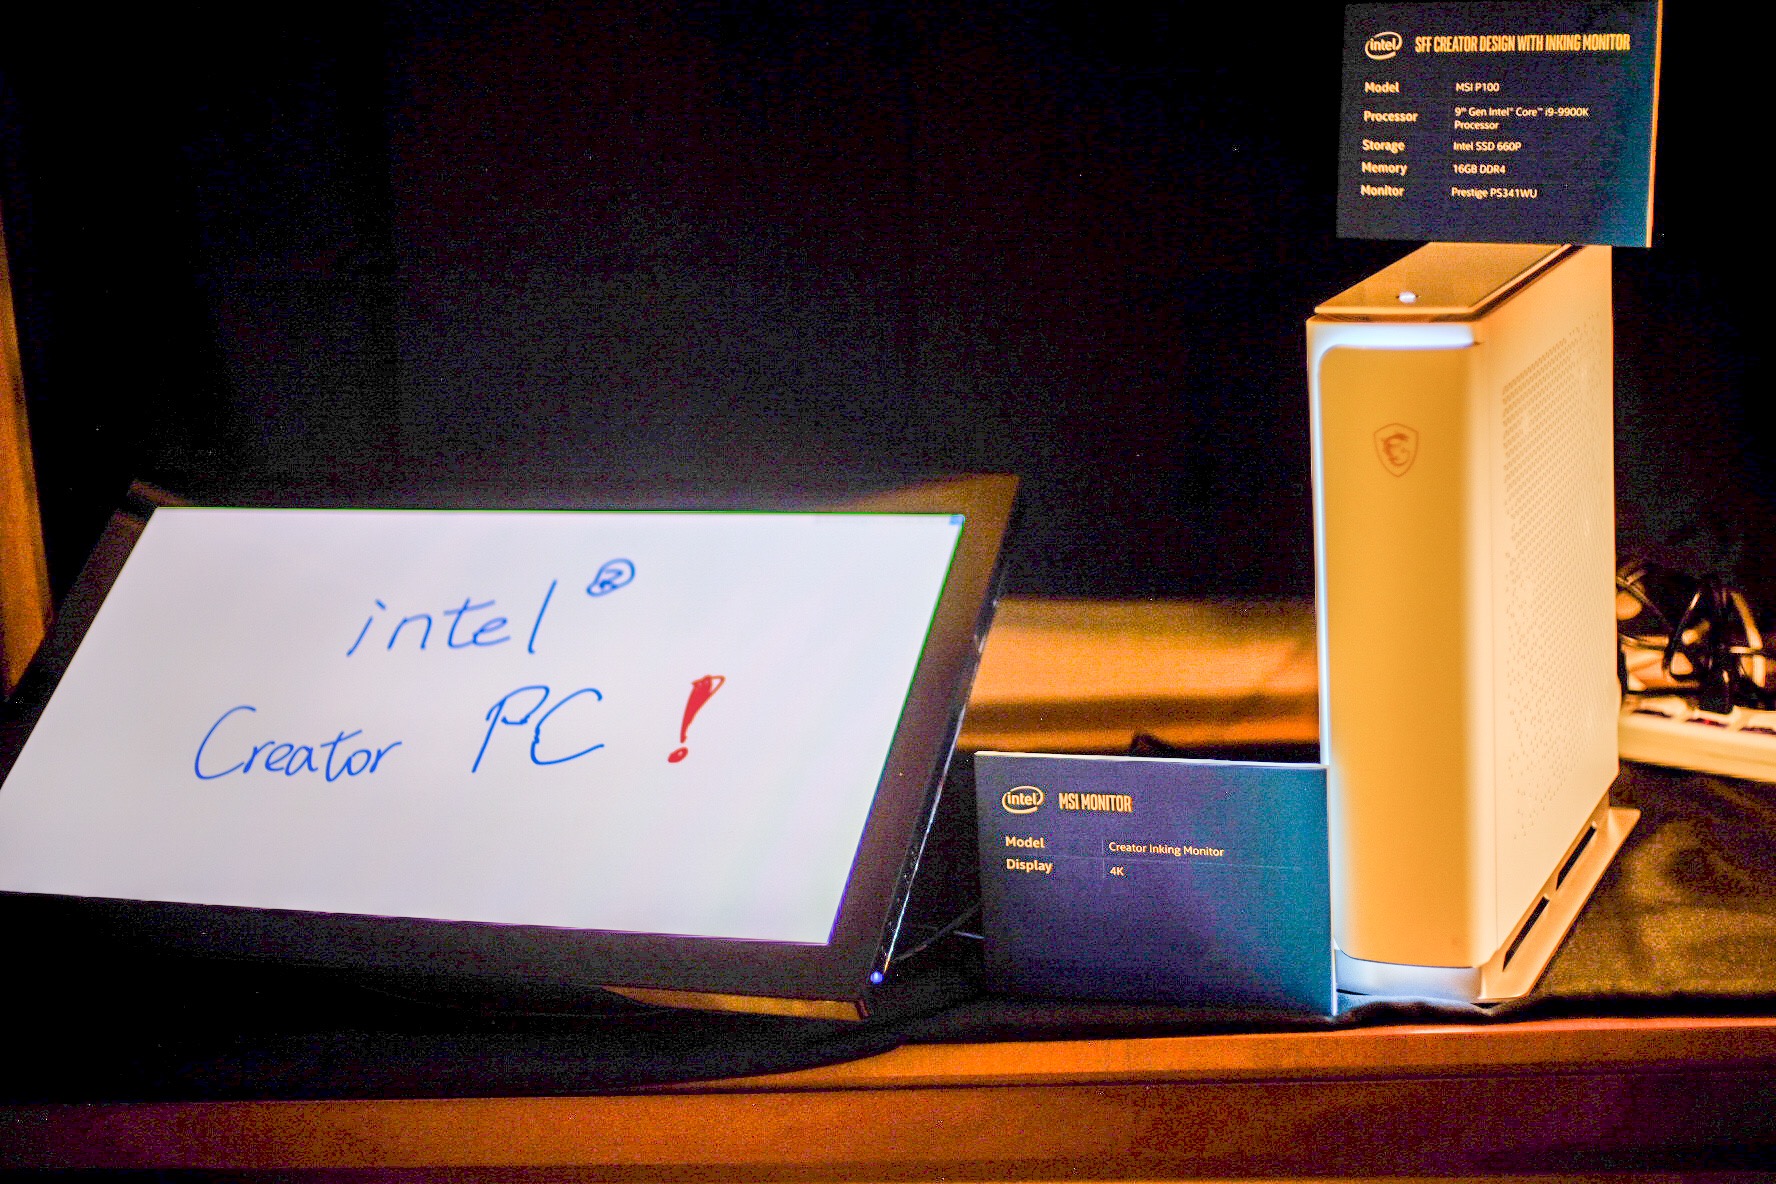
MSI Creator PC
Intel行銷總監 Hiral Gheewala並介紹什麼樣的 Benchmark才能真實反應 PC & Laptop的真實效能,並介紹許多 Benchmark之真實使用情境評測指南 (Real Usage Guides,RUGs)、Memory延遲的比較、Turbo頻率比較
Real Program Real World Real Performance Real Usage
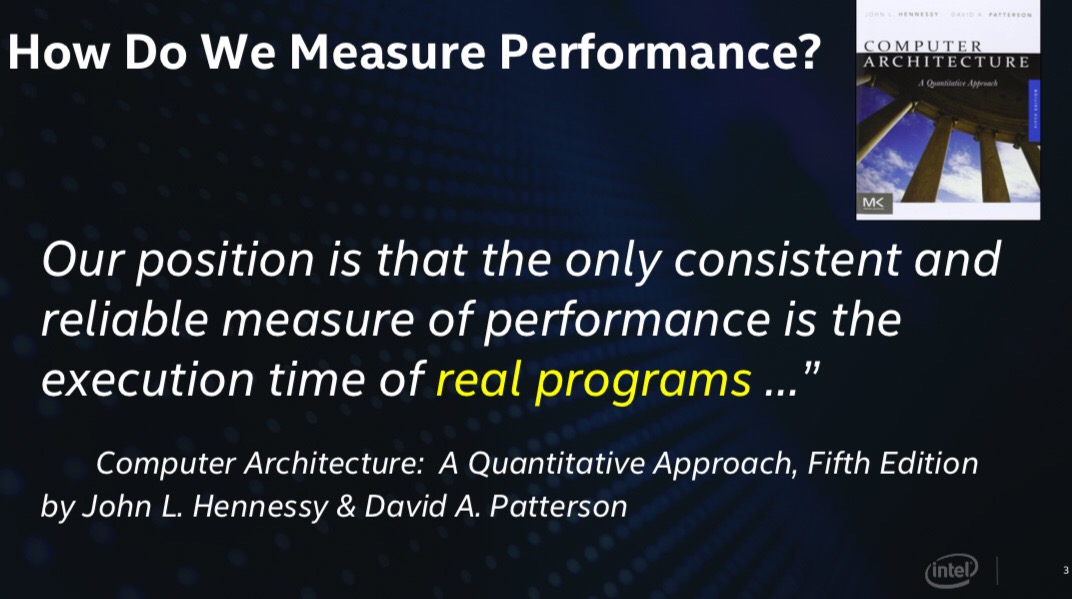
能提升我們在日常使用的工具軟體效能並節省時間才是我們想要的,但市面上又有多少 Benchmrk能模擬日常並忠實反應出其確實的效能呢
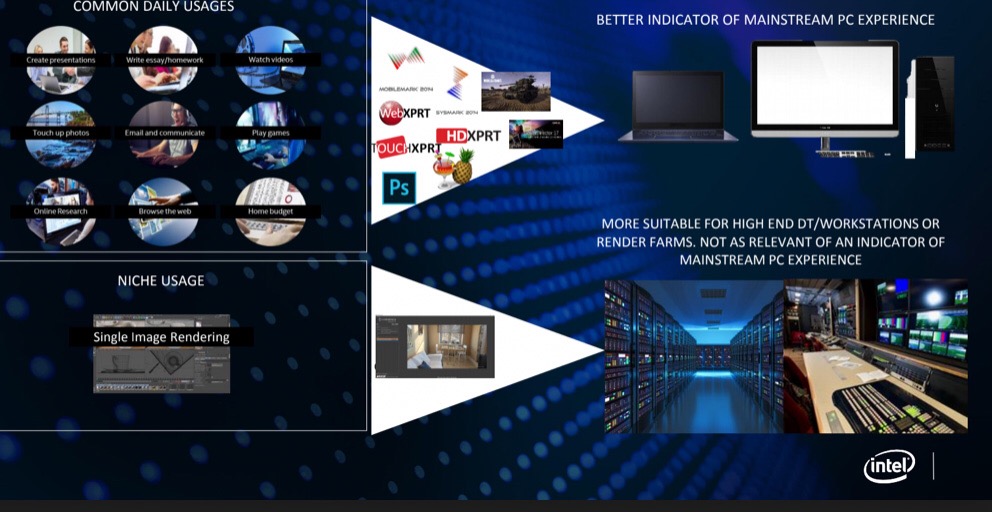
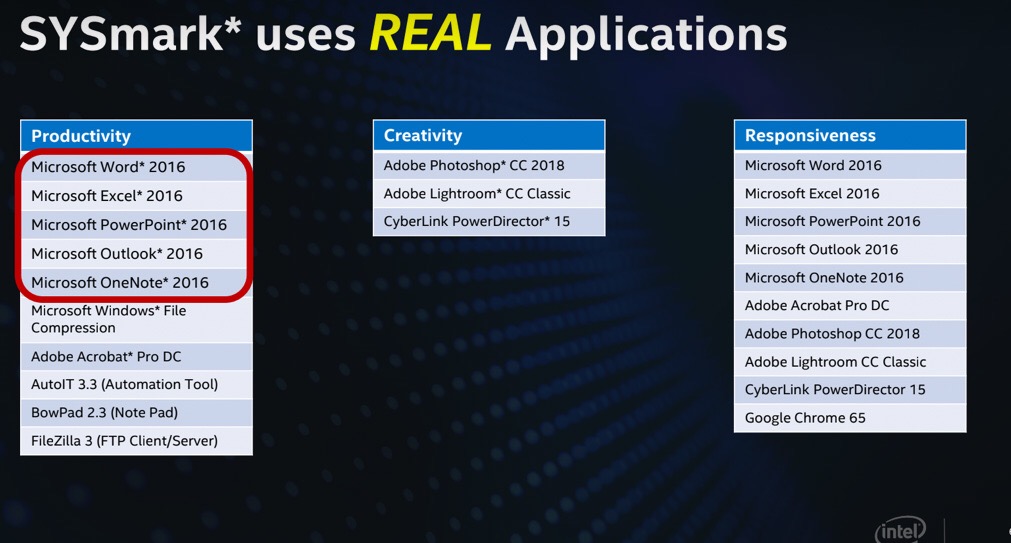
以善用模擬真實環境並能充分反應出真實效能數據的 SYSmark對裝置做評測是應有的認知(SYSmark其與 Cinebench最大的不同在於前者乃是使用最新的指令集及日常生活所使用的應用程式,而非後者只是著墨在老舊 SSE少數指令集已喪失準確性與實用性)
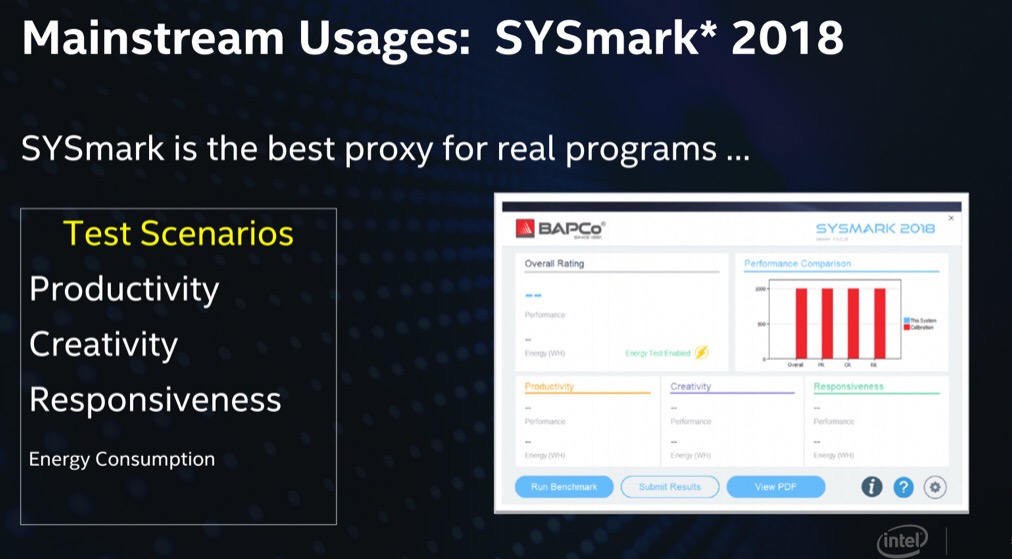
SYSmark多以日常生活使用的應用程式去對裝置評測,例如 Microsoft Office,Adobe、Lightroom、Google Chrome等等
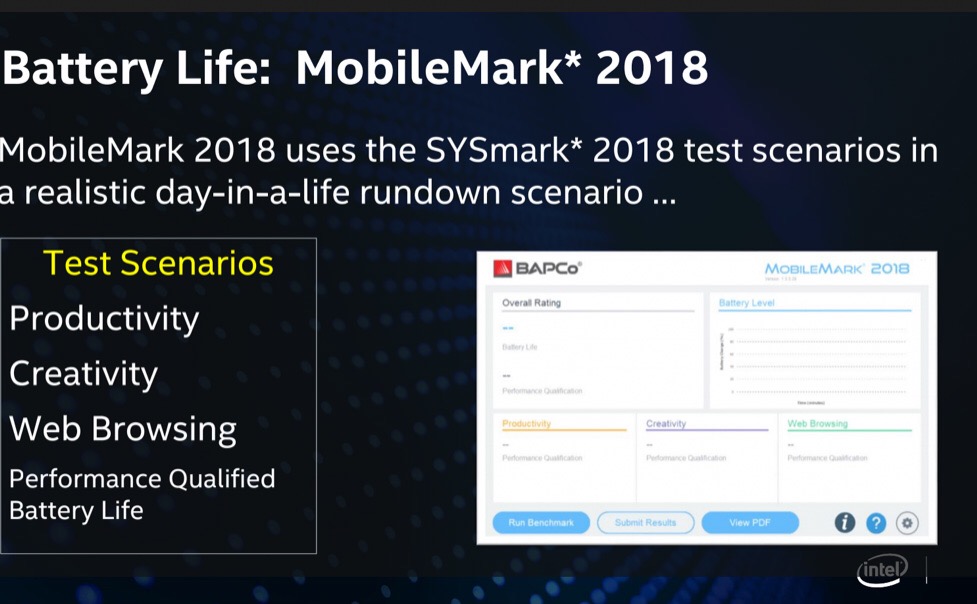
可量測筆電電池使用時間並增長的 Tool-MobileMark
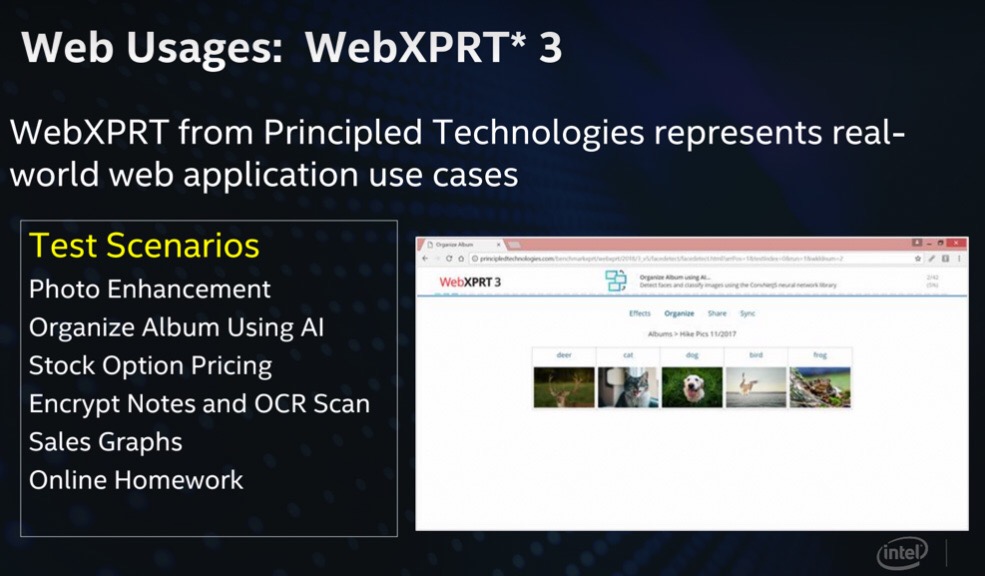
WebXPRT3 評測瀏覽器的效能
Core i9-9900K Compare with Ryzen 9-3900X
Intel雖然輸在 Cinebench R20 Multi CPU Test上,但在多項能模擬真實世界實際應用的測試上卻勝出
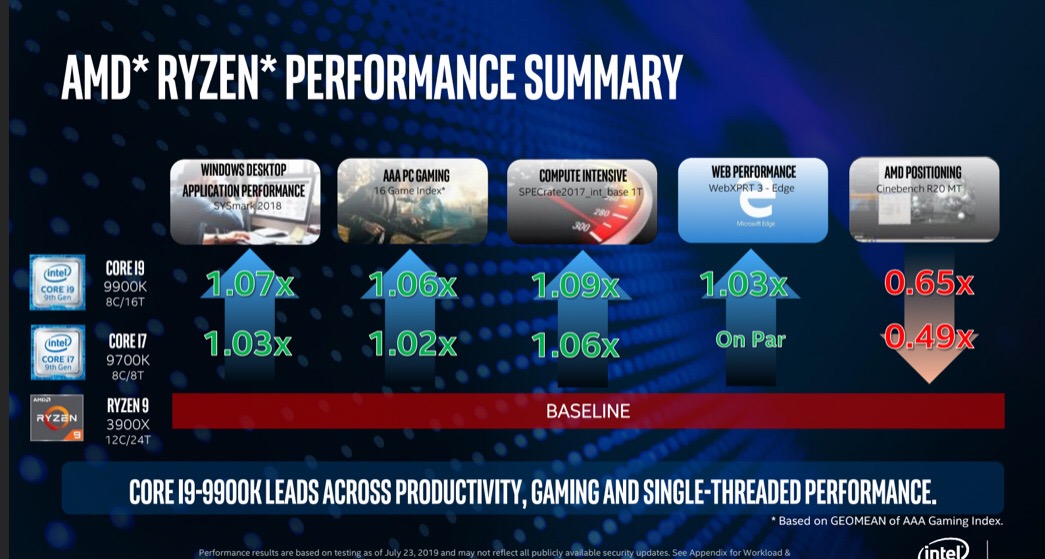
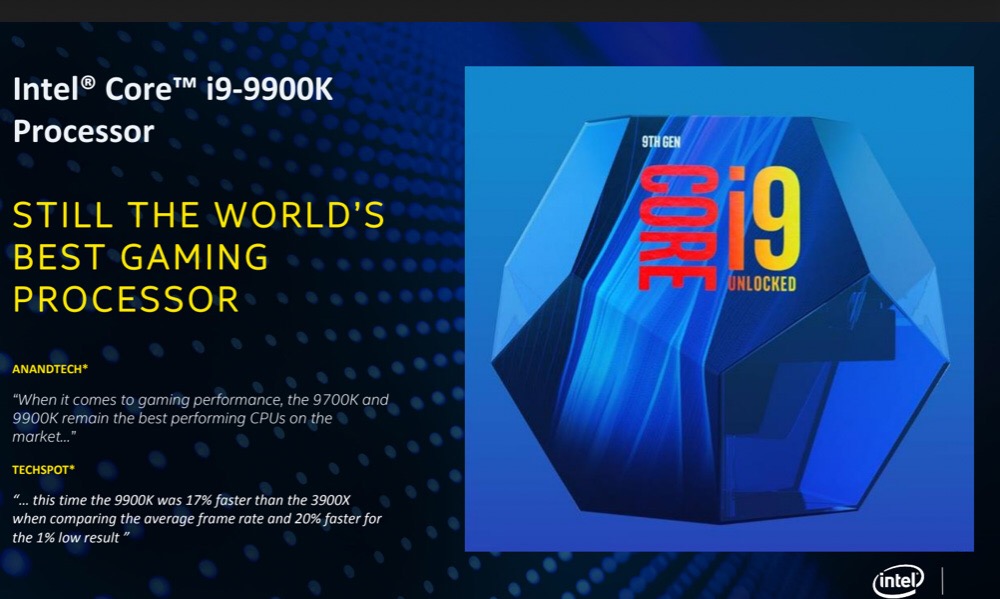
在依賴頻率的遊戲方面 Core i9-9900K仍是當前最強 Gaming處理器
Turbo頻率比較
Intel在 Turbo Boost較 AMD PBO的表現來的突出,尤其反應在更多的核心數能有更高的頻率,在 Gaming方面與 AMD相比能獲得較多的遊戲效能

Variable Ray Shading

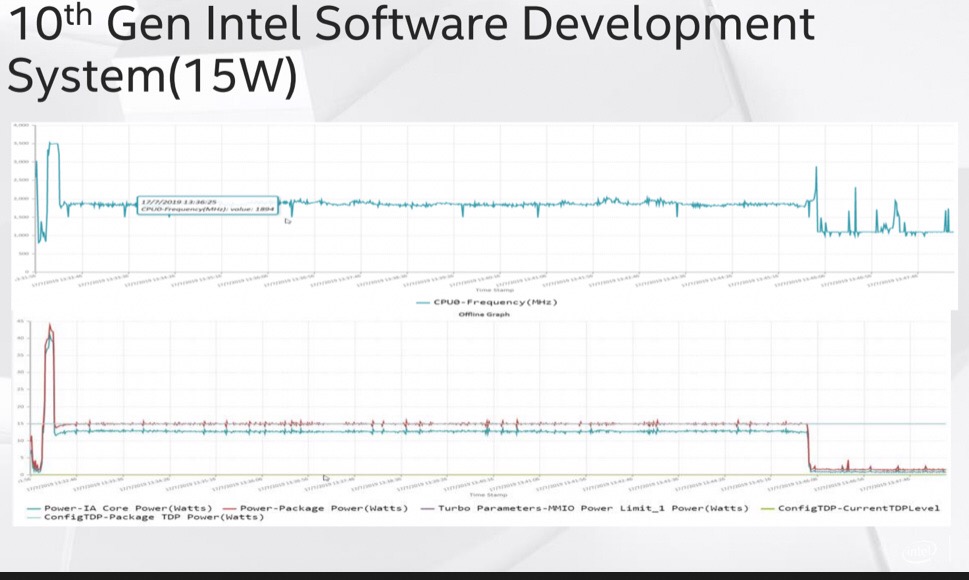
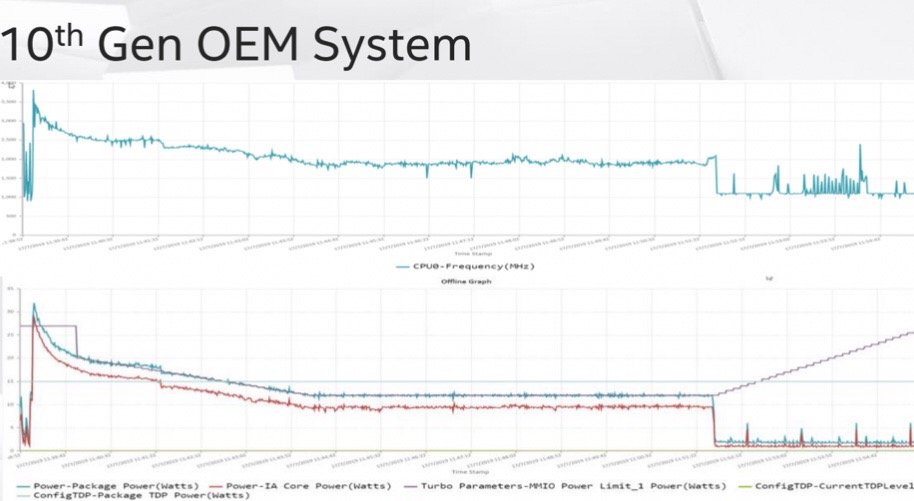
Intel Adapix Dynamic Tuning
Intel Adapix Performance

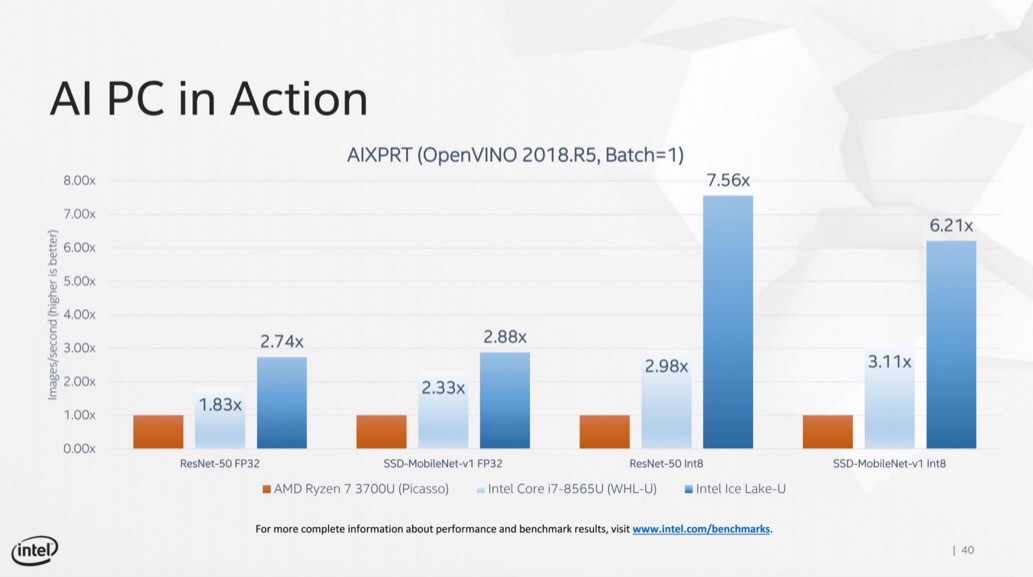
AIXPRT-AI Performance
而 Ice Lake有著 DL Boost的 AI硬體加速技術,以 AIXPRT驗證,Ice Lake的 i7-1065G7憑藉著 DL Boost可達到每秒辨識 164張照片,大幅提升了驗證照片之辨識速度,而 Ryzen 7 3700U每秒僅 26.11 張
這場聚會進行了 4小時,綜觀聚會的重點除了介紹 Ice Lake與 Comet Lake的優勢與取向之外,更多是在闡述如何使用正確合宜的 Benchmark去對裝置做評測,以反應出相同於真實世界的使用狀況做評測依據 (模擬在真實使用情境下的測試) 並介紹例如 SYSmark、MobileMark、WebXprt3等多個能反應真實情境下的常用評測軟體之運作原理與數據 (Real Usage Guides,RUGs) 以導正並破除在使用不合時宜的評測軟體下的迷失,著實讓人耳目一新受益匪淺
台灣的媒體今天來到 Intel南港總部參加美國總部特別為技編準備的 Intel Platform Advance Taiwan Tech Media Gathering聚會
場地的 Intel Logo投影
一進入口即可見玄關上的 POP Intel Platform Advance Taiwan Tech Media Gathering
會場中陳列了 Intel 與友商之 PC & Laptop Show Case並做效能實測比對的 Live Demo
Intel Core i7-9700K PC
AMD Ryzen 9-3900X PC
Intel行銷總監 Hiral Gheewala開場就介紹現場 Intel vs AMD裝置之 Live Demo比較
兩台 PC在流體力學 Real Flow Benchmark運算之 Live Demo (Real world Fluid Simulation)
Ryzen 9-3900X 完成評測耗時 17:52
而 Intel Core i7-9700K完成評測耗時15:24,憑藉較低的記憶體延遲而比 Ryzen 9-3900X快了15%的時間
Data Sharing Latency這張圖說明了 Intel在記憶體延遲上的優勢
Intel Core i7-1065G7 (Iris Plus 64EU) vs AMD Ryzen 7 3700U在 Total War: THREE KINGDOMS 的 Benchmark之內顯效能
Intel Core i7-1065G7@32.2FPS
AMD Ryzen 7 3700U@18.5FPS
Ryzen 7 3700U vs Ive Lake-U @VRS Feature Test上,Intel Core i7-1065G7所搭載的 Iris Plus內顯,支援著 Variable Rate Shading(VRS)技術,因為在同一個畫面,可針對不同物件定義繪製細節等級以省下資源並提升整體遊戲效能,使得 Core i7-1065G7在 3DMark VRS Feature Test 中領先 Ryzen 7 3700U有 32%的效能
Core i7-1065G7
Ryzen 7 3700U
現場還展示了 ASUS 4K Monitor
ASUS PA32UCX
MSI Creator PC
Intel行銷總監 Hiral Gheewala並介紹什麼樣的 Benchmark才能真實反應 PC & Laptop的真實效能,並介紹許多 Benchmark之真實使用情境評測指南 (Real Usage Guides,RUGs)、Memory延遲的比較、Turbo頻率比較
Real Program Real World Real Performance Real Usage
能提升我們在日常使用的工具軟體效能並節省時間才是我們想要的,但市面上又有多少 Benchmrk能模擬日常並忠實反應出其確實的效能呢
以善用模擬真實環境並能充分反應出真實效能數據的 SYSmark對裝置做評測是應有的認知(SYSmark其與 Cinebench最大的不同在於前者乃是使用最新的指令集及日常生活所使用的應用程式,而非後者只是著墨在老舊 SSE少數指令集已喪失準確性與實用性)
SYSmark多以日常生活使用的應用程式去對裝置評測,例如 Microsoft Office,Adobe、Lightroom、Google Chrome等等
可量測筆電電池使用時間並增長的 Tool-MobileMark
WebXPRT3 評測瀏覽器的效能
Core i9-9900K Compare with Ryzen 9-3900X
Intel雖然輸在 Cinebench R20 Multi CPU Test上,但在多項能模擬真實世界實際應用的測試上卻勝出
在依賴頻率的遊戲方面 Core i9-9900K仍是當前最強 Gaming處理器
Turbo頻率比較
Intel在 Turbo Boost較 AMD PBO的表現來的突出,尤其反應在更多的核心數能有更高的頻率,在 Gaming方面與 AMD相比能獲得較多的遊戲效能
Variable Ray Shading
Intel Adapix Dynamic Tuning
Intel Adapix Performance
AIXPRT-AI Performance
而 Ice Lake有著 DL Boost的 AI硬體加速技術,以 AIXPRT驗證,Ice Lake的 i7-1065G7憑藉著 DL Boost可達到每秒辨識 164張照片,大幅提升了驗證照片之辨識速度,而 Ryzen 7 3700U每秒僅 26.11 張
這場聚會進行了 4小時,綜觀聚會的重點除了介紹 Ice Lake與 Comet Lake的優勢與取向之外,更多是在闡述如何使用正確合宜的 Benchmark去對裝置做評測,以反應出相同於真實世界的使用狀況做評測依據 (模擬在真實使用情境下的測試) 並介紹例如 SYSmark、MobileMark、WebXprt3等多個能反應真實情境下的常用評測軟體之運作原理與數據 (Real Usage Guides,RUGs) 以導正並破除在使用不合時宜的評測軟體下的迷失,著實讓人耳目一新受益匪淺