前言及「Rocket Lake-S」介紹:
全新第 11代 Intel® Core™系列桌上型處理器 「Rocket Lake-S」 已於今日效能解禁,有關處理器開箱以及主機板介紹的部分已經在先前發表,這裡就不再贅述
「Rocket Lake-S」為全新 「Cypress Cove」微架構重新封裝,並加入 AVX-512指令集,這也是 AVX-512指令集第一次出現在桌上型處理器上

「Rocket Lake-S」擁有 PCIe 4.0 20 Lanes,其中 PCIe 4.0 x4分配給 M.2 NVMe SSD,PCIe 4.0 x16則分配給顯示卡,內顯為最新 Xe GPU GT1 (UHD 750),擁有 32個 EU,Intel表示,全新「Cypress Cove」架構的「Rocket Lake-S」在 IPC方面比「Comet Lake-S」有不少的性能提升,至於實際狀況如何則有待本篇測試分曉

身為「Rocket Lake-S」之旗艦型處理器的 Core i9-11900K (KF)在超頻及散熱的表現不亞於 Intel Core i9-10900K (KF),但因為兩者之核心數不同,因此在多線程的效能上自然會有差別,唯 Core i9-11900K (KF)的表現仍然值得期待
11代處理器與 10代處理器的不同點

在 500 Series Chip方面的更新比較
建議使用 B560以上的晶片組主機板效能較完善

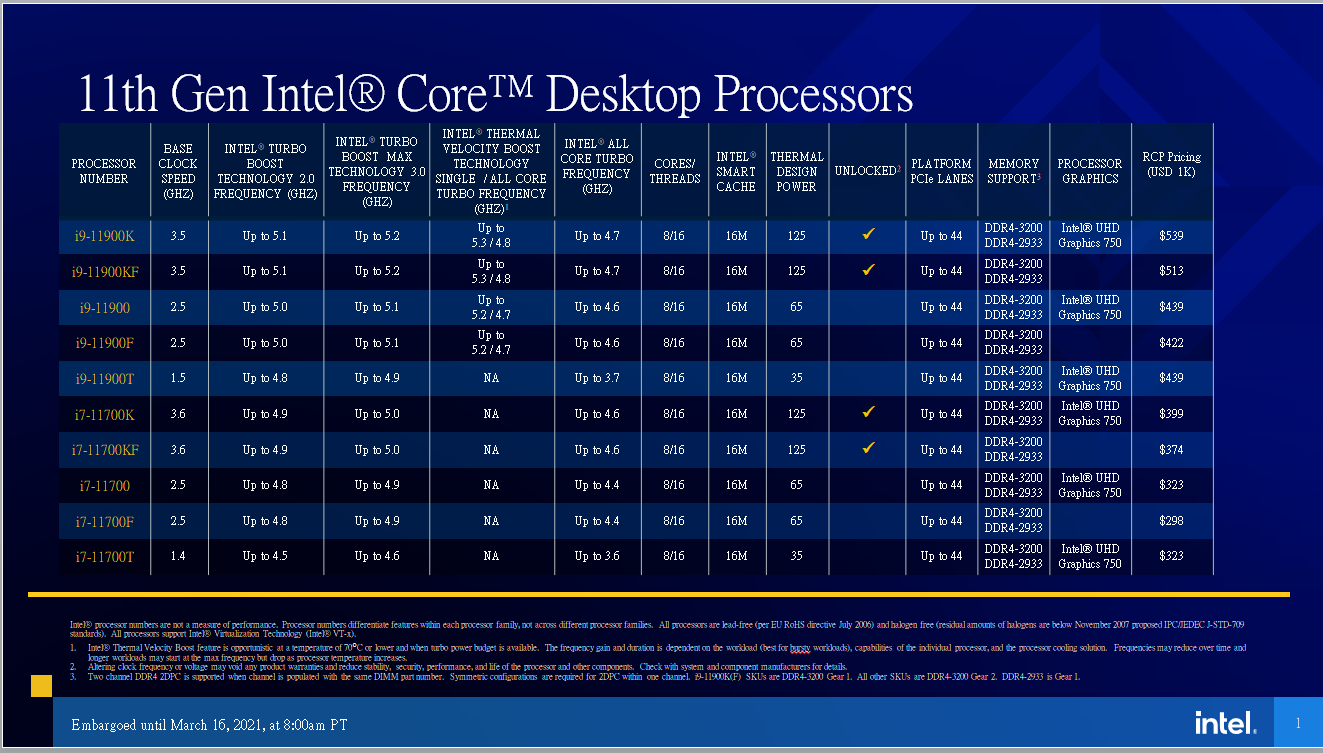
Core i9-11900K建議售價 $539美元
Core i7-11700K建議售價 $399美元
Core i9-11900K (KF)之核心數為 8C/16T,基礎頻率 3.9GHz,Turbo Boost (TB3) 5.3GHz,開啟「Intel Adaptive Boost Technology」在符合散熱需求時可 All Core 5.1GHz ,「Intel Adaptive Boost Technology」目前僅支援 Core i9-11900K (KF)處理器,Core i9-11900K (KF)之 L2 Cache 4MB,L3 Cache 16MB
Intel Core i9-11900K (KF) 與上一代 Intel Core i9-10900K (KF)相同的是兩者之 Boost (TB3)頻率均為 5.3GHz,不同的是 Intel在 Core i9-11900K (KF) 身上新增了 「Intel Adaptive Boost Technology」 (ABT),以及核心數量則較 Core i9-10900K (KF) 之 10C/20T少了 2顆
Core i7-11700K之核心數為 8C/16T,基礎頻率 3.8GHz,Turbo Boost (TB3) 5.0GHz L2 Cache 4MB,L3 Cache 16MB
Core i7-11700K之核心數則與上一代 Intel Core i7-10700K相同均為 8C/16T,但 11700K 之 Boost (TB3) 頻率為 5.0GHz
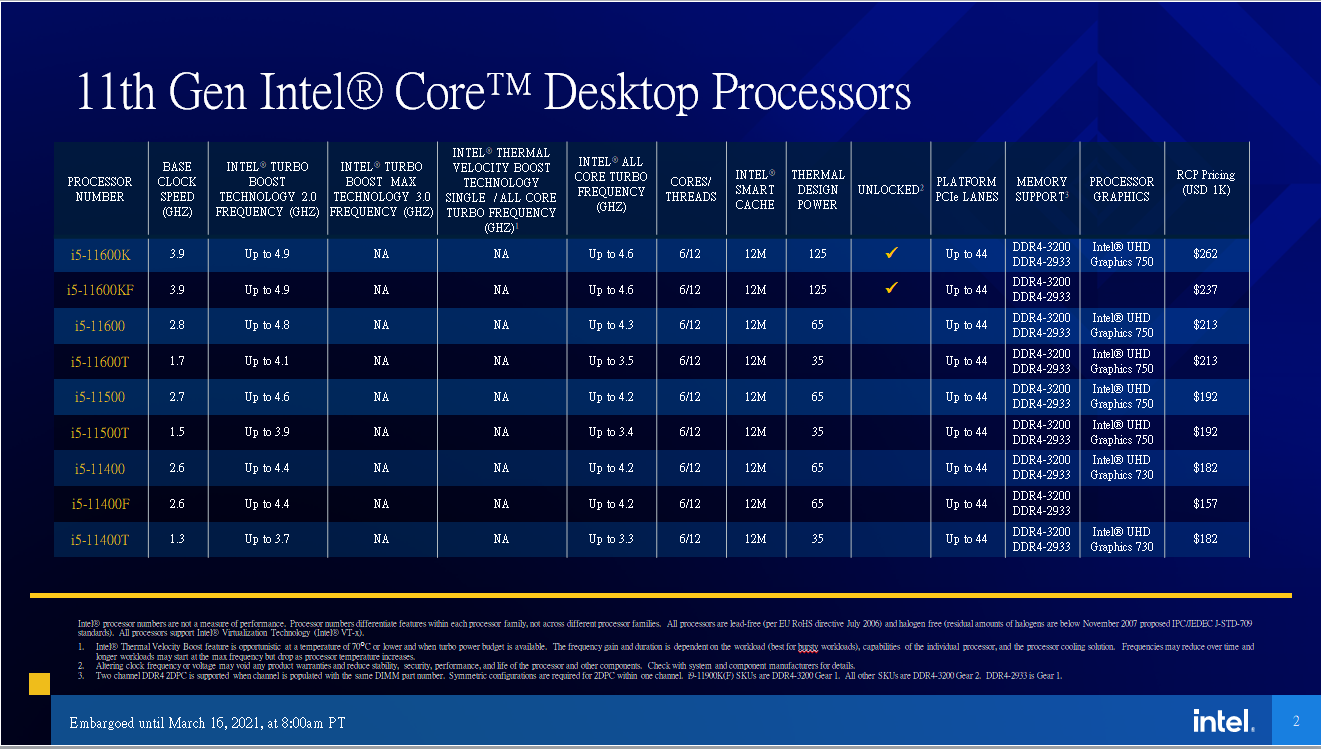
Core i5-11600K建議售價 $262美元
Core i5-11600K建議售價 $262美元
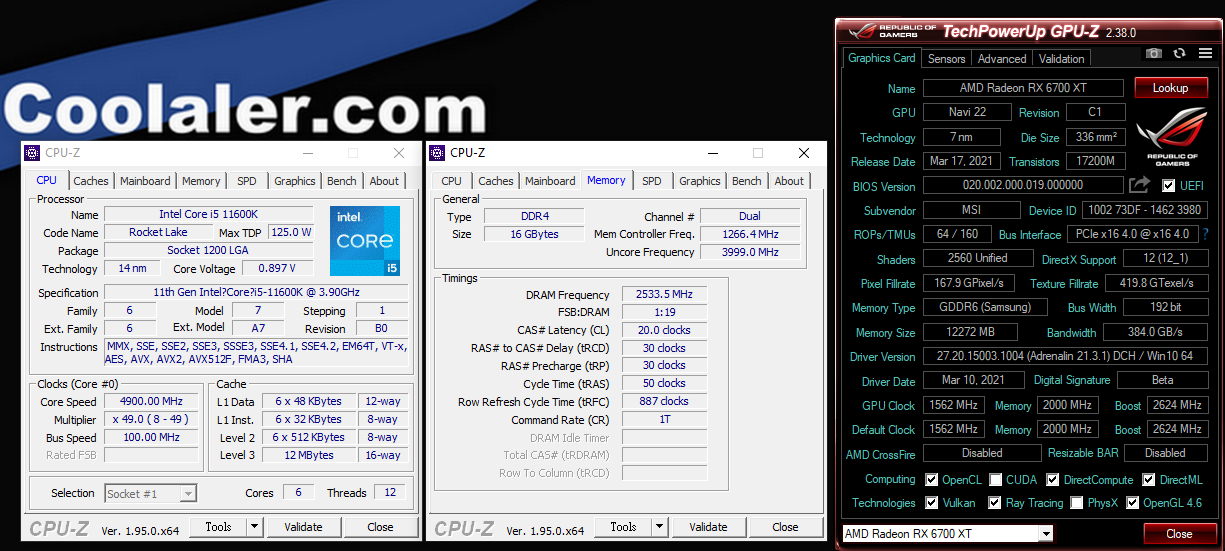
Core i5-11600K之核心數為 6C/12T,基礎頻率 4.1GHz,Turbo Boost (TB3) 4.9GHz L2 Cache 3MB,L3 Cache 12MB
Intel Core i5-11600K與 Intel Core i5-11600K相比,Intel Core i5-11600K Boost頻率為 4.9GHz (Intel Thermal Velocity) ,而Intel Core i5-110600K Boost頻率為 4.8GHz,兩者均是專為遊戲打造的桌上型處理器
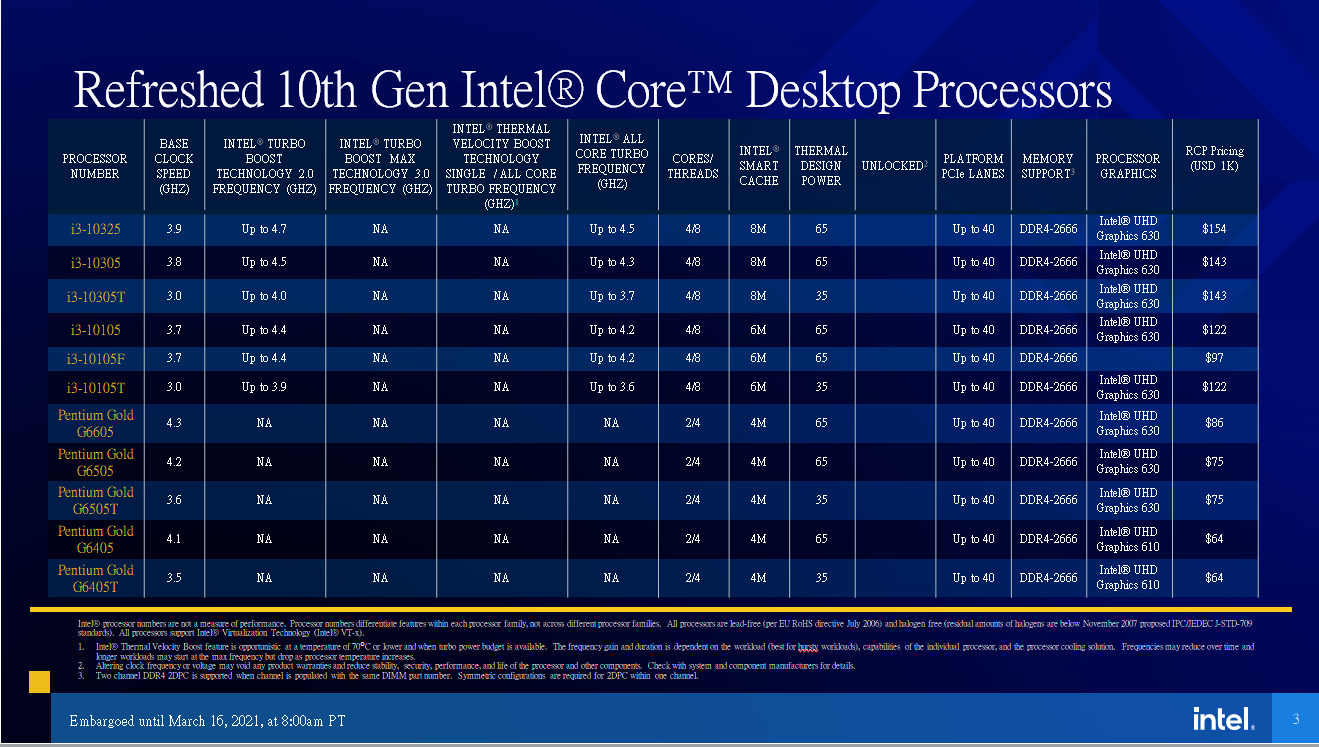
i3 & Pentium Gold $64~$154美元
Core i9-11900K與 Core i5-11600K SPEC比較表

Intel「Rocket Lake-S」處理器預設頻率模式介紹
「Rocket Lake-S」在預設時有以下幾種預設頻率,尤其是新增的「Intel Adaptive Boost Technology (ABT)值得關注
1.「基礎頻率」
處理器在在預設下運行的最低頻率即為基礎頻率,其功耗將不高於處理器的 TDP額定值
2 .「Turbo Boost 2.0」(TB2)
Turbo Boost 2.0會讓處理器運行在比基礎頻率更高的頻率上運作,頻率增加之幅度將視使用的核心數目而異
3.「Turbo Boost 3.0」(TB3)
Turbo Boost 3.0 (TB3)會讓最佳核心能提供比其他核心更高的 Turbo boost能力,對於核心數量較多的處理器而言,各個核心之間會存在些許體質差異,以 Core i9-11900K (KF)為例,在 Turbo Boost 3.0模式下,Turbo Boost 3.0會讓處理器中的 1~2個核心運行在 5.3GHz以獲得最佳效能
4.「Thermally Velocity Boost」(TVB)
「Intel Thermal Velocity Boost」會根據處理器在極限溫度以下運行時間的長短,以及 Turbo Boost加速功耗限制是否還有剩餘,在單核心、多核心 Turbo Boost的基礎之上,適時、自動地繼續提升單個核心的頻率,具體提頻幅度、時間取決於工作負載、處理器規格、散熱條件,當「Thermal Velocity Boost」 (TVB) 運作時,如果處理器上檢測到的峰值熱溫度低於設定值 (桌機為 70ºC)則處理器將會在比基礎頻率高 100MHz的頻率上運作
5.「Intel Adaptive Boost Technology」(ABT)
「Intel Adaptive Boost Technology」為第 11代 Core i9-11900K (KF)處理器之獨有新功能,當在 BIOS中開啟「Intel Adaptive Boost Technology」(ABT) 時,如果 Core i9-11900K (KF)之散熱符合需求,則 Core i9-11900K (KF)處理器將能運行在 All Core 5.1GHz (但能需視程式之 Workload多寡而定)
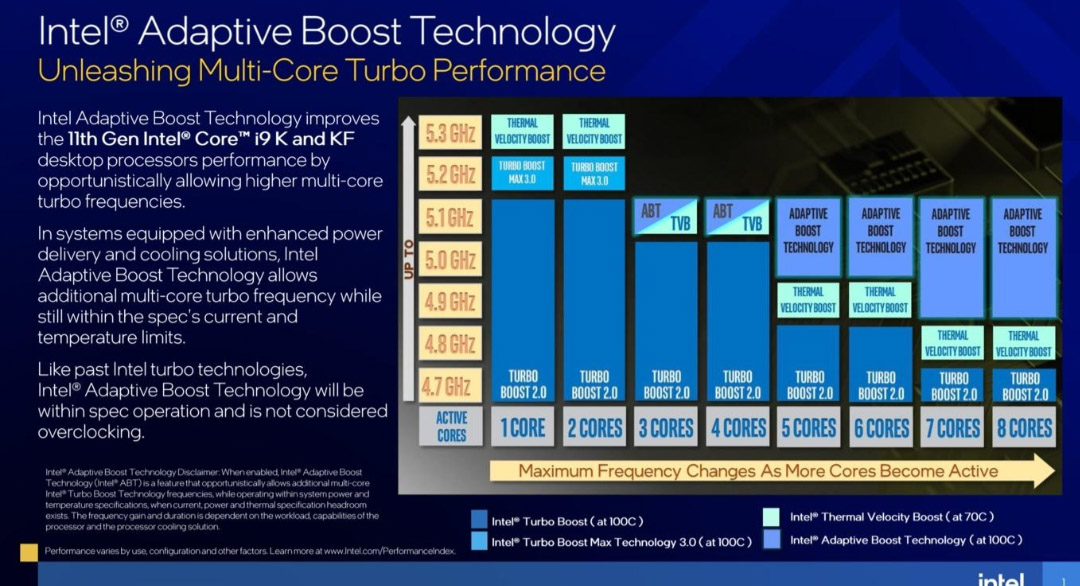
如果散熱符合需求,憑著「Intel Adaptive Boost Technology」將可使 Core i9-11900K (KF) 兩款 K級處理器除了在預設時有 2個核心達到 5.3GHz之外,而其餘的 6個核心則會在 5.1GHz運作,這意味著 Core i9-11900K (KF) 在預設時即可在 All Core 5.1GHz下運作,但是否能通過所有的負載測試則有待測試驗證
BIOS開啟 Intel ABT方式

Intel Core i9-11900K與上一代 Intel Core i9-10900K相同的是其 Boost頻率均為 5.3GHz (Intel Thermal Velocity) ,同時也是專為遊戲打造的桌上型處理器,不同的是 Core i9- 11900K之核心數為 8C/16T,較 Core i9-10900K之 10C/20T少了 2顆
Core i7-11700K與上一代 Intel Core i9-10700K的核心數均為 8C/16T,11700K Boost頻率為 5.0GHz (Intel Thermal Velocity) ,均是專為遊戲打造的桌上型處理器
身為「Rocket Lake-S」旗艦型處理器 Core i9-11900K同樣因為增加了 IHS厚度並降低 CPU die的關係,使其在超頻及散熱的表現仍不遜於 Intel Core i9-10900K
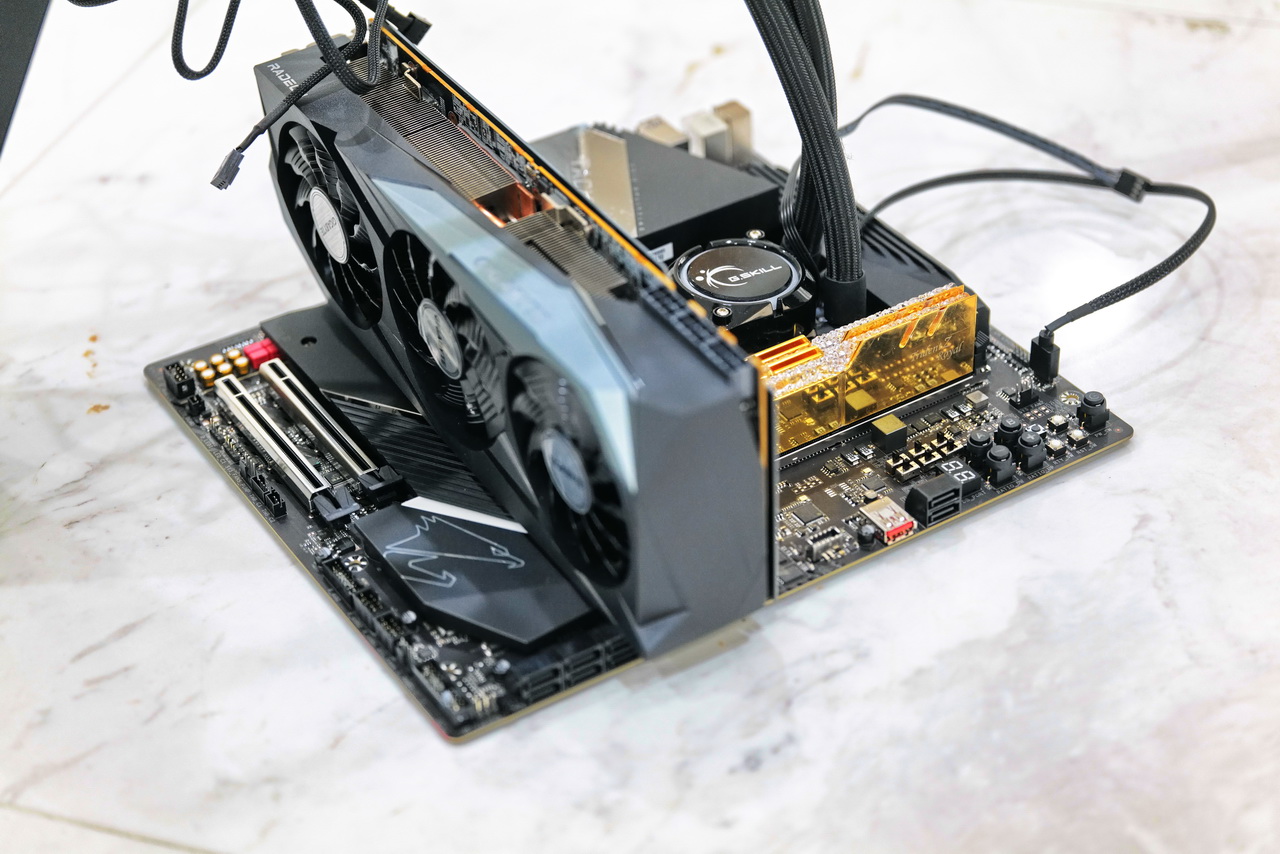
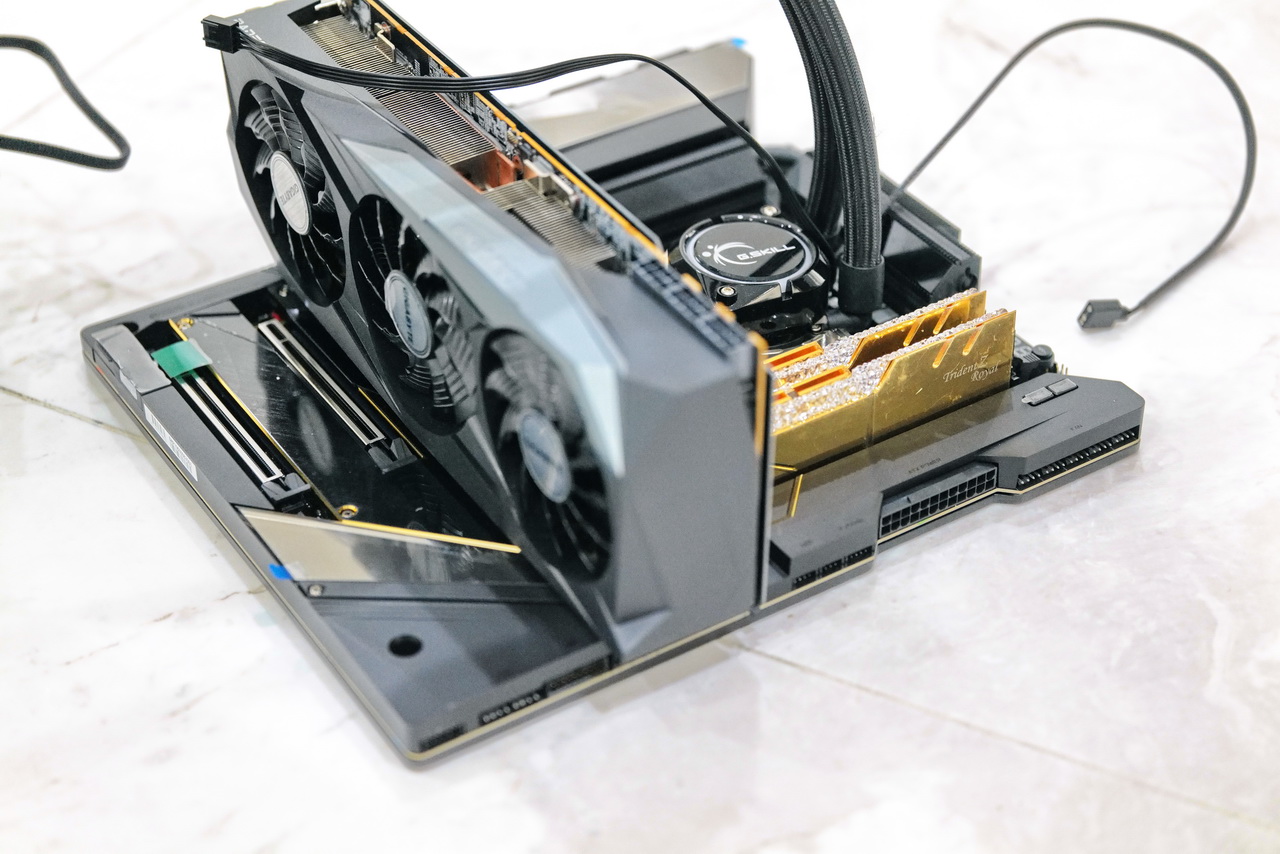
本次測試的主機板與處理器寫真


Intel Core i9-11900K

Intel Core i5-11600K

Intel Core i9-11900K開箱照
正式版 Intel Core i9-11900K

正式版 Intel Core i9-10900K
測試項目
A.「Intel Adaptive Boost Technology」ABT測試
在預設下對 Core i9-11900K做 idle、Single core loading、Full loading等測試,以了解 Core i9-11900K在各項測試中的 ABT頻率、電壓、溫度、功耗、效能表現
1.AIDA64 Cache & Memory Benchmark
2.Superpi 32M
3.Cinebench R15 & R20 CPU Test
4.CPU-Z Bench
5.CPUMark99
6.GIGABYTE AORUS 電競 NVMe Gen4 M.2 SSD 1TB固態硬碟測試
7.Gaming Benchmark (GIGABYTE RX 6900XT GAMING OC 16G)
a.Far Cry 5 Benchmark
b.Rise of the Tomb Raider Benchmark
c.Assassin's Creed Origins Benchmark
d.UNIGINE Superposition Benchmark
e.3DMark Time Spy
f.3DMark Time Spy Extreme
g.Final Fantasy XV Benchmark
h.Middle-earth: Shadow of War Benchmark
B.Overclocking All Core 5.2GHz
在 All Core 5.2GHz下對 Core i9-11900K做超頻後的遊戲效能測試
1.Gaming Benchmark (ASUS ROG STRIX RTX 3090 O24G GAMING)
a.Far Cry 5 Benchmark《極地戰嚎5》
b.Rise of the Tomb Raider Benchmark《古墓奇兵:崛起》
c.Assassin's Creed Origins Benchmark《刺客教條:起源》
d.UNIGINE Superposition Benchmark
e.3DMark Time Spy
f.3DMark Time Spy Extreme
g.3DMark Port Royal
h.Final Fantasy XV Benchmark 《中土世界:戰爭之影》
i.Middle-earth: Shadow of War Benchmark
C.UHD 750內顯測試
a.Final Fantasy XV Lite mode 1080P
b.Final Fantasy XIV Lite mode 1080P
c.UNIGINE Superposition Benchmark 720P Low
d.FarCry5 Benchmark 720P
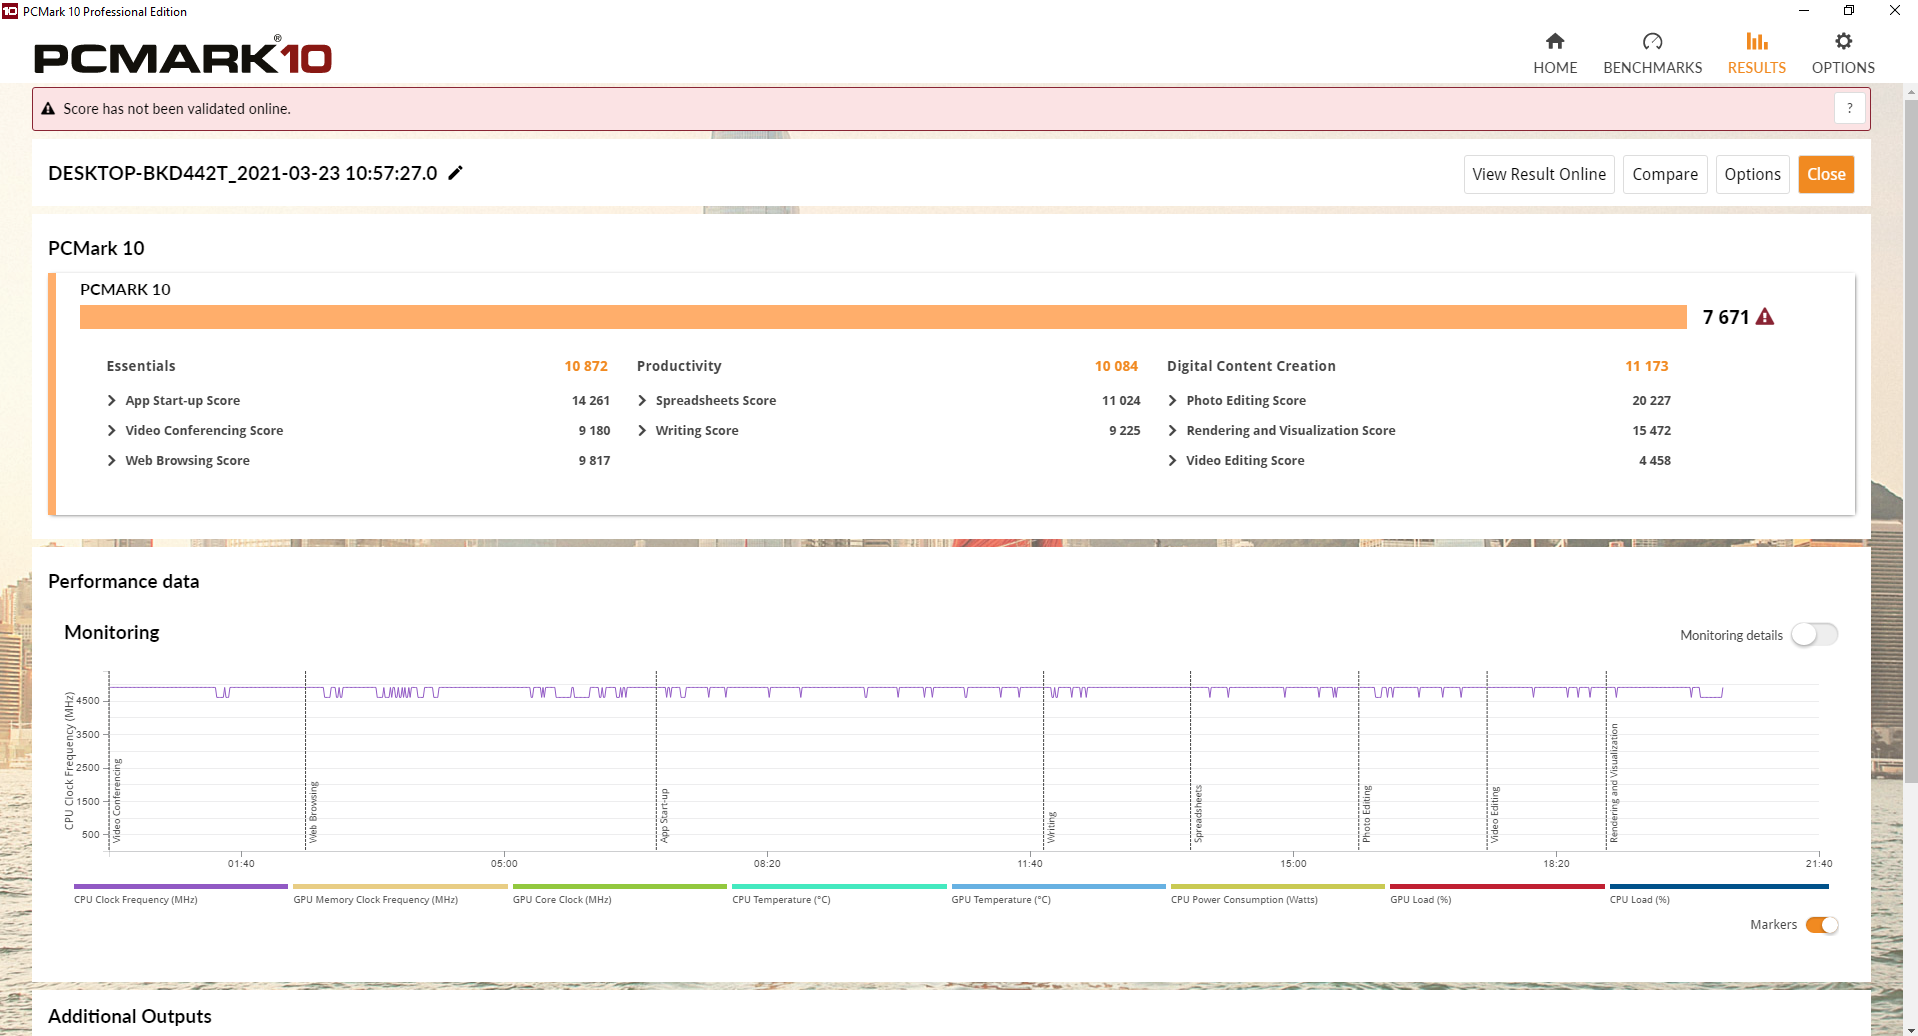
D.PCMARK10
Default測試平台
CPU:Intel Core i9-11900K
CPU:Intel Core i9-11900KF
CPU:Intel Core i7-11700K
CPU:Intel Core i5-11600K
CPU Cooler:GSKILL ENKI 360
10900K CPU Cooler:Thermalright Silver Arrow Extreme IB-E+Delta AFC1212DE X2 Fan
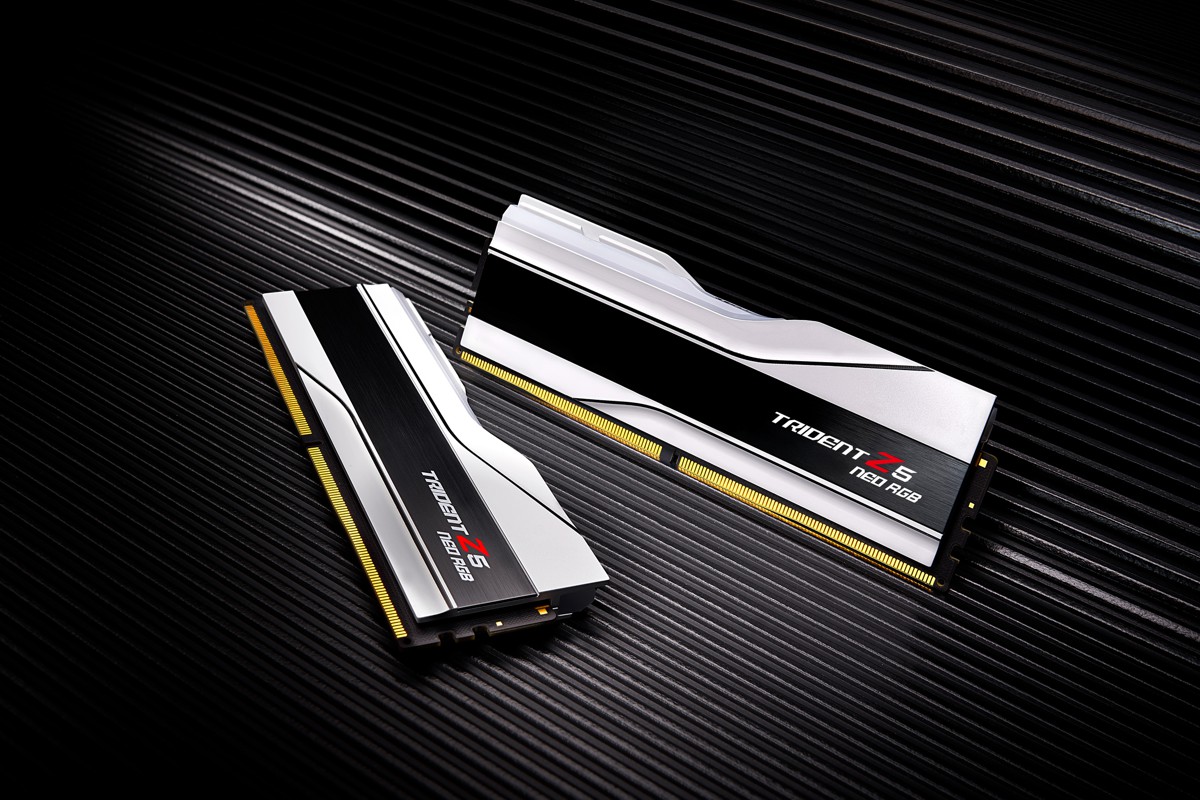
RAM:GSKILL Trident Z DDR4 4000 8GB X2 C18
MB:GIGABYTE Z590 AORUS TACHYON
MB:GIGABYTE Z590 AORUS XTREME
10900K MB:ASUS ROG MAXIMUS XII HERO WiFi
VGA:GIGABYTE RX 6900 XT GAMING OC 16G
SSD:GIGABYTE AORUS NVMe GEN4 SSD 1TB
PSU:ASUS ROG Thor 1200W
OS:Windows 10 64bit 20H2
GIGABYTE Z590 AORUS TACHYON上機照

Overclocking測試平台
CPU:Intel Core i9-11900K
11900K CPU Cooler:GSKILL ENKI 360
10900K CPU Cooler:Thermalright Silver Arrow Extreme IB-E+Delta AFC1212DE X2 Fan
RAM:GSKILL Trident Z DDR4 4000 8GB X2 C18
MB:GIGABYTE Z590 AORUS XTREME
10900K MB:ASUS ROG MAXIMUS XII HERO WiFi
VGA:GIGABYTE RX 6900 XT GAMING OC 16G
SSD:GIGABYTE AORUS NVMe GEN4 SSD 1TB
PSU:CORSAIR AX 1500i
OS:Windows 10 64bit 20H2
GIGABYTE Z590 AORUS XTREME上機照
A.「Intel Adaptive Boost Technology」ABT測試
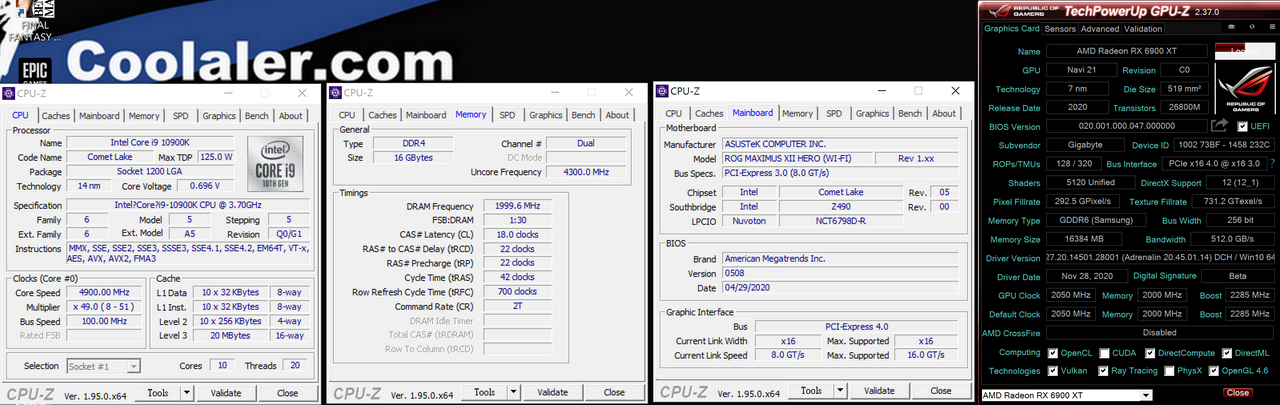
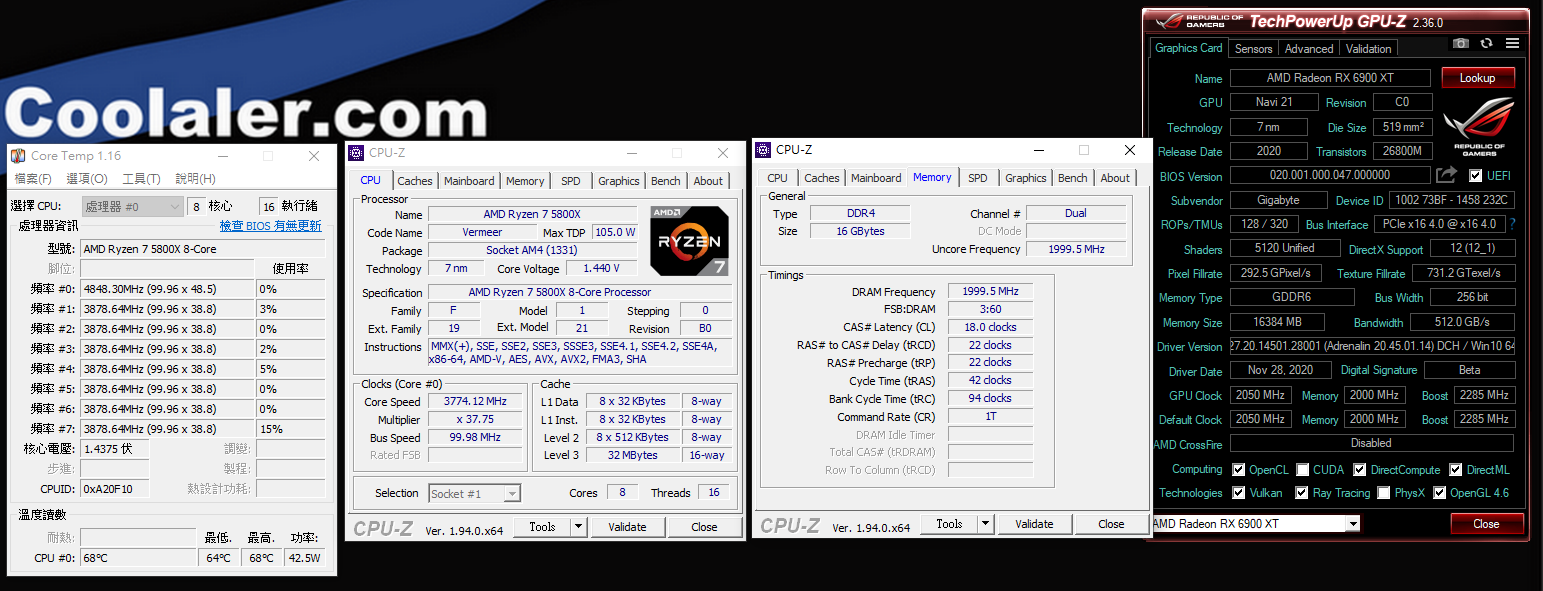
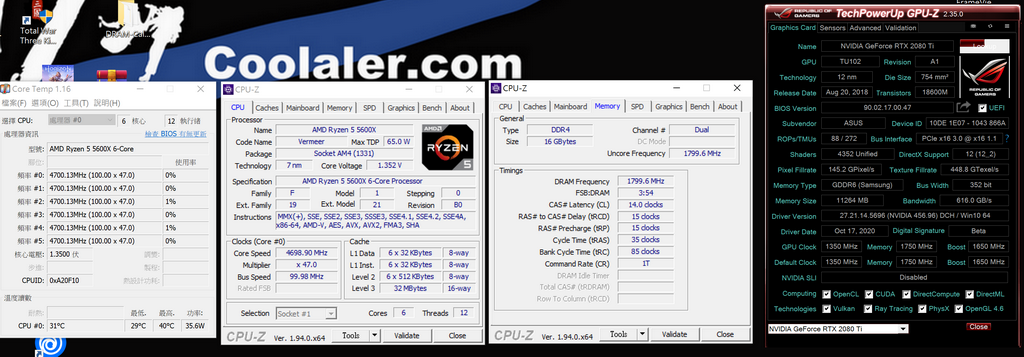
CPU-Z資訊
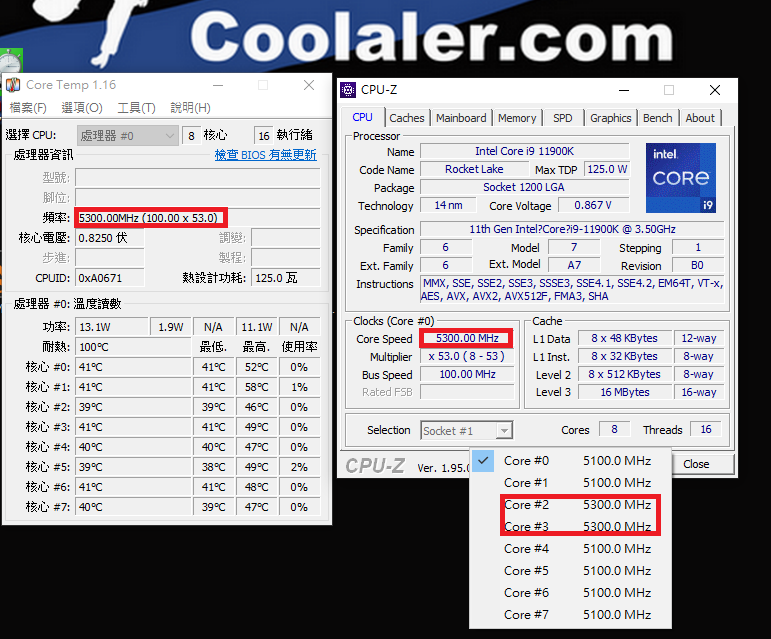
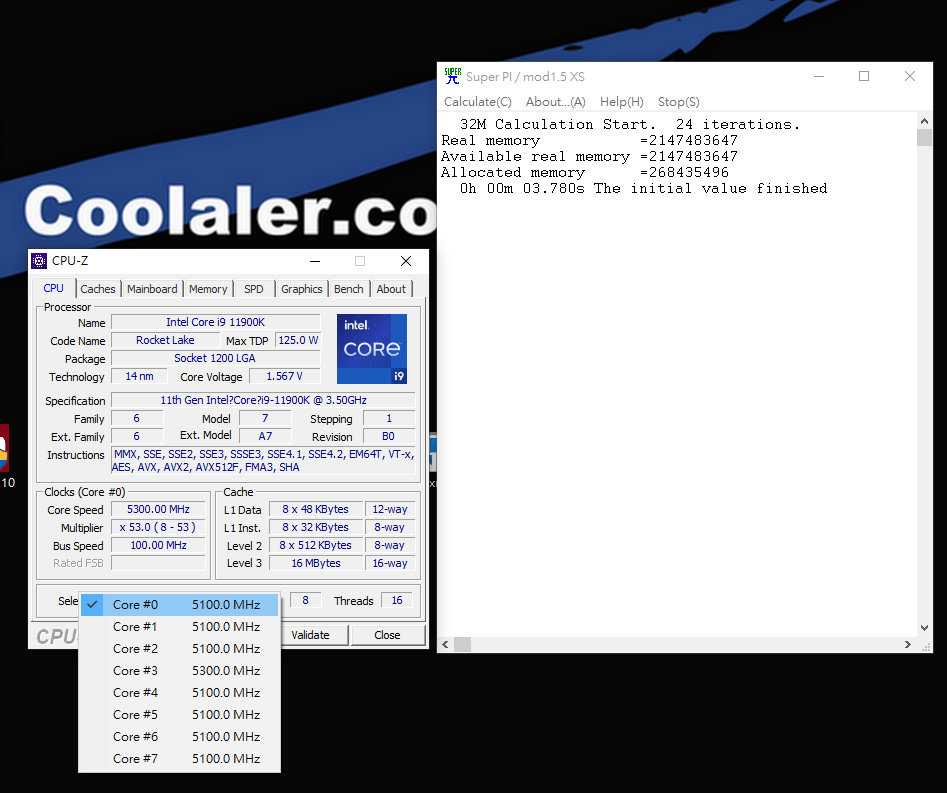
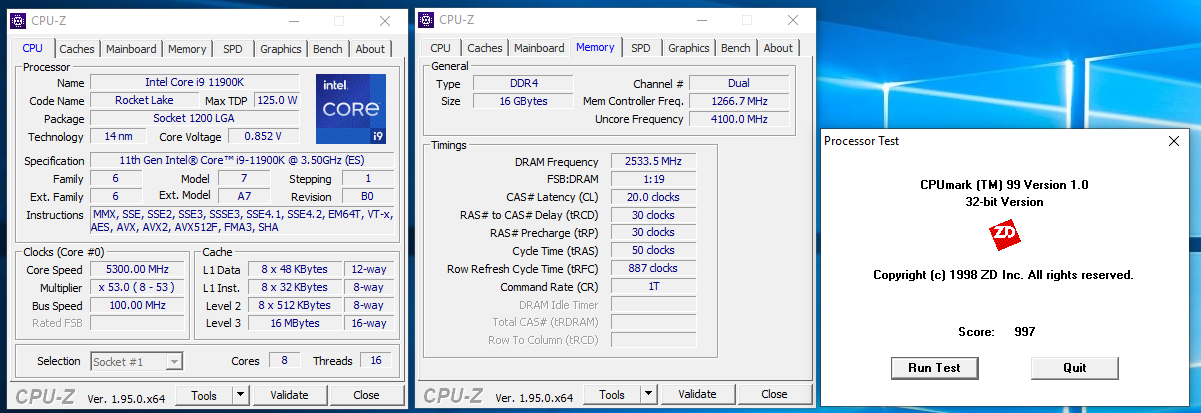
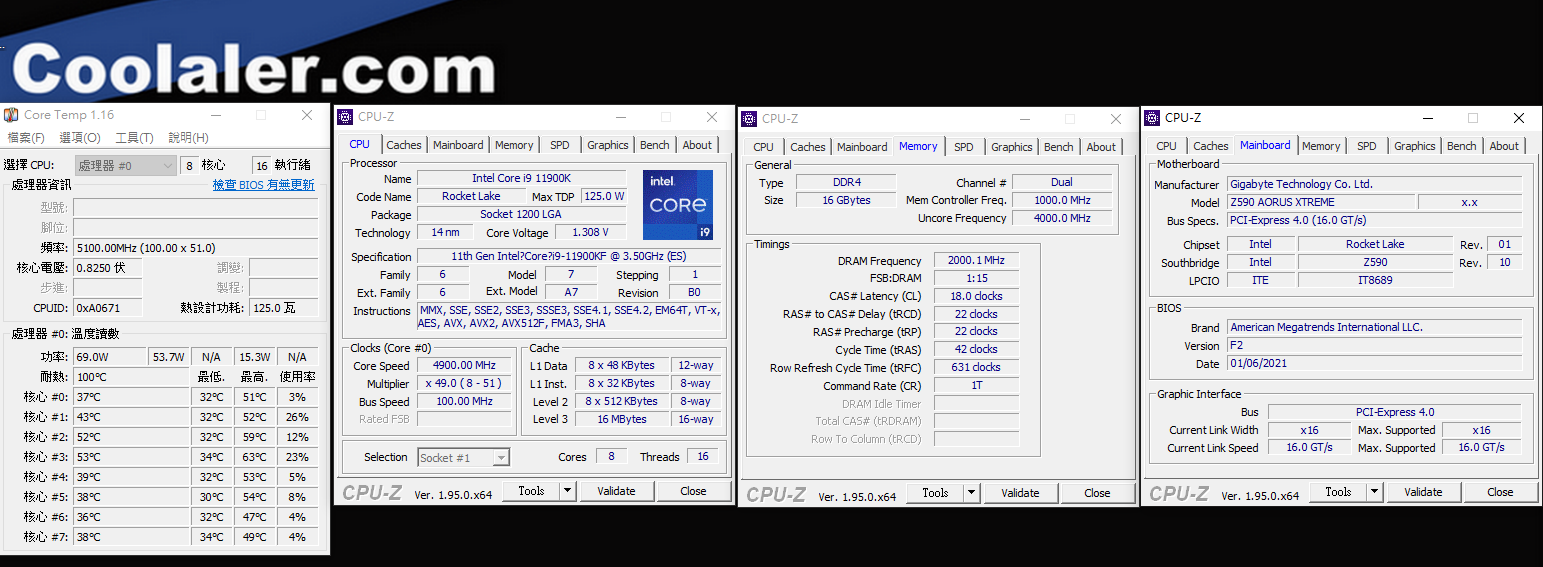
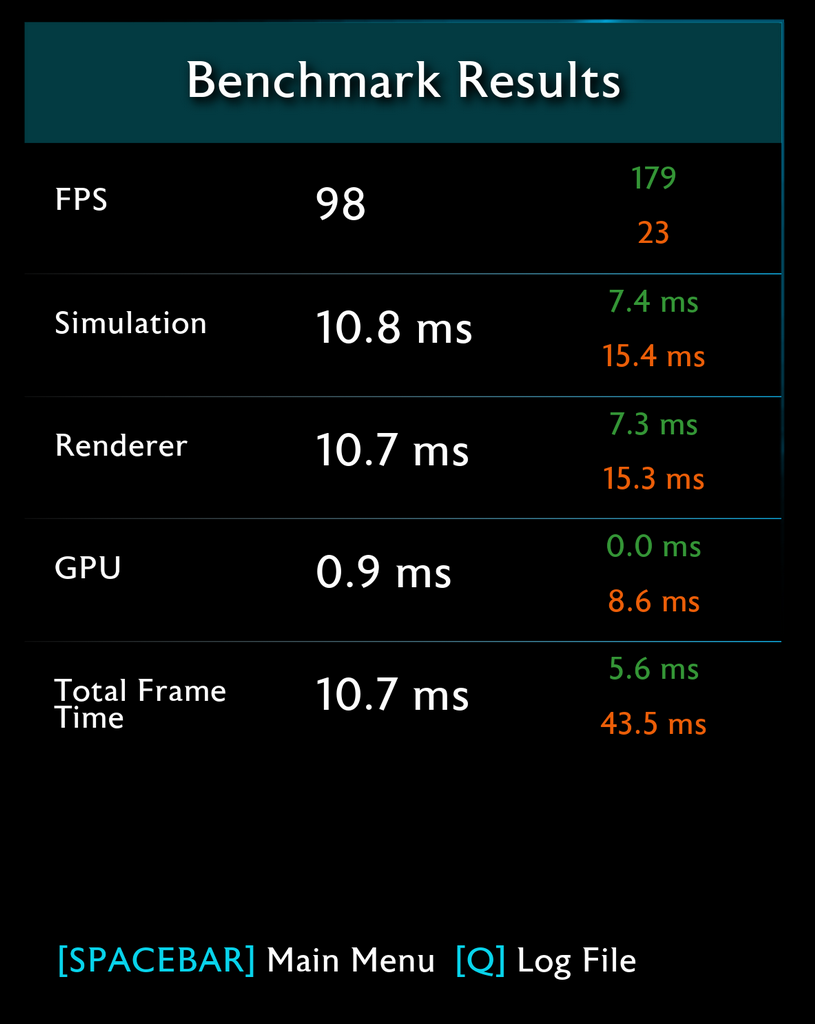
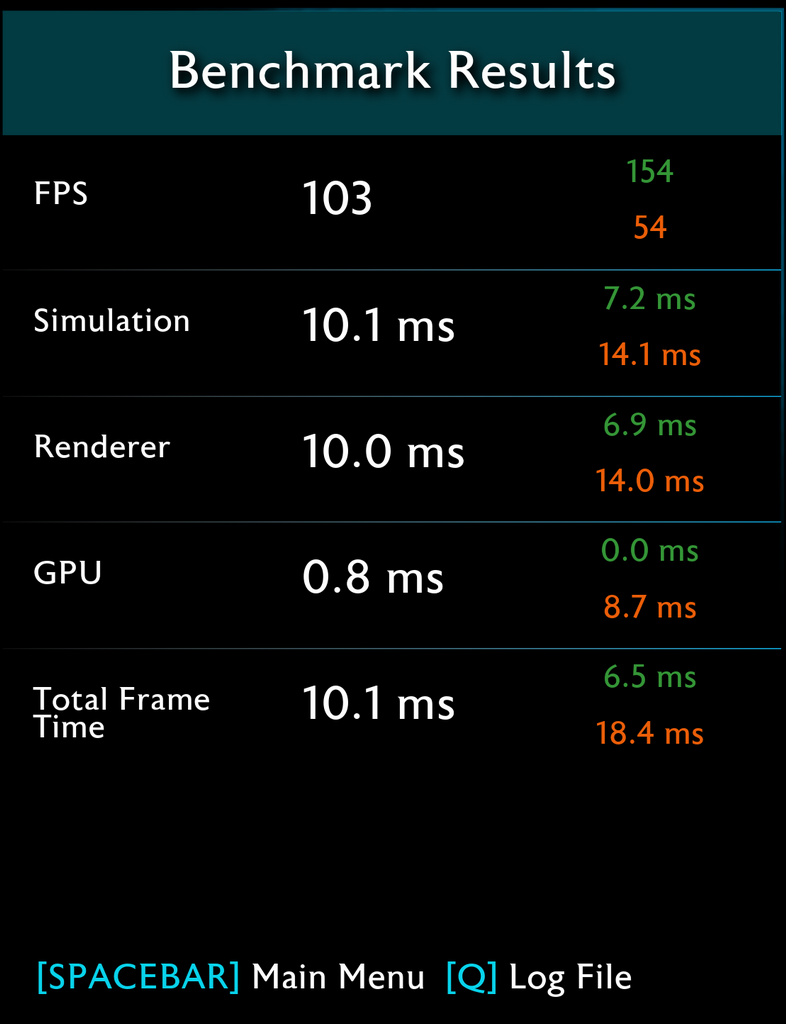
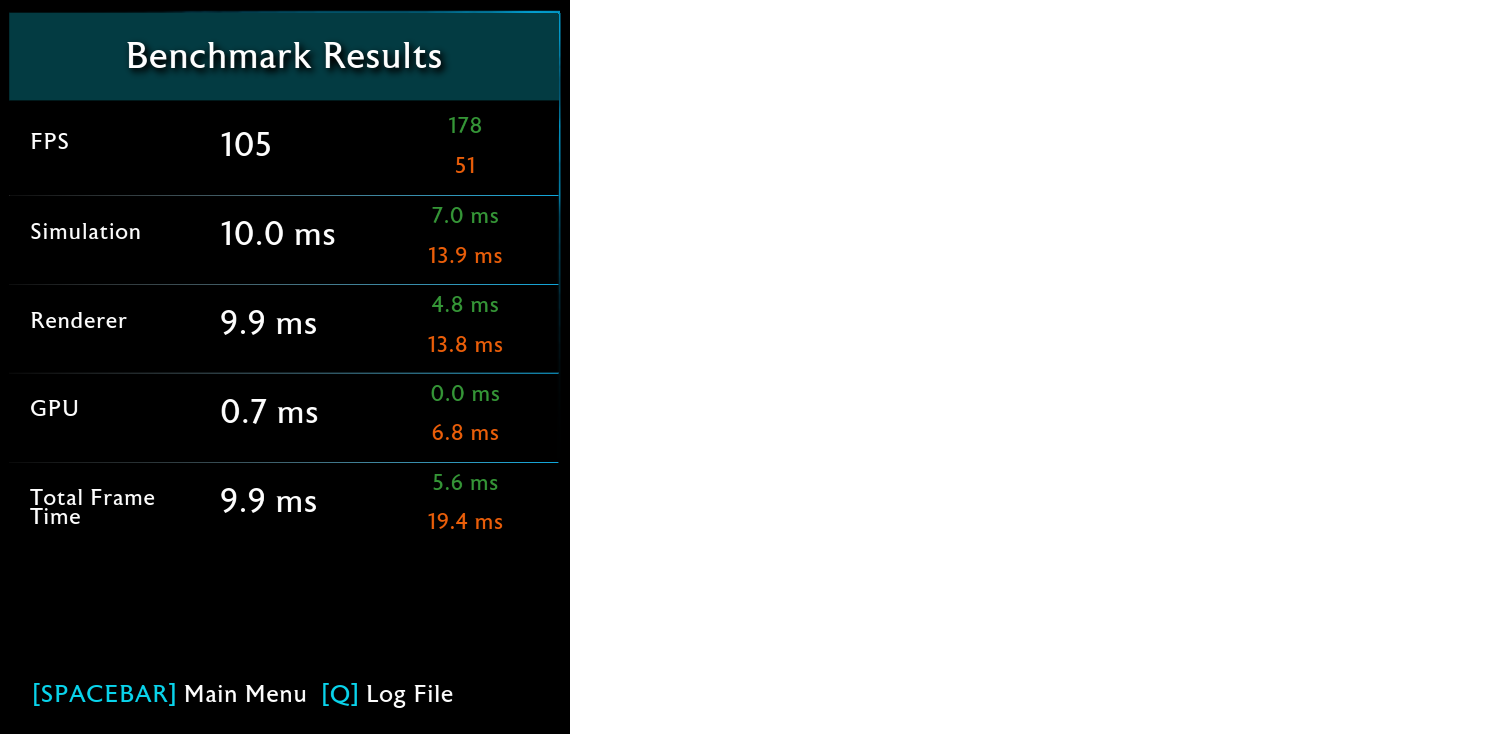
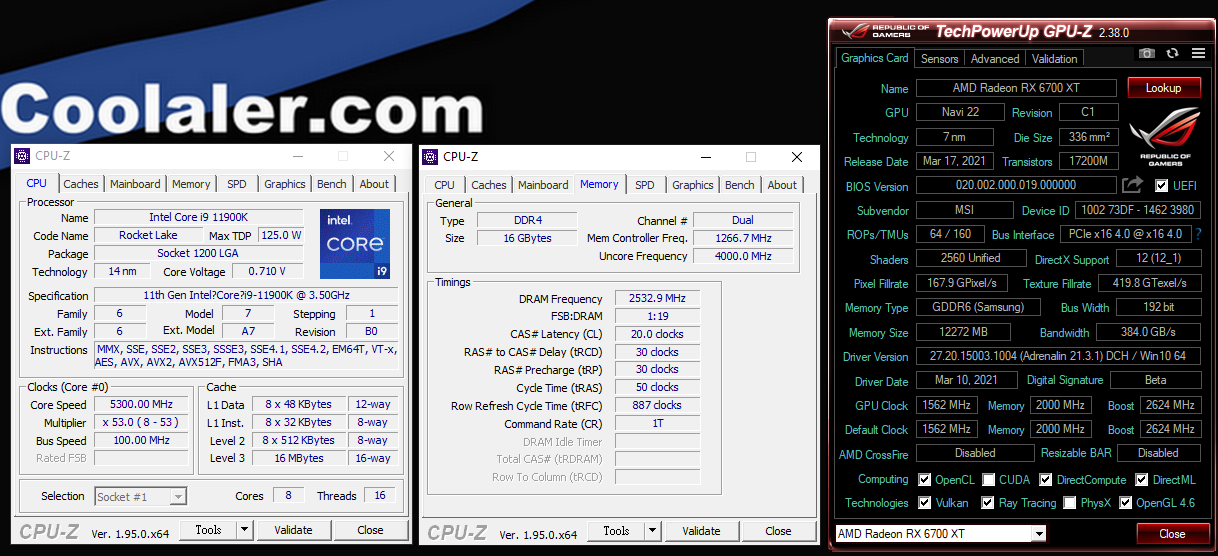
Core i9-11900K@Boost Idle時頻率為 5.3GHz而記憶體使用 DDR4 5333 C22 XMP

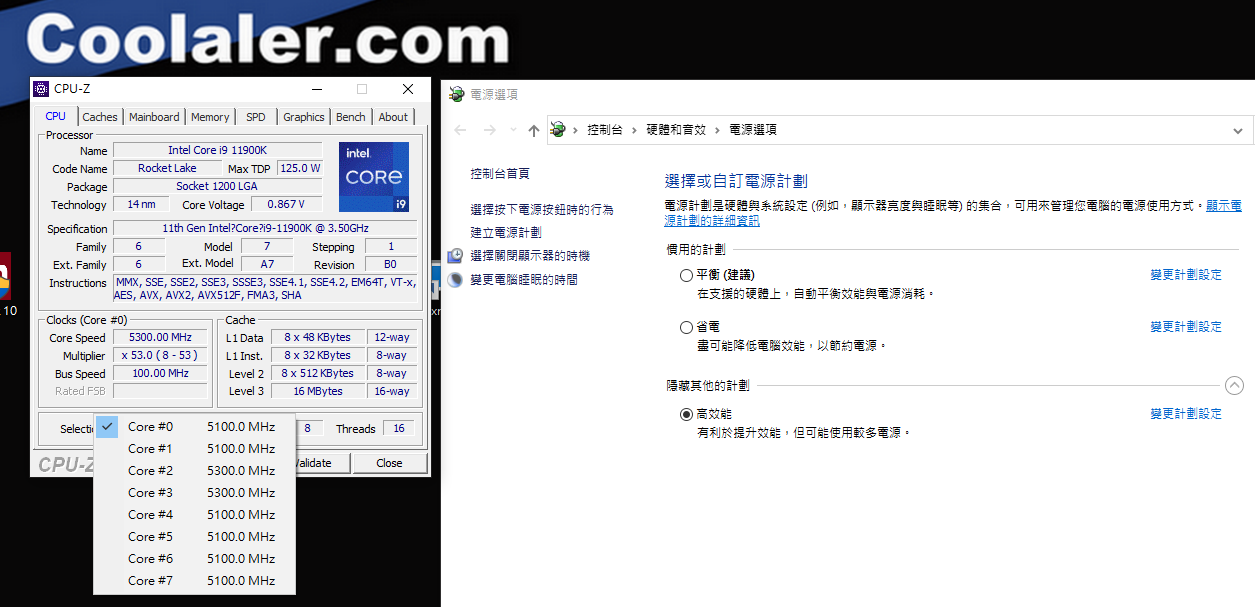
HWiNFO64 info
CPUMark99
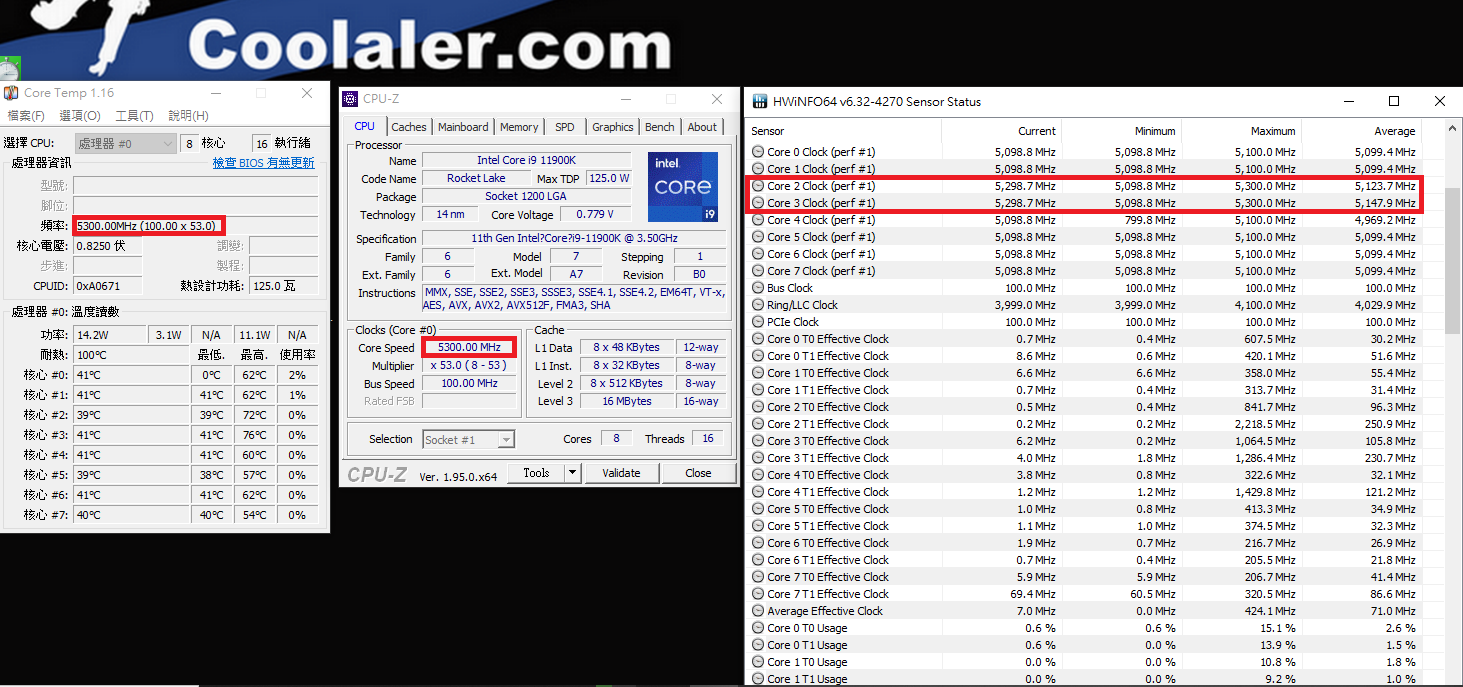
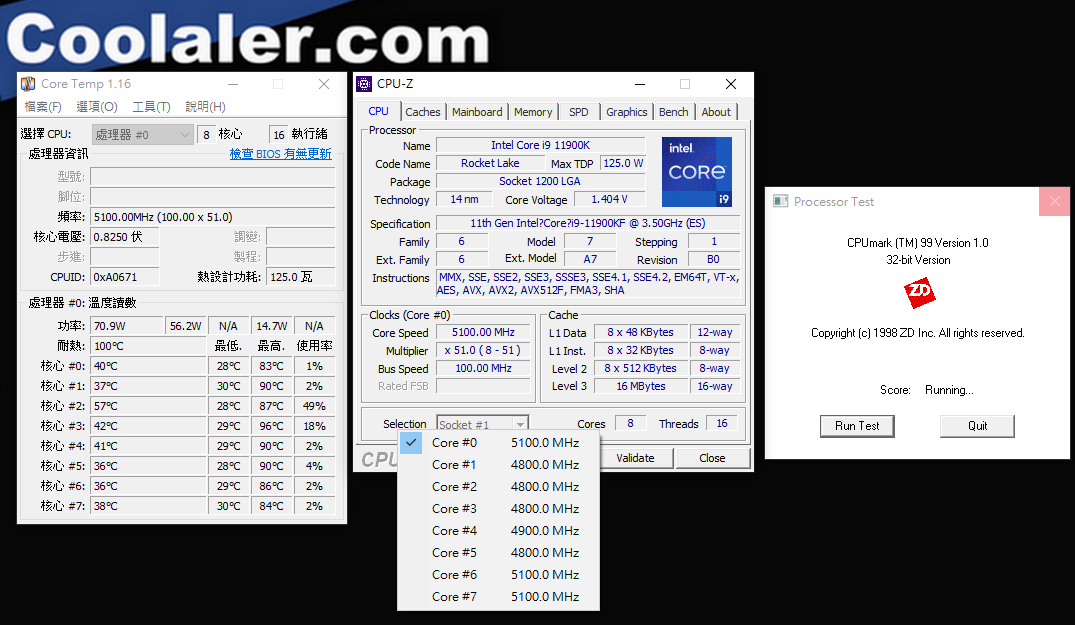
在執行 CPU-Z Bench測試時仍能見到 2個核心在 5.3GHz運作
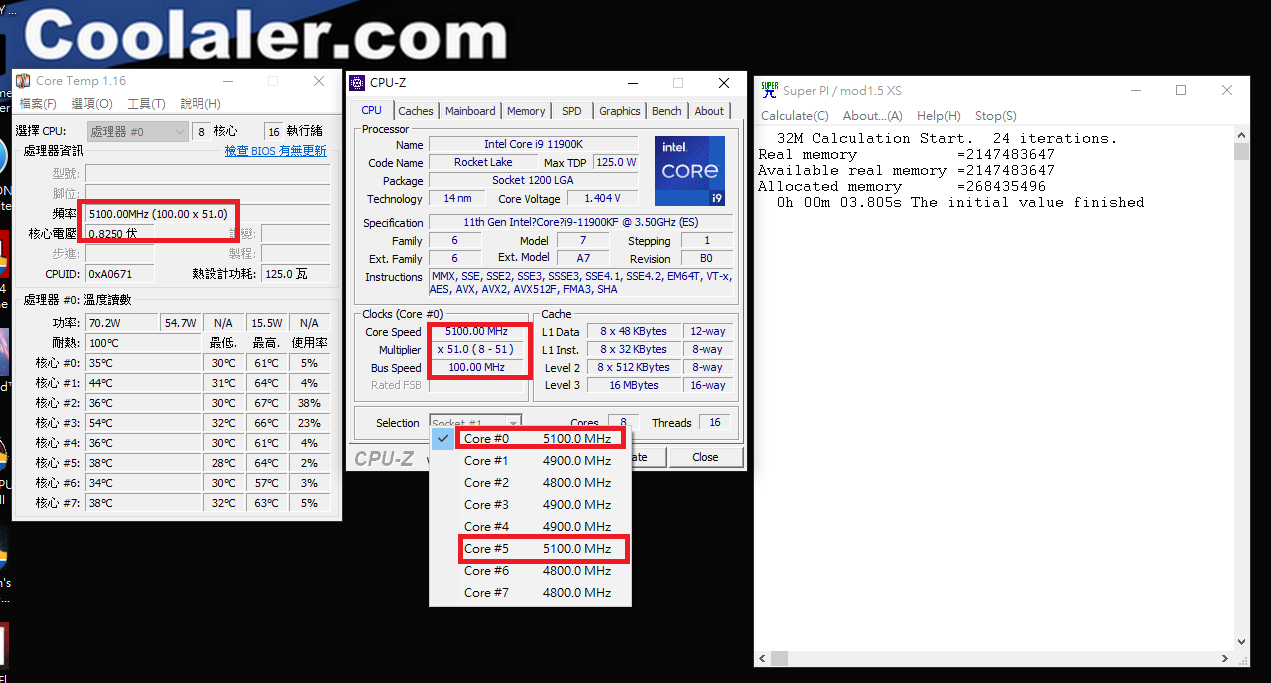
Core i9-11900K@Boost 執行單線程 Superpi32M時
「Intel Adaptive Boost Technology」ABT測試
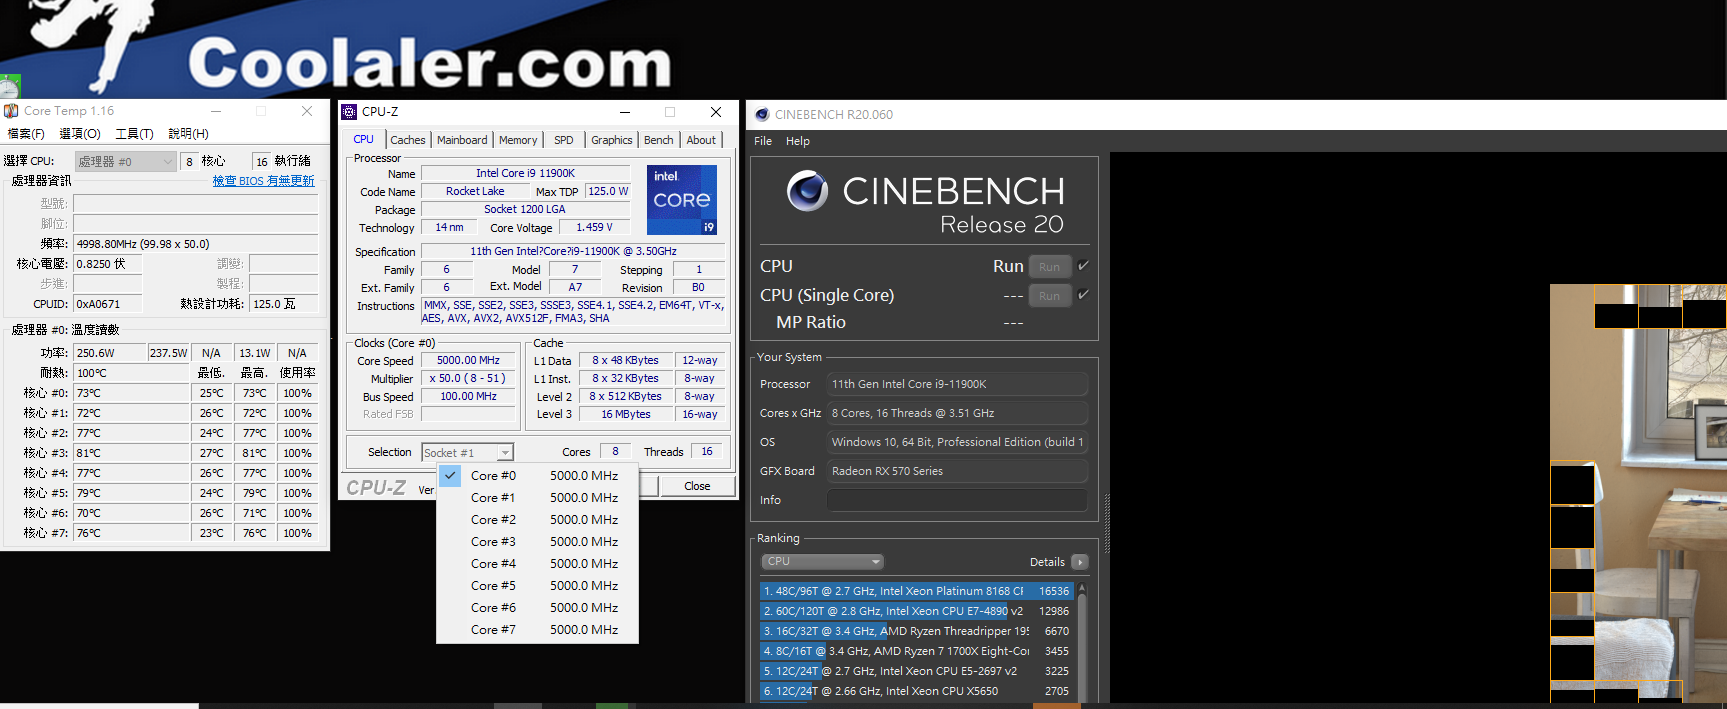
在 Cinebench R20測試剛開始時全核心頻率還在 5.1GHz
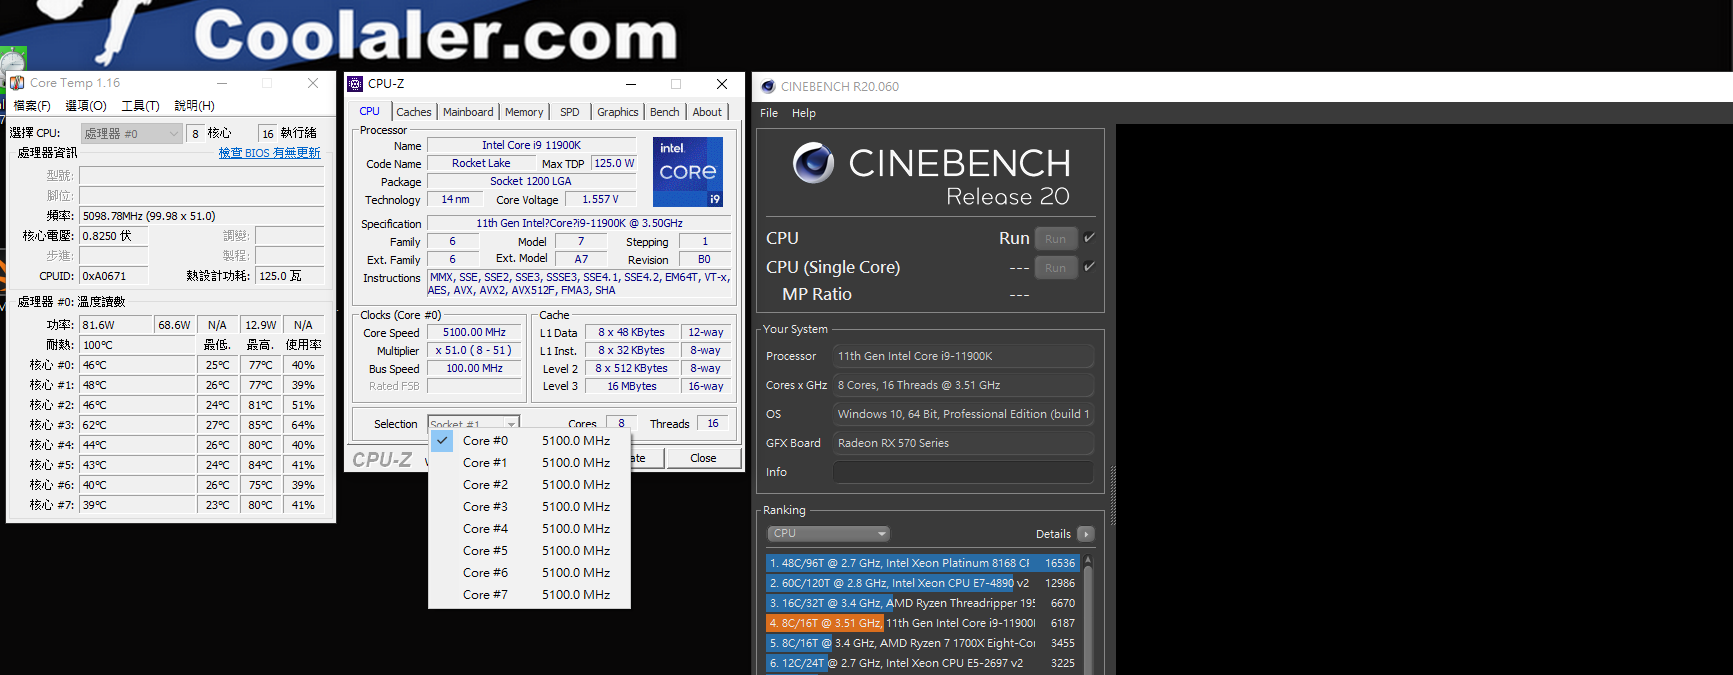
但在溫度迅速爆升之後全核心頻率落在 5.0GHz
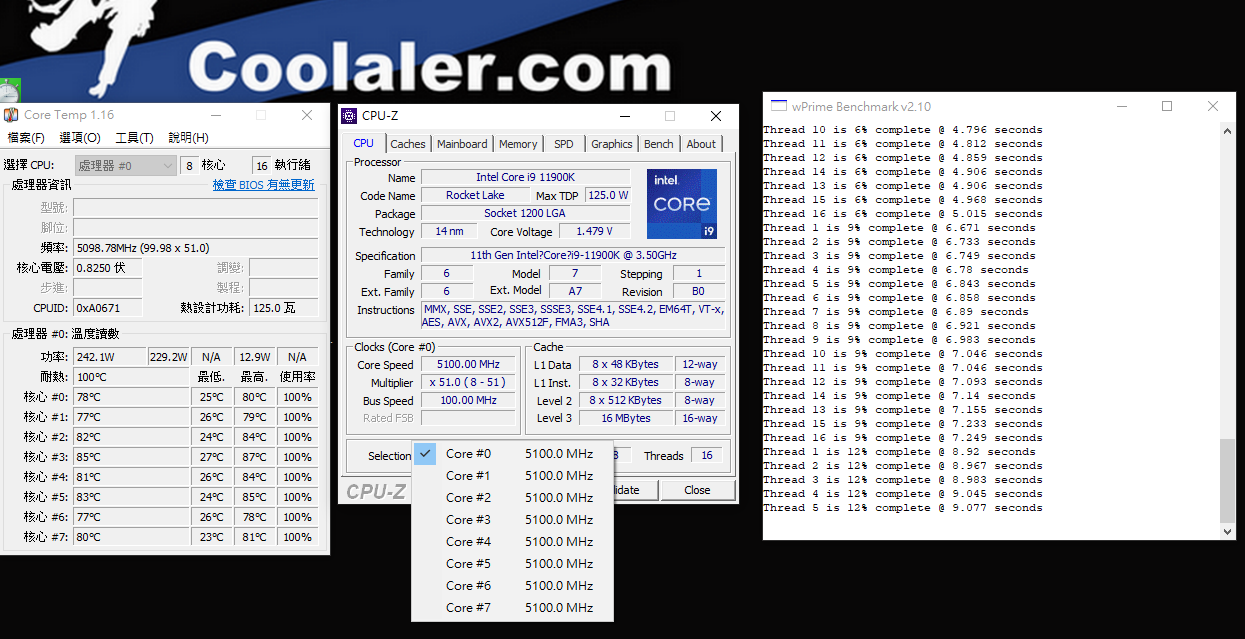
在 wPrime 2.10測試則可見到全核心頻率 5.1GHz,比在 R20的測試高了 100MHz All Core,這可視為因為兩者 Workload大小不同而有所差別
在 CPU FPU Stress TEST測試時則因為 Workoad之全速運作,而使 All core頻率大幅滑落到 4..5~ 4.8GHz之間,最大功耗 203W
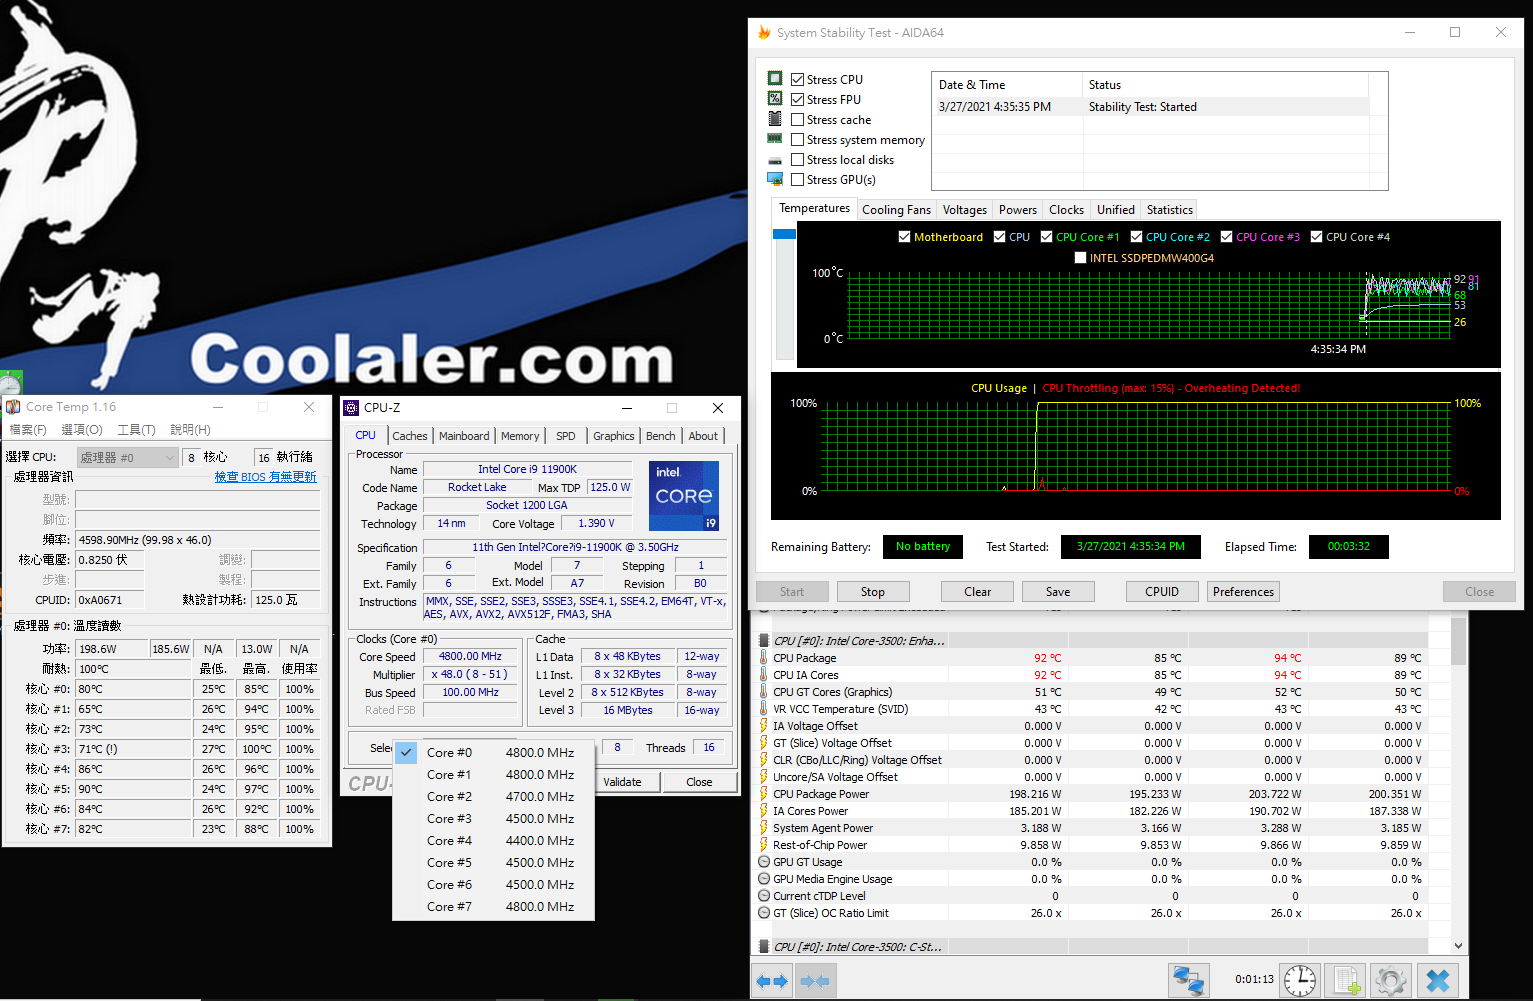
從以上「Intel Adaptive Boost Technology」ABT之測試比較中我們可以看到,處理器之 All Core頻率高低與否將視程式之 Workload程度,以及散熱環境是否符合需求而有所不同,在 Cinebench R20測試時,處理器之全核心頻率落在 5.0GHz (屬於中度 Workload),而在 wPrime 2.10測試時則可見到全核心頻率維持在 5.1GHz (屬於輕度 Workload),在 CPU FPU Stress TEST測試時則見到處理器頻率大幅滑落到 4.5~ 4.8GHz之間 (屬於極重度 Workload)
1.AIDA64 Cache & Memory Benchmark
AIDA64 Cache & Memory Benchmark可測量 CPU高速緩存和系統內存的帶寬和延遲。通過雙擊窗口中的任何矩形,列或行,我們可以單獨啟動基準測試或基準測試類型。例如,如果我們雙擊 “Memory”,則只會運行系統內存讀取,寫入,複製和延遲基準測試,即只執行給定行中的操作。同樣,如果我們雙擊 “Read”,則只會對所有內存類型運行讀取基準測試,即只執行給定列中的操作。如果我們雙擊任何矩形,則只會運行選定的單個基準
右鍵單擊 “Start Benchmark”按鈕將打開一個上下文菜單,我們可以在其中選擇運行所有基準測試或僅運行內存或緩存基準測試
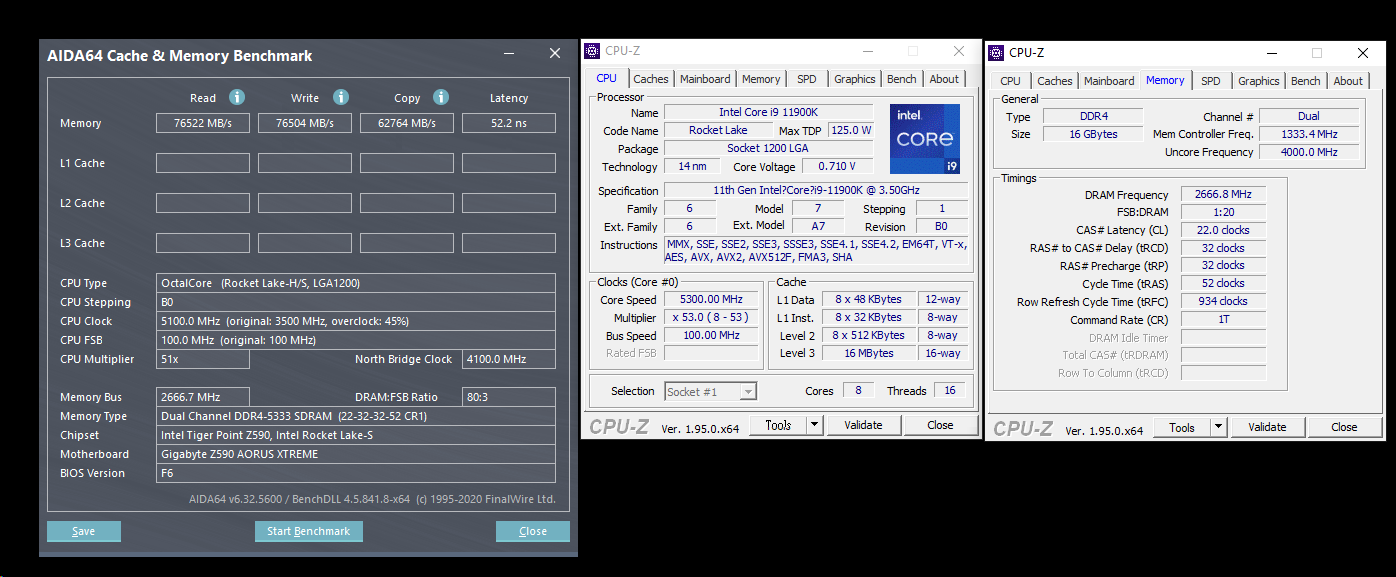
以 11900K為例 Core i9-11900K@Boost DDR4 5333 C22頻寬
Read.76,522MB/s
Write.76,504B/s
Copy.62,764MB/s
Latency. 52.2ns
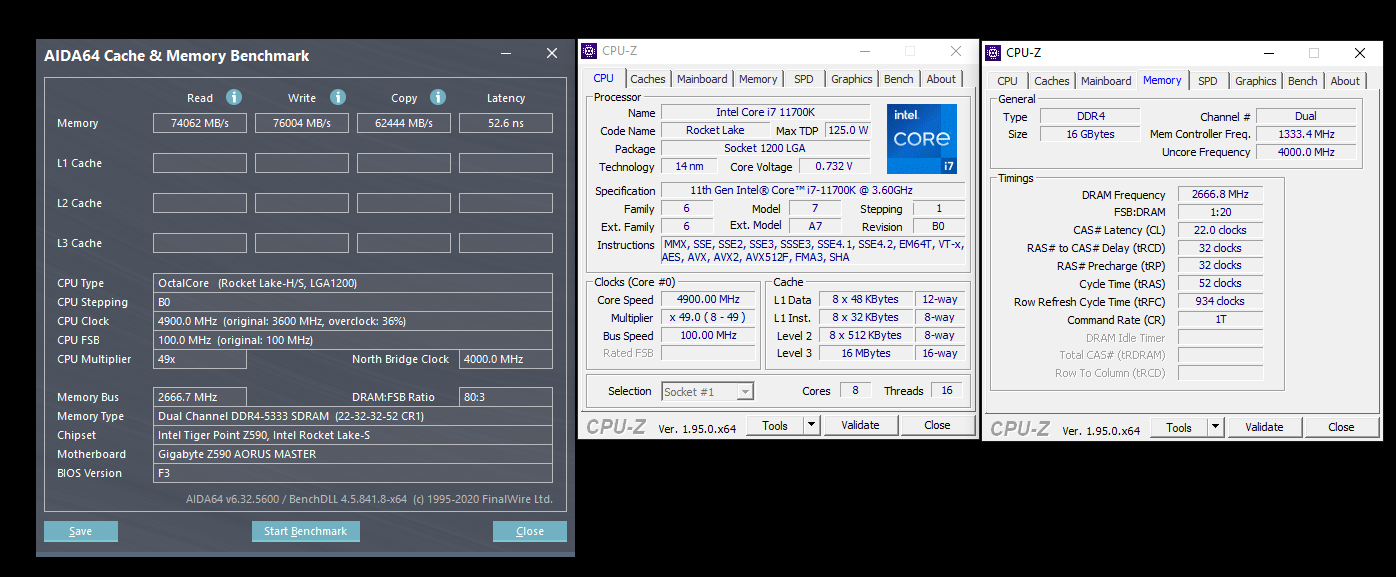
以 11700K為例 Core i7-11700K@Boost DDR4 5333 C22頻寬
Read.74,062MB/s
Write.76,004B/s
Copy.62,444MB/s
Latency. 52.6ns
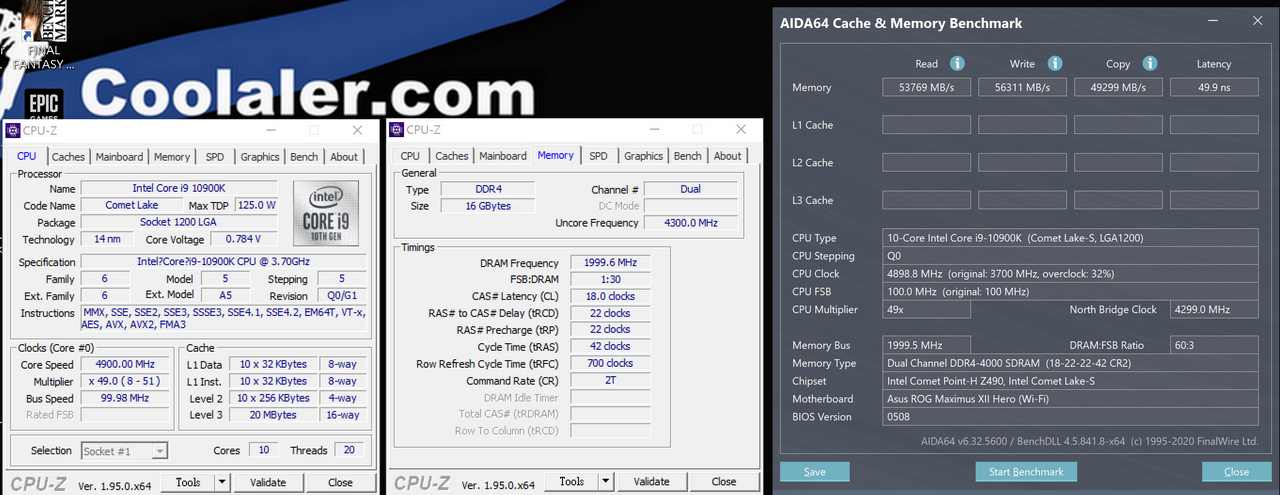
對照組 10900K@Boost & DDR4 4000C18 AIDA64 Cache & Memory Benchmark
Read.53,769MB/s
Write.56,311MB/s
Copy.49,299MB/s
Latency 49.9ns
Ryzen 7 5800X DDR4 3600C14 AIDA64 Cache & Memory Benchmark
Read. 62,422MB/s
Write. 28,799MB/s
Copy. 52,768MB/s
Latency. 58.9ns
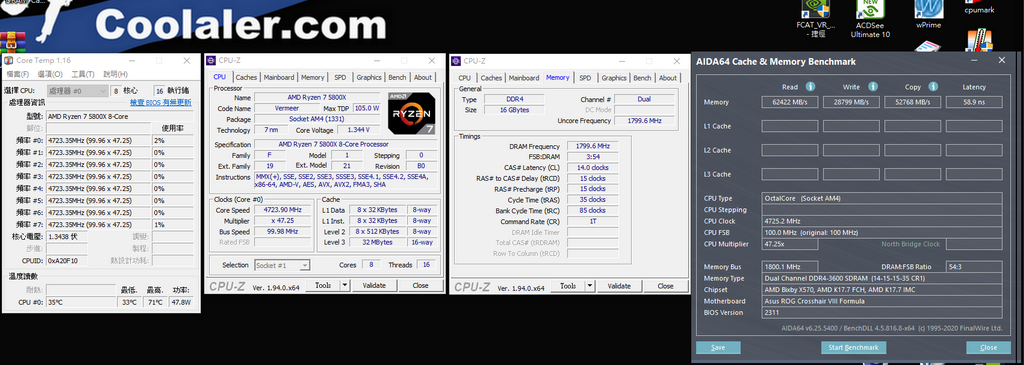
AIDA64 Cache & Memory Benchmark 比較表 單位:MB/S (數字愈大愈好)

Core i9-11900K@Boost 執行單線程 Superpi32M時亦見 5.1GHz
2.Superpi 32M
SuperPi 32m是一個計算圓周率的浮點運算程式,最大精確到小數點以後的 3200萬位數,該程式採用高斯-勒讓德演算法,並且於 1995年被日本電腦科學家金田康正使用 Windows環境下計算出精確到 232次方的圓周率,是一款在檢測單工效能時常用的程式,但在需要多工測試時亦可同時開啟多個程式同時運算
Core i9-11900K@Boost 單線程 Superpi32M成績 5m25.682s
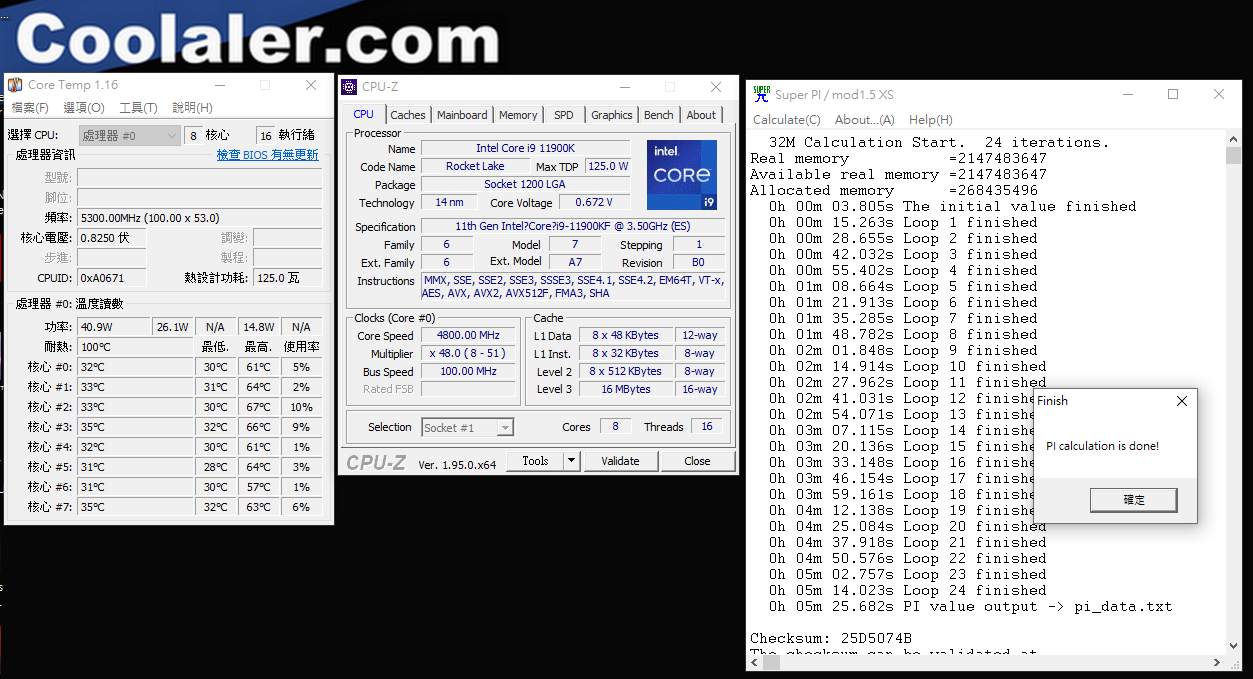
對照組
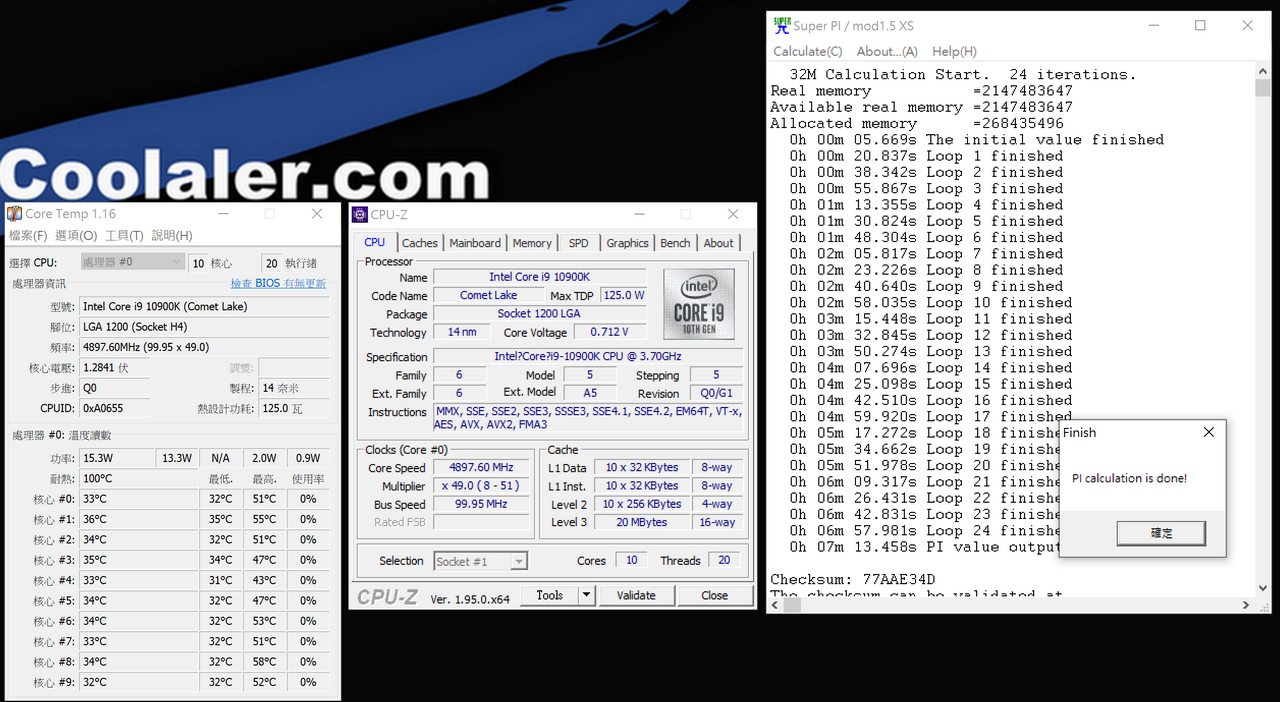
Core i9-10900K@Boost 單線程 Superpi32M成績 7m13.458s
Ryzen 7 5800X@Boost SuperPi 32m Results 為 6m05s.837
SuperPi 32m比較表 單位 :分秒 (數字愈小愈好)

3.Cinebench R15 & R20 CPU Test
Cinebench是一個真實的跨平台測試套件,用於評估計算機的硬件功能,現有最新版本已至 R20版本,由於它是 以 Cinema 4D動畫製作軟體為基礎進行測試,所以能夠反應出多線程處理器與顯示卡面對實際應用軟體所能發揮的效能,且能在短時間內得知測試結果,是一個能快速得知是否能 All Core 5GHz的測試軟體
Cinebench Release 20的改進反映了近年來 CPU和渲染技術的整體進步,為 Cinema 4D利用多個 CPU核心和普通用戶可用的現代處理器功能提供了更準確的測量,最重要的是它是免費的

Core i9-11900K@Boost 執行多線程 Cinebench R15時為 All Core 4.7GHz 意即 Core i9-11900K預設不超頻時就能在 All Core 4.7GHz全核心運行
Core i9-11900K@Boost 執行單線程 Cinebench R15 1T時亦見 2 Core 5.1GHz
Core i9-11900K@Boost Cinebench R15單線程及多線程成績 1T 260b nT 2432cb
對照組 Core i9-10900K@Boost Cinebench R15單線程及多線程成績 1T 210cb nT 2647cb
Ryzen 7 5800X@Boost Cinebench R15 CPU test 2557cb Single Core 266cb
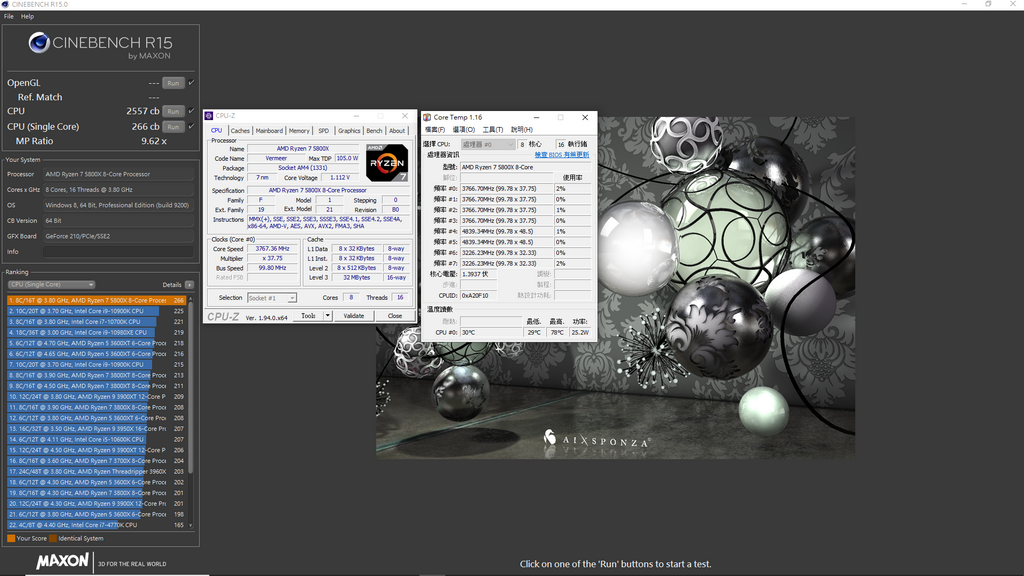
Cinebench R15 CPU test 1T比較表 單位:cb(數字愈大愈好)

Core i9-11900K@Boost 執行多線程 Cinebench R20時同樣為 All Core 4.7GHz 再次證實 Core i9-11900K預設不超頻時就能在 All Core 4.7GHz全核心運行
Cinebench R20 CPU test Results
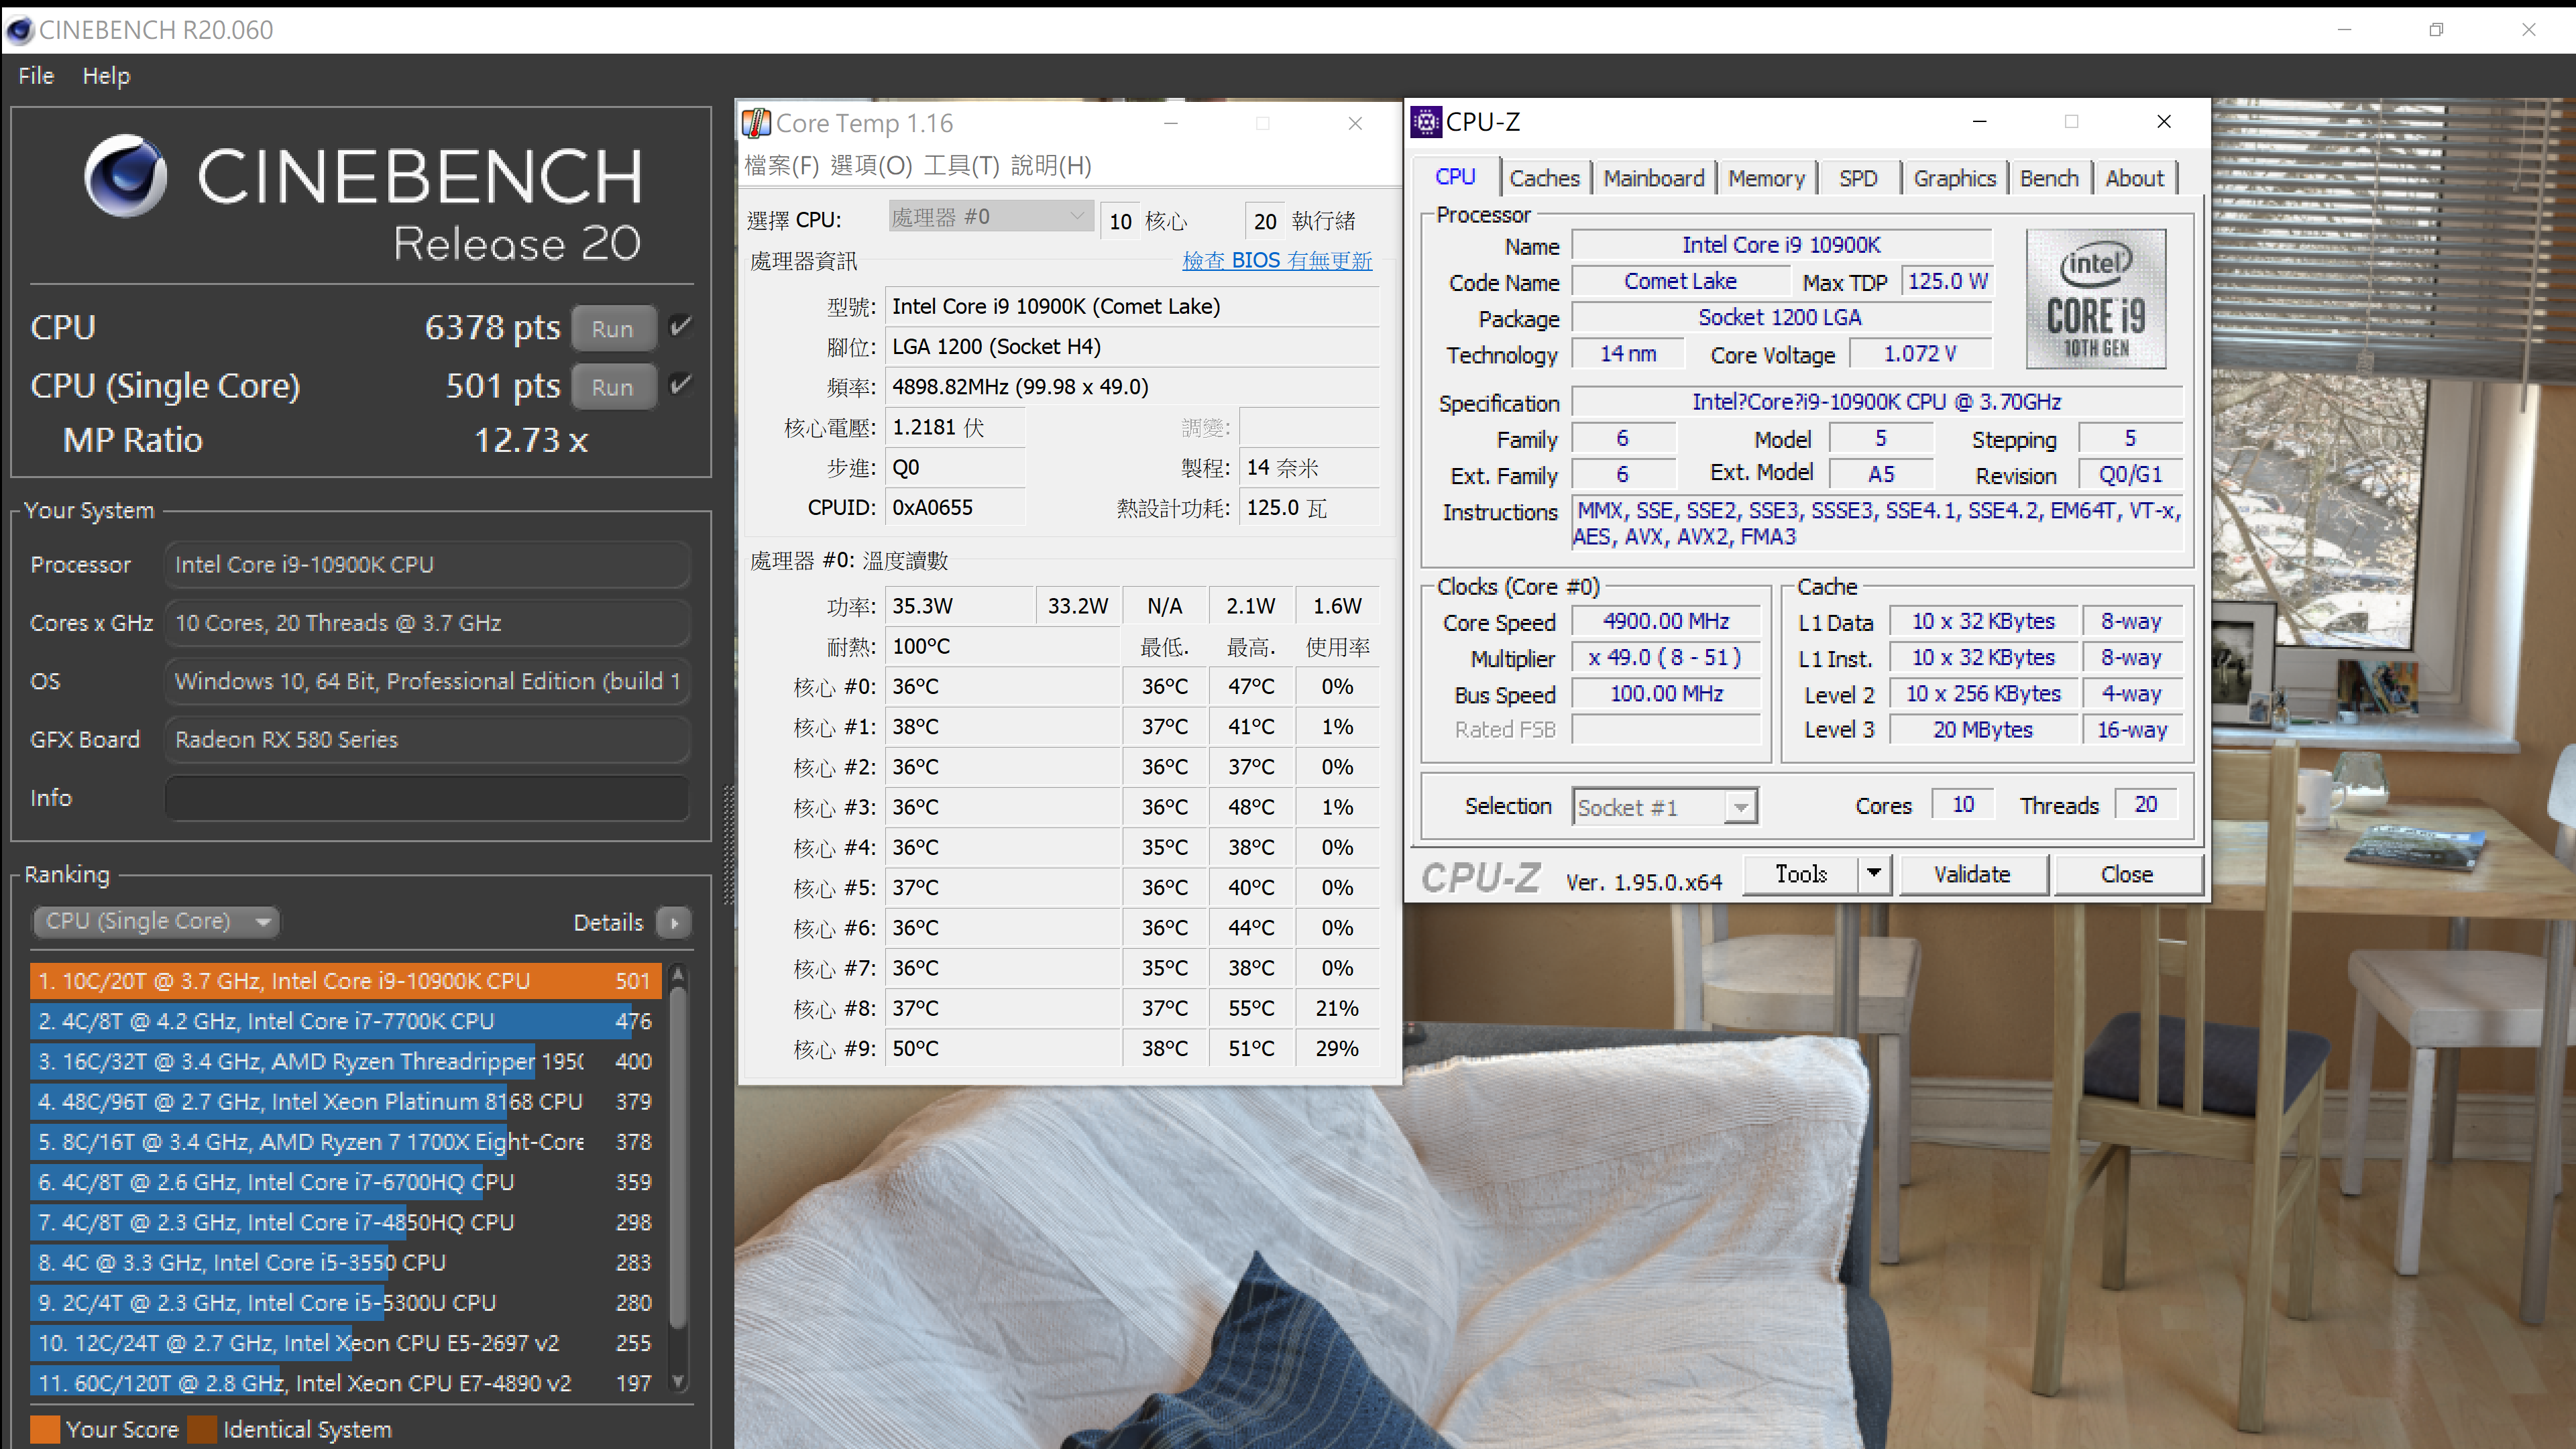
Core i9-11900K@Boost 執行 Cinebench R20單線程及多線程成績 1T 642pts nT 6016pts

對照組 Core i9-10900K@Boost Cinebench R20單線程及多線程成績 1T 501pts nT 6378pts
Ryzen 7 5800X@Boost Cinebench R20 CPU test 6057pts Single Core 623pts
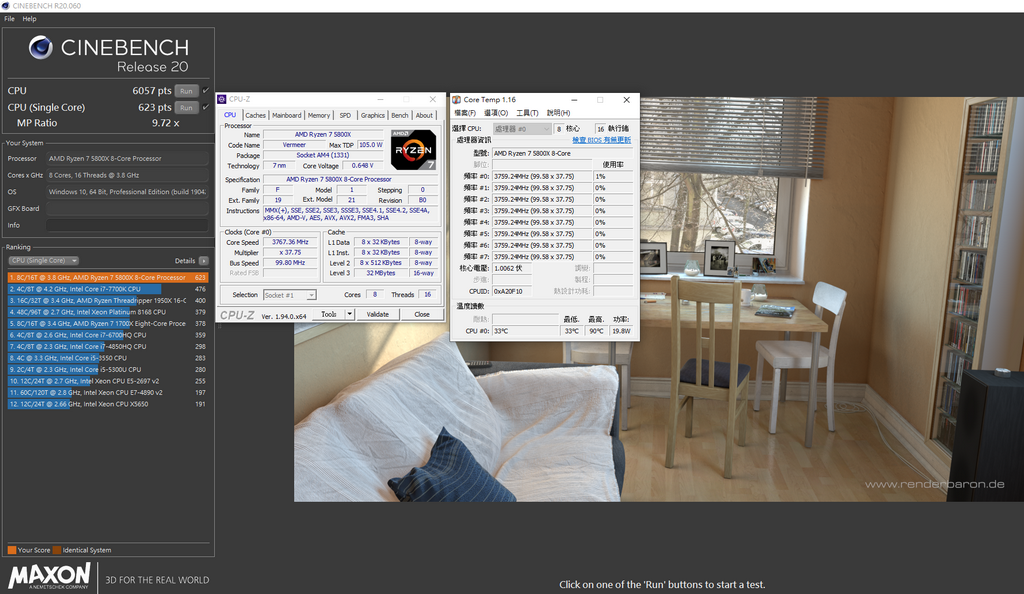
Cinebench R20 CPU test 1T比較表 單位 : pts(數字愈大愈好)

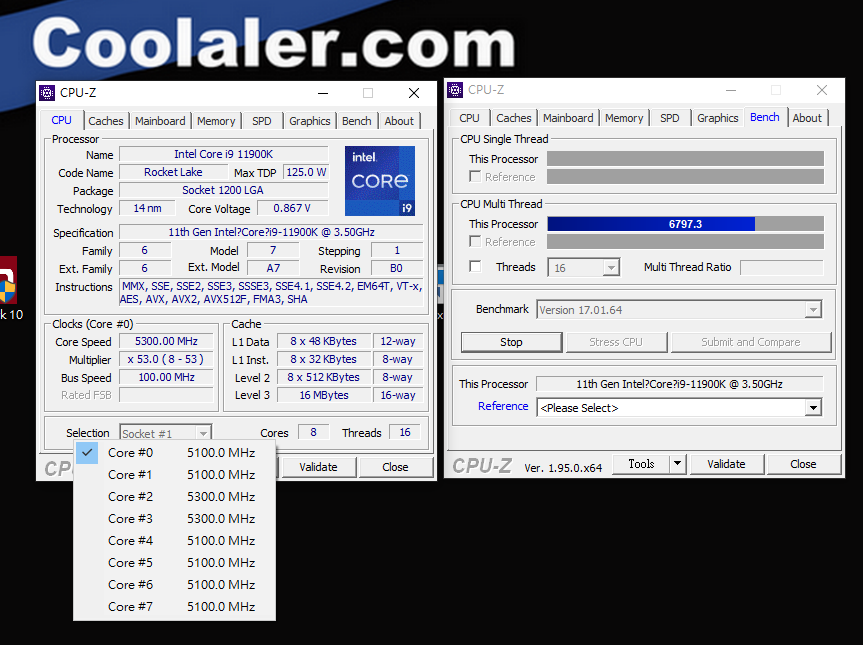
4.CPU-Z Bench
CPU-Z為一個中央處理器、記憶體及主機板資訊的 Windows軟體,在近年新增了 Bench item,提供處理器的快速簡單測試
Core i9-11900K@Boost 執行CPU-Z Bench成績 Single Thread 702.8 Multi Thread 6597.4
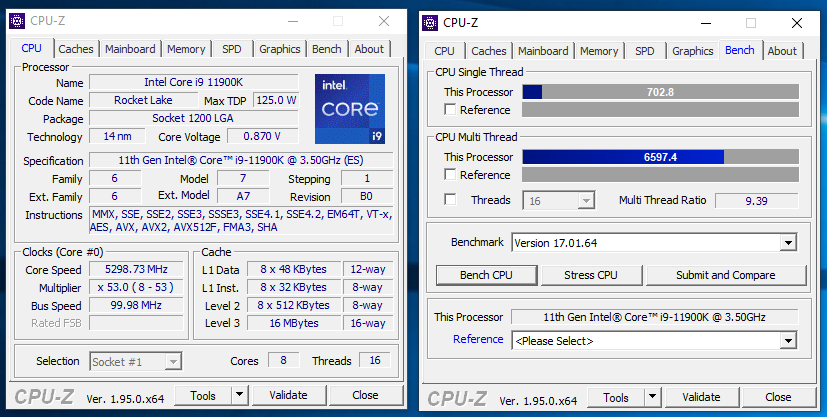
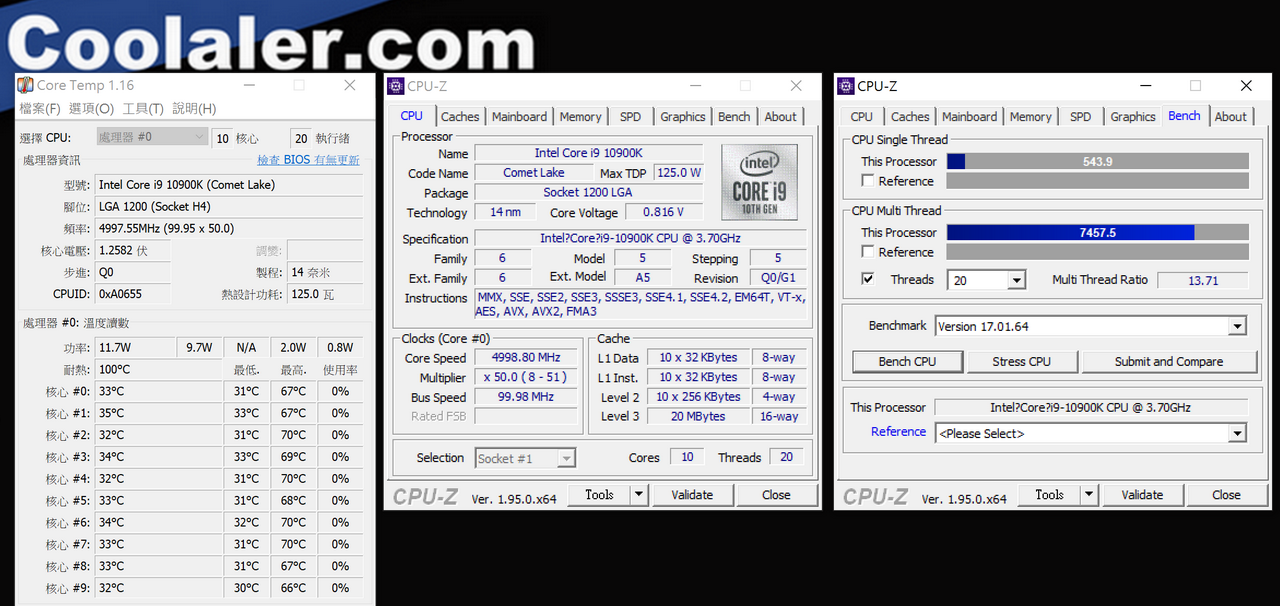
對照組 10900K@Boost CPU-Z Bench Single Thread 543.0Multi Thread 7457.5
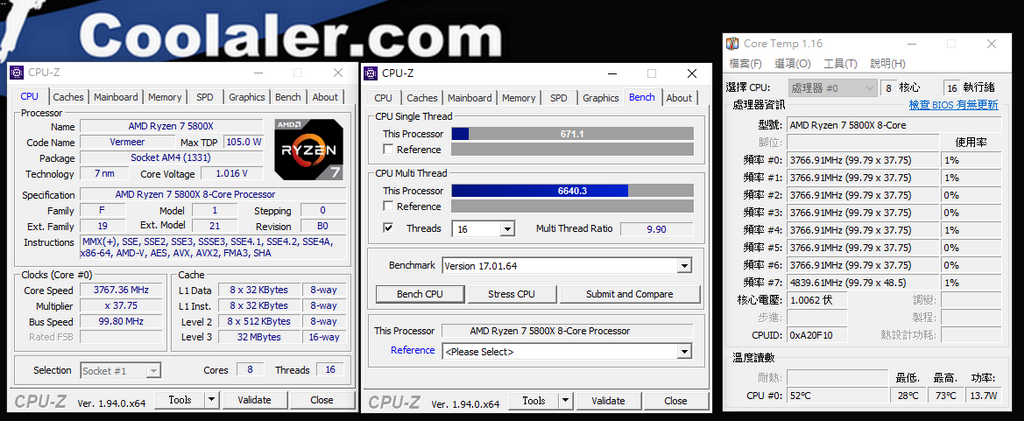
Ryzen 7 5800X@Boost CPU-Z Bench Single Thread 671.0 Multi Thread 6640.3
CPU-Z Bench比較表 單位 : Score(數字愈大愈好)

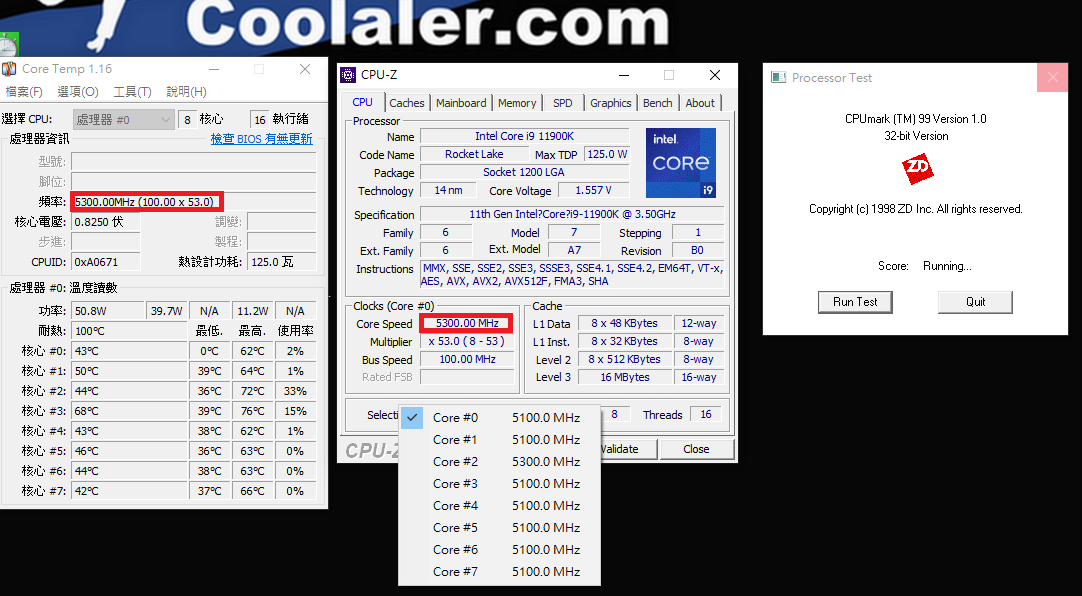
5.CPUMark99
Core i9-11900K@Boost執行 CPUMark99測試時 3 Core為 5.1GHz
CPUMark99是專門用于 Windows的一款運算測試軟體,測試過程簡短且只支援單工
Core i9-11900K@Boost執行 CPUMark99成績 997分
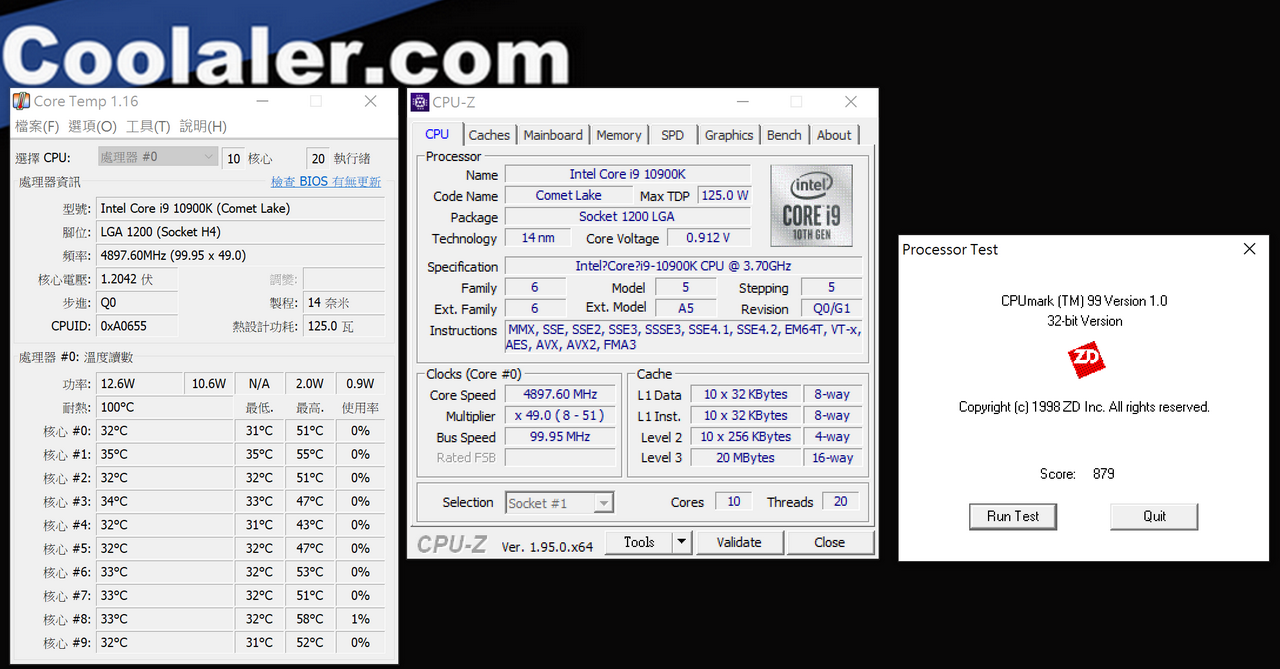
對照組 Core i9-10900K@Boost執行 CPUMark99成績 879分
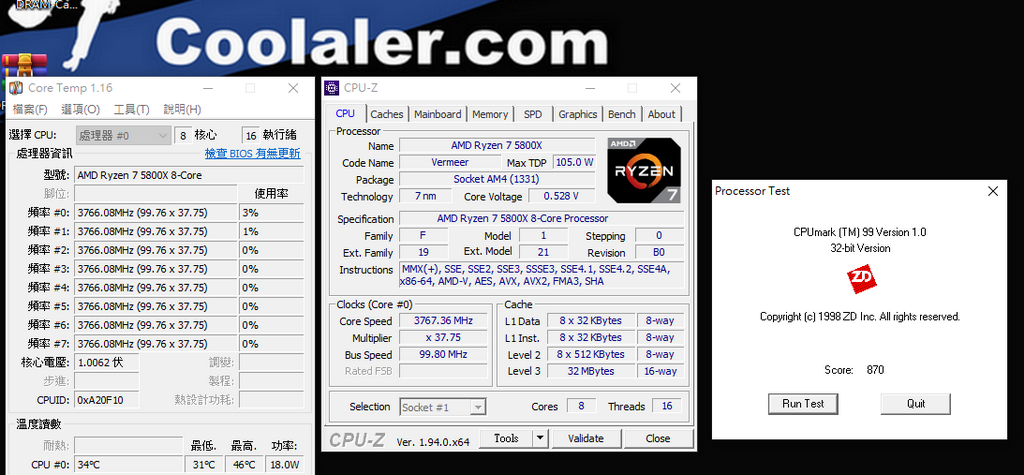
對照組 Ryzen 7 5800X@Boost 之 CPUMark99 為 870分
CPUMark99比較表 單位 : Score(數字愈大愈好)

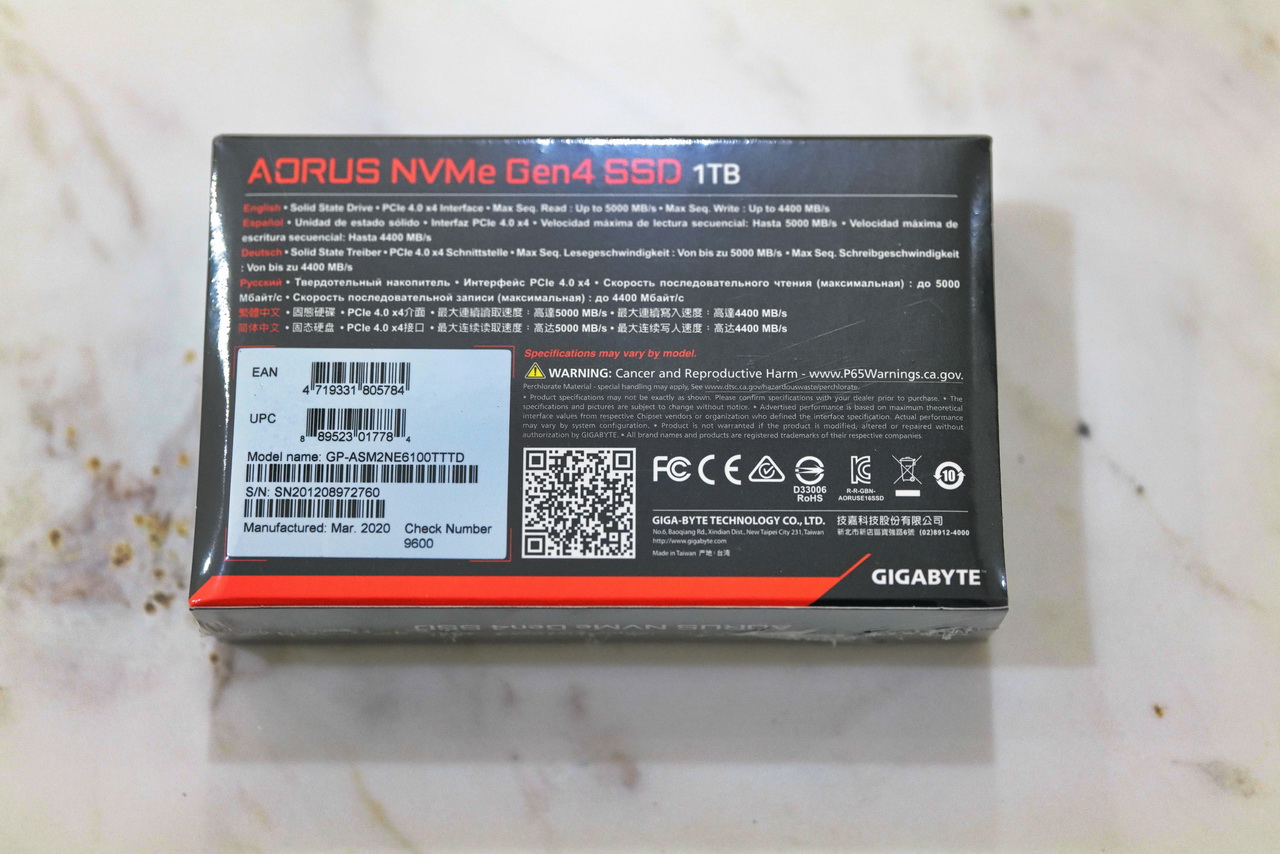
6.GIGABYTE AORUS電競 NVMe Gen4 M.2 SSD 1TB固態硬碟測試
「Rocket Lake-S」另一個重大升級就是正式支援 PCIe 4.0,基於新的 500系列晶片組包括 Z590、B560、H510 等主機板,因此在搭配 500系列主機板的情況下,CPU部份可最多分出 20條 PCIe 4.0 Lanes,可滿足一張顯示卡及 x4 NVMe SSD的基本需求,同時原生支援 USB 3.2 Gen 2×2 ( 20G ),與 PCH相連的 DMI總線亦由 PCIe 3.0 x4速度升級到 PCIe 3.0 x8速度,而本項測試就是針對 11900K+Z590之 PCIe 4.0 M.2 NVMe SSD做測試比較
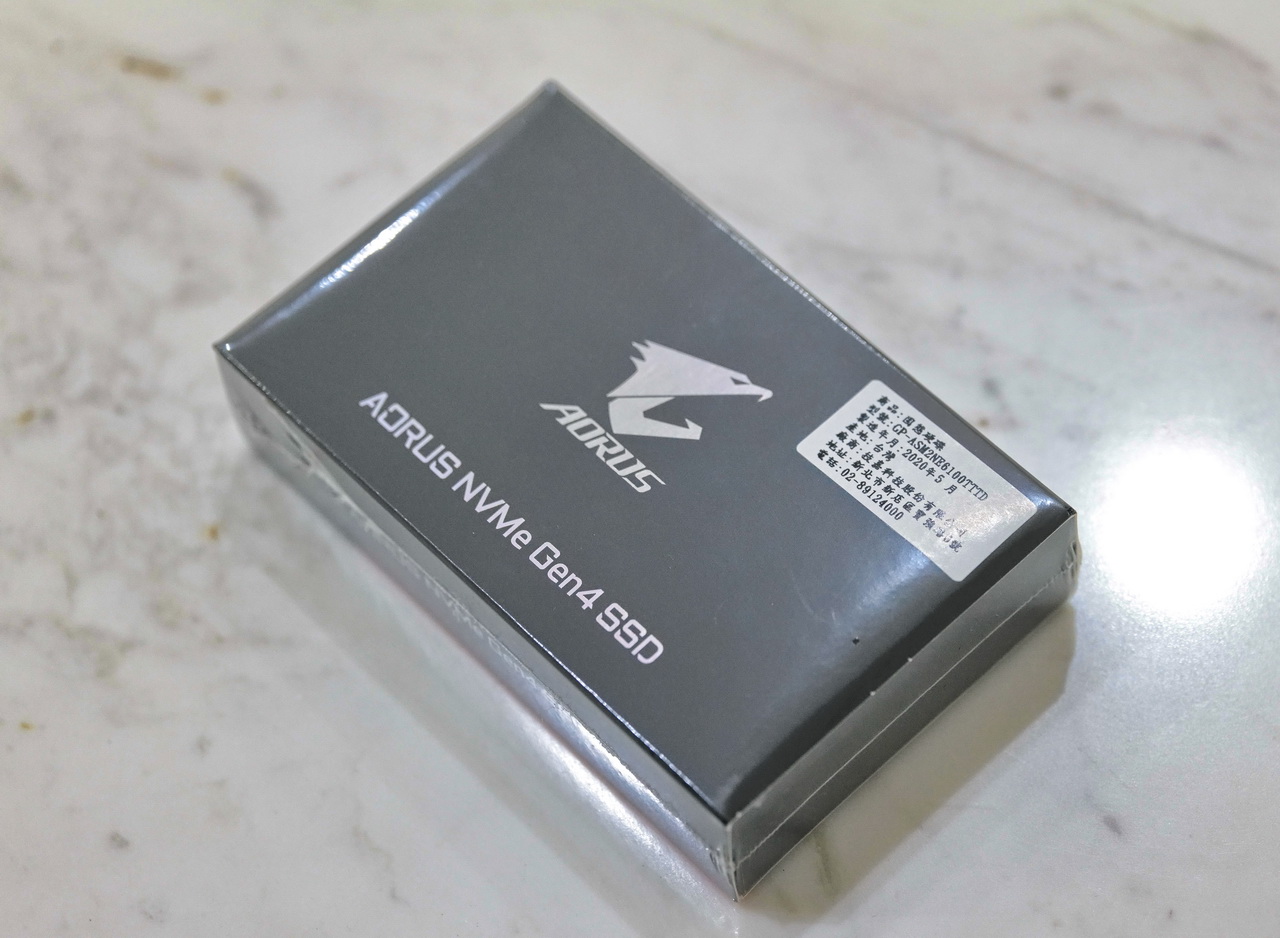
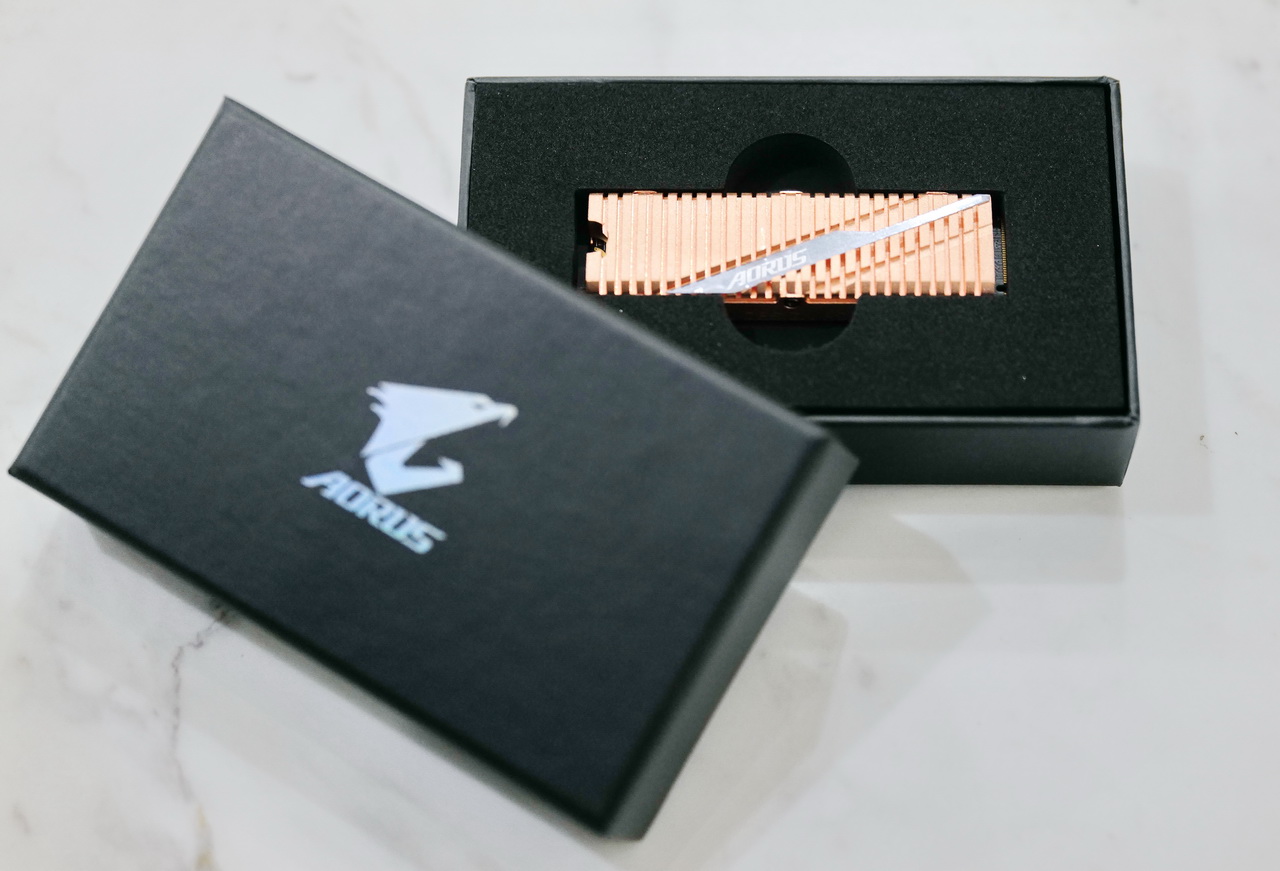
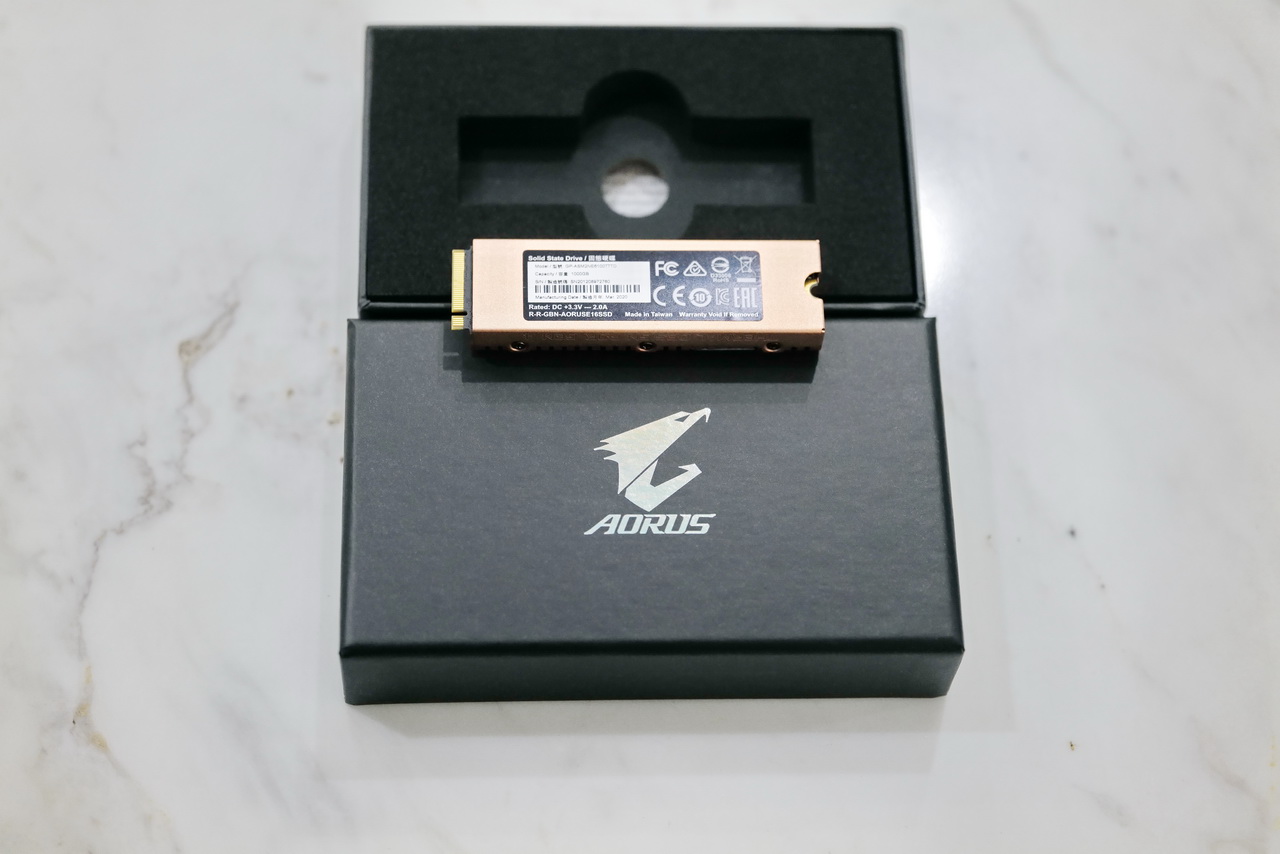
GIGABYTE AORUS NVMe GEN4 SSD 1TB
全球首款 PCIe 4.0×4控制晶片,Phison PS5016-E16控制晶片,採用 28nm製造技術製造。 先進的製造工藝確保PS5016-E16搭配最新的 3D TLC NAND快閃記憶體時具有足夠的 ECC容錯處理能力。PS5016-E16還具有 8個 NAND通道及 32個 CE targets,並可支援 DDR4 DRAM快取和 PCIe 4.0 x4介面。 而在其他功能部分,這顆全新控制器支援 NVMe 1.3協議、LDPC糾錯、損耗平均技術及超額配置技術,以提高固態硬碟的可靠性和耐用性
TOSHIBA BiCS4 NAND快閃記憶體顆粒透過增加層數至96層,來進行電路和架構最佳化,進而達到每單位面積更高的儲存空間。 AORUS NVMe Gen4 SSD固態硬碟的800MT / s吞吐量遠遠超過PCIe 3.0 x4設備,具有出色的儲存效能。憑藉新的PCIe 4.0介面控制晶片,AORUS NVMe Gen4 SSD固態硬碟可提供高達 5000 MB/秒的循序讀取速度和高達4400 MB/秒的循序寫入速度。PCIe 4.0 固態硬碟的順序讀取性能比PCIe 3.0 固態硬碟快40%。可提供更快、更順暢的遊戲串流和圖形密集渲染體驗,讓玩家為下一代的電腦運算做好準備
全包覆式純銅散熱片同時為配置在固態硬碟正反面的控制晶片和 NAND記憶顆粒等關鍵組件的進行散熱。與鋁製散熱器相比,純銅散熱片具有傳熱能力提高 69%,讓 AORUS NVMe Gen4 SSD固態硬碟獲得最佳的讀/寫散熱性能。相較於一般小型 M.2散熱片,AORUS NVMe Gen4 SSD固態硬碟採用的新型高效純銅散熱片,搭配正面的 27道剖溝,大幅增加了散熱表面積,讓固態硬碟在高速運作下產生的廢熱可以有效傳輸到散熱片,進而更快地獲得更好的熱平衡。此外,最佳化的剖溝角度設計,讓散熱片可以與不同方向的系統風流方向進行大量且快速的熱交換。 這兩種獨特的設計確保了PCIe 4.0 固態硬碟的關鍵零件能夠在超高傳輸速率下保持最佳的工作溫度
全新的 SSD Toolbox應用程式,可以讓使用者監控和管理包括型號、韌體版本、運作狀況等技嘉固態硬碟的各項數據,讓玩家可以隨時掌握固態硬碟的使用狀態及相關安全係數或使用安全抹除功能清除所有資料。 您可以從支持頁面下載 SSD Tool Box使用
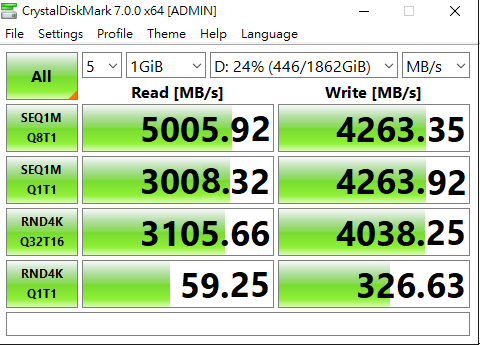
11900K@GIGABYTE AORUS NVMe GEN4 SSD 1TB CrystalDiskMarkinfo PCIe 4.0X4 Benchmark
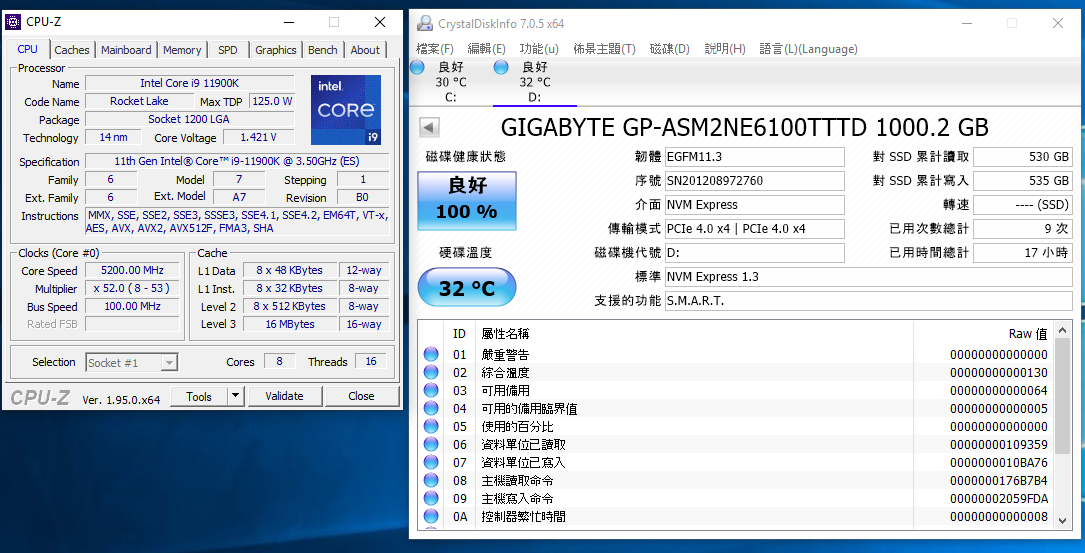
11900K@PCIe 4.0X4 CrystalDiskMark
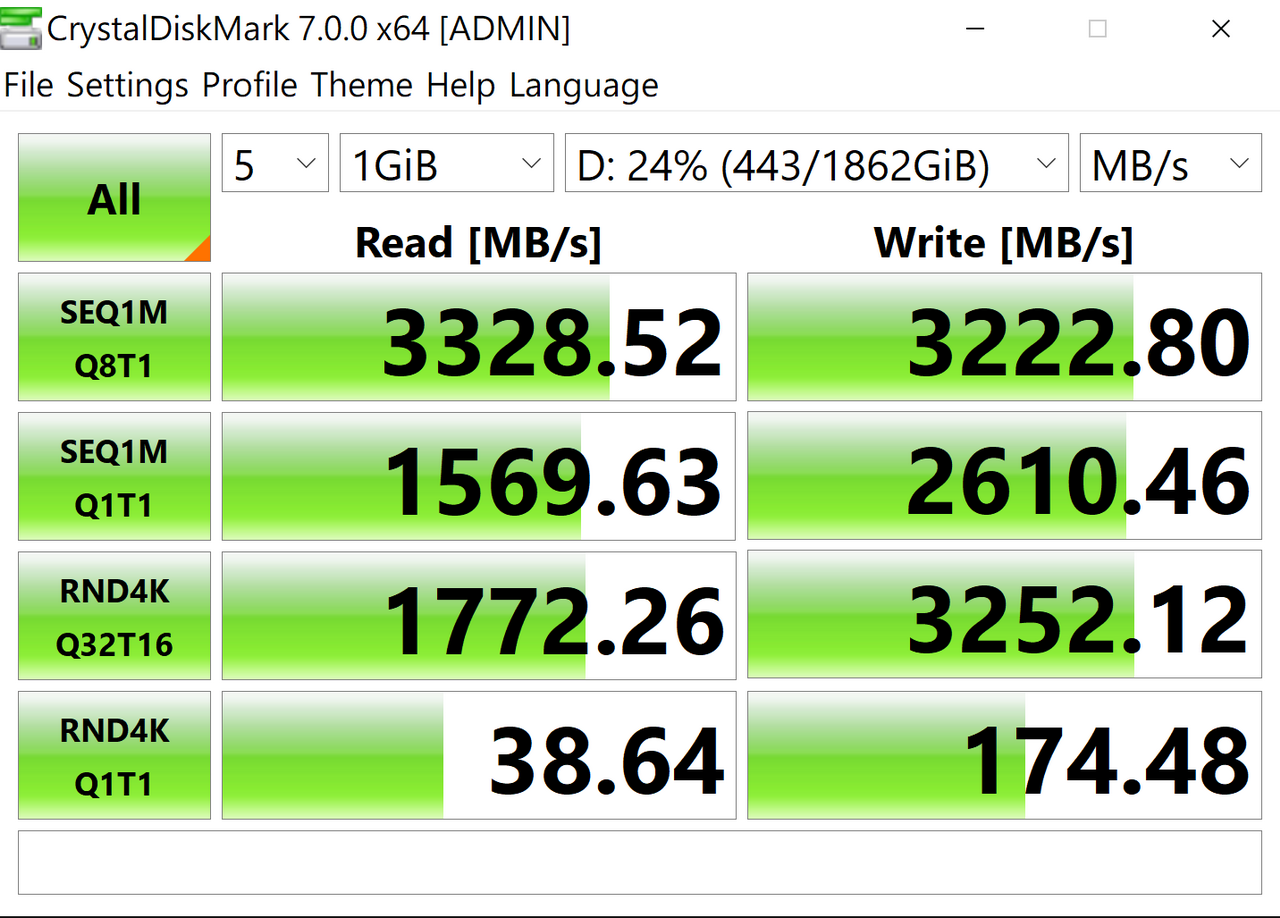
對照組 10900K@GIGABYTE AORUS NVMe GEN4 SSD 1TB CrystalDiskMarkinfo PCIe 3.0X4 Benchmark
5800X@GIGABYTE AORUS NVMe GEN4 SSD 1TB CrystalDiskMarkinfo PCIe 4.0X4 Benchmark
5800X CrystalDiskMark PCIe 4.0X4
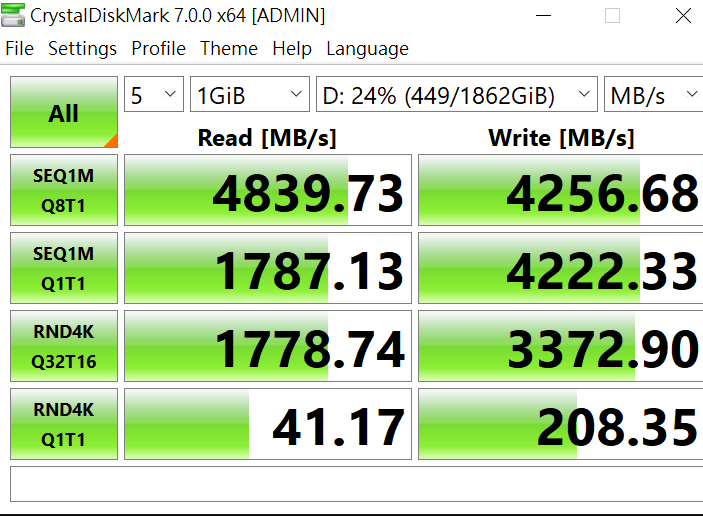
GIGABYTE AORUS NVMe GEN4 SSD 1TB PCIe 4.0 M.2 SSD CrystalDiskMark測試比較表 單位:MB/S(數字愈大愈好)

7.Gaming Benchmark
測試諸元:
Core i9-11900K@Boost
對照組
Core i9-10900K@Boost
Ryzen 7 5800X@Boost
a.Far Cry 5 Benchmark
Far Cry 5 Benchmark《極地戰嚎5》
Far Cry 5《極地戰嚎5》是一個自帶 Benchmark的新遊戲,是由育碧蒙特婁、育碧多倫多開發和育碧軟體發行的開放世界第一人稱動作冒險遊戲

1080P Far Cry 5 Benchmark Ave Results
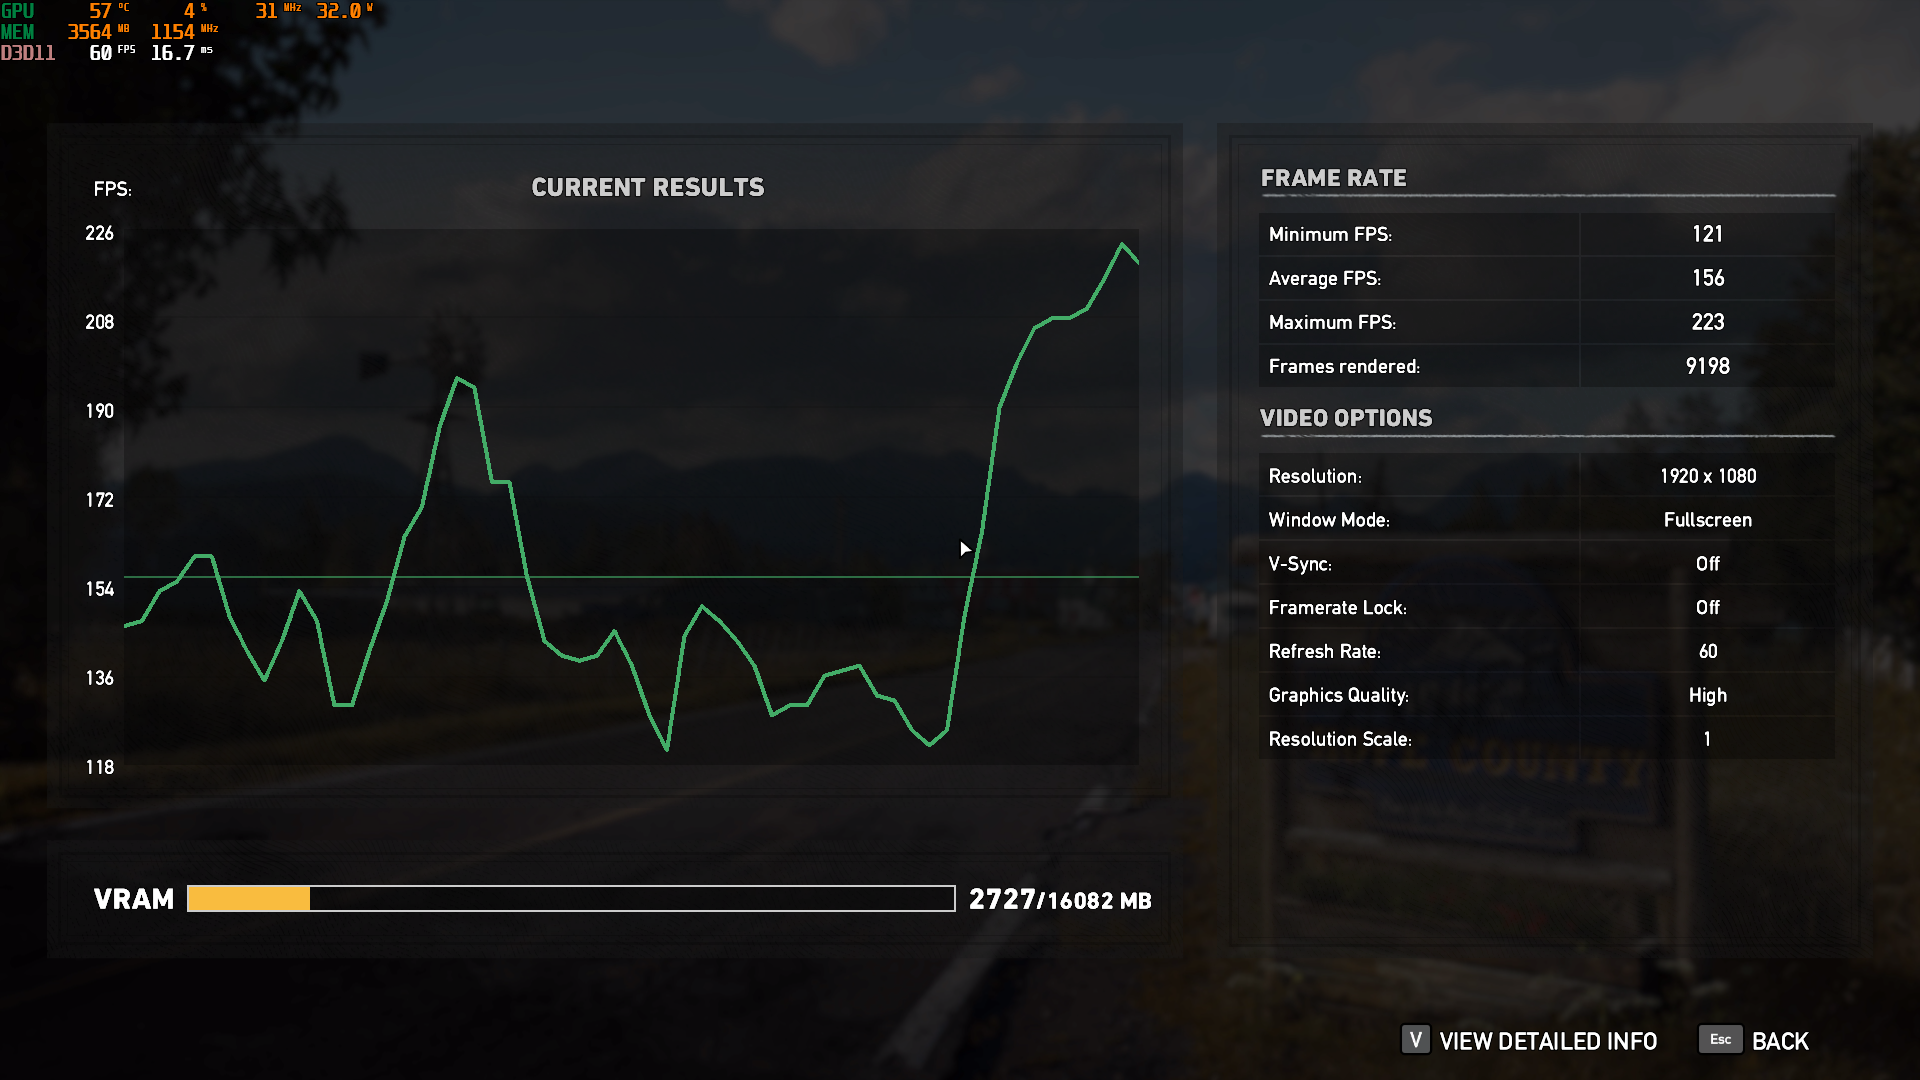
Core i9-11900K@Boost 1080P Far Cry 5 1080P Benchmark Ave 158fps

對照組
Core i9-10900K@Boost 1080P Far Cry 5 1080P Benchmark Ave 155fps

Ryzen 7 5800X@Boost
1080P Far Cry 5 1080P Benchmark Ave 151fps

Far Cry 5 1080P比較表 單位 : fps(數字愈大愈好)

Far Cry 5 Benchmark 4K Ave Results
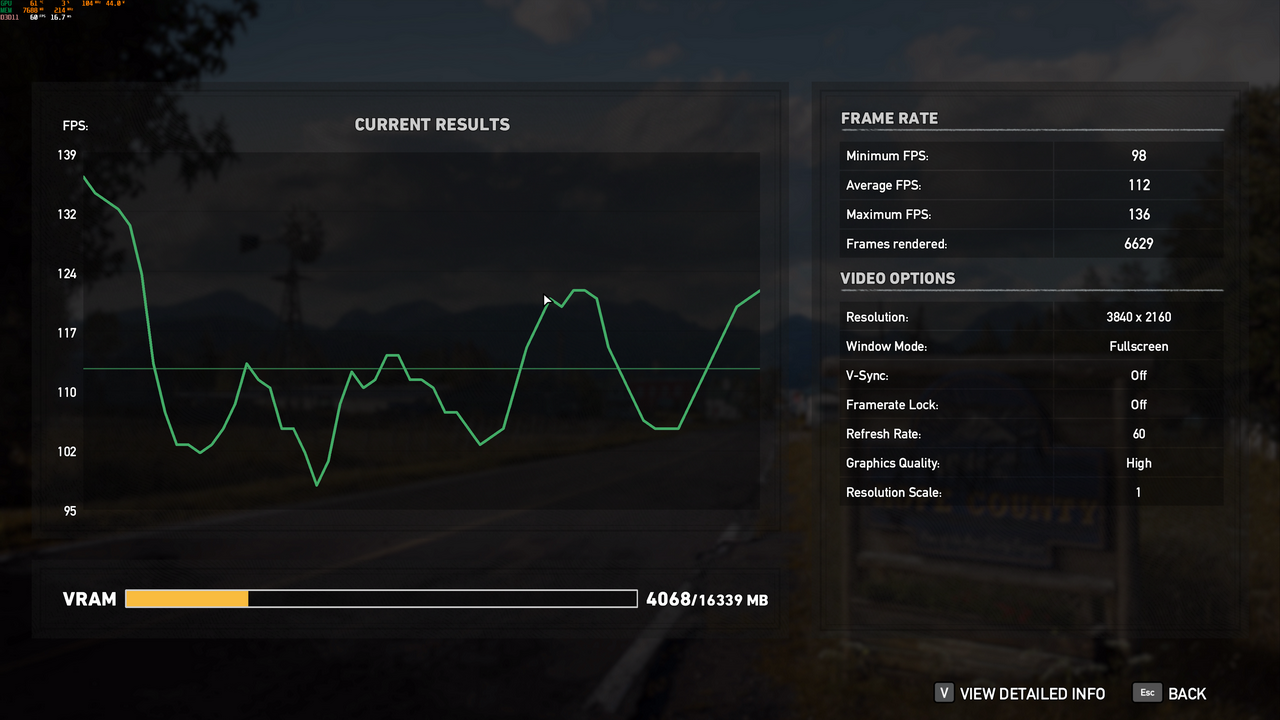
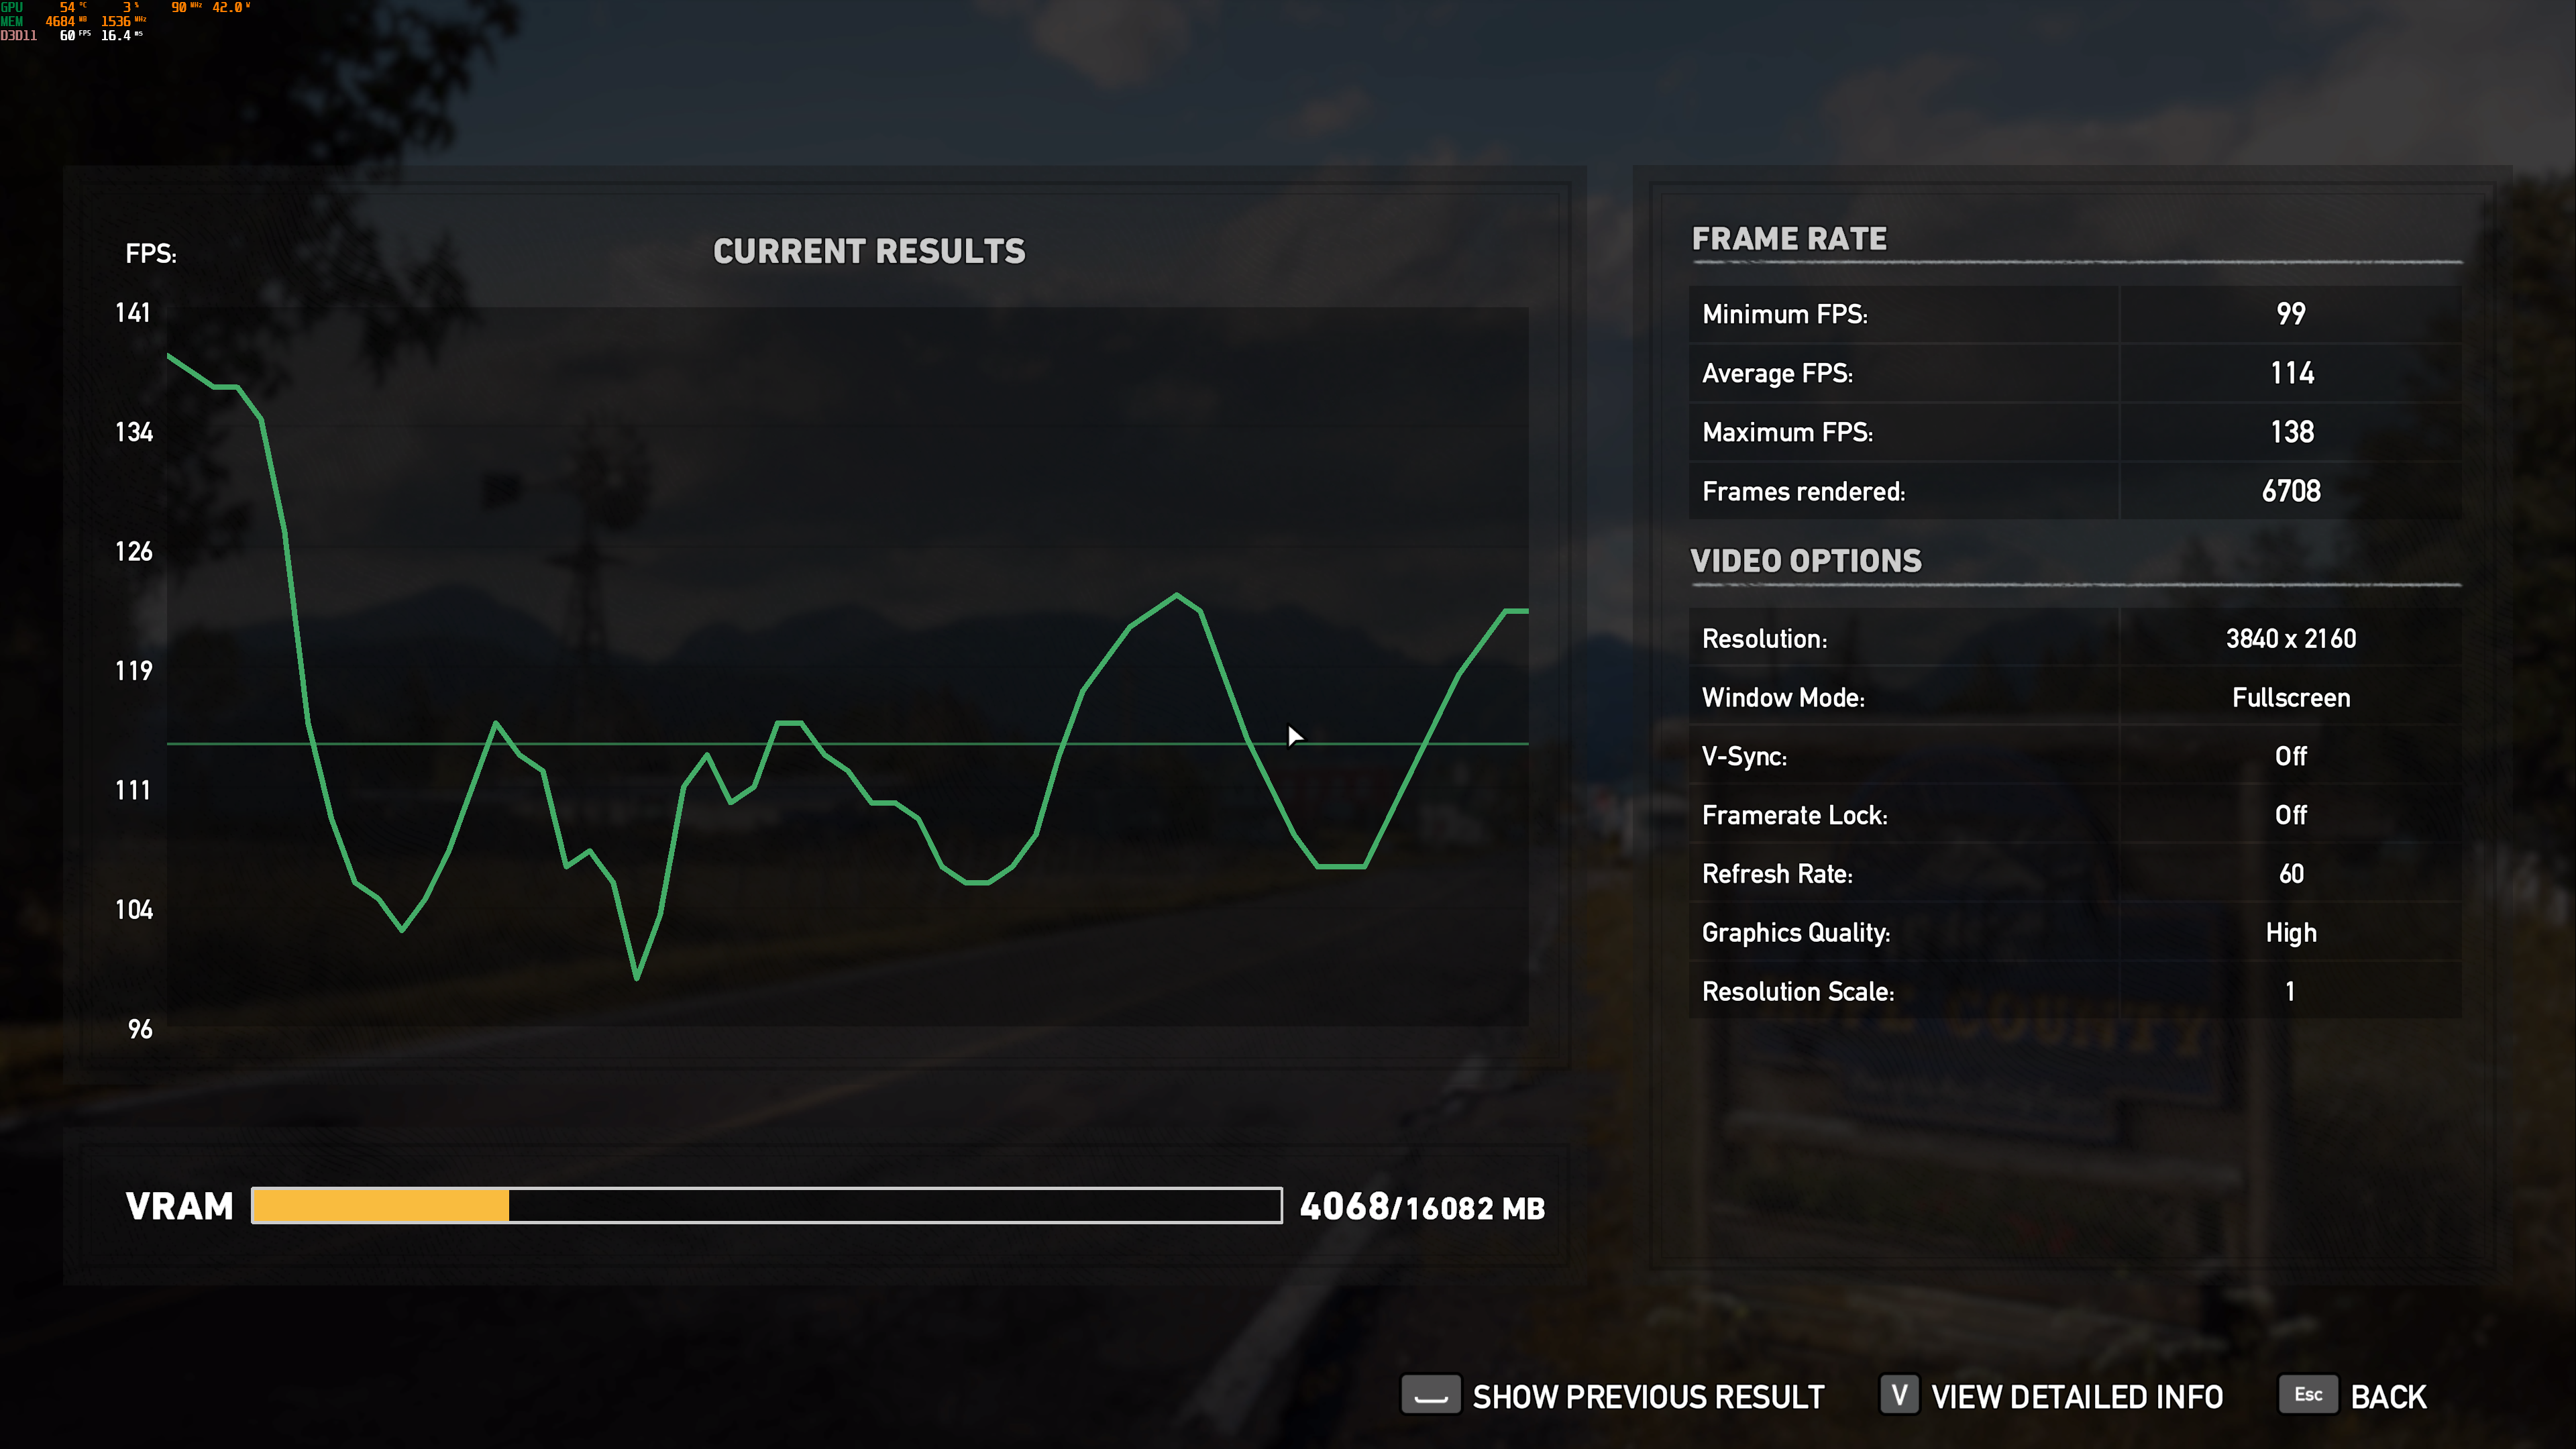
Core i9-11900K@Boost 4K Far Cry 5 Benchmark Ave 113ps

Core i9-10900K@Boost 4K Far Cry 5 Benchmark Ave 113ps
Ryzen 7 5800X@Boost
4K Far Cry 5 Benchmark Ave 114ps
Far Cry 5 4K比較表 單位 : fps(數字愈大愈好)

b.Rise of the Tomb Raider Benchmark
Rise of the Tomb Raider Benchmark《古墓奇兵:崛起》
Rise of the Tomb Raider《古墓奇兵:崛起》,是一款由晶體動力開發,微軟工作室和史克威爾艾尼克斯合作發行的動作冒險遊戲,同樣自帶測試軟體,本作是 2013年《古墓奇兵》的續作

Rise of the Tomb Raider Benchmark 1080P Overall fps Results
Core i9-11900K@Boost 1080P Rise of the Tomb Raider Benchmark Overall:228.52FPS

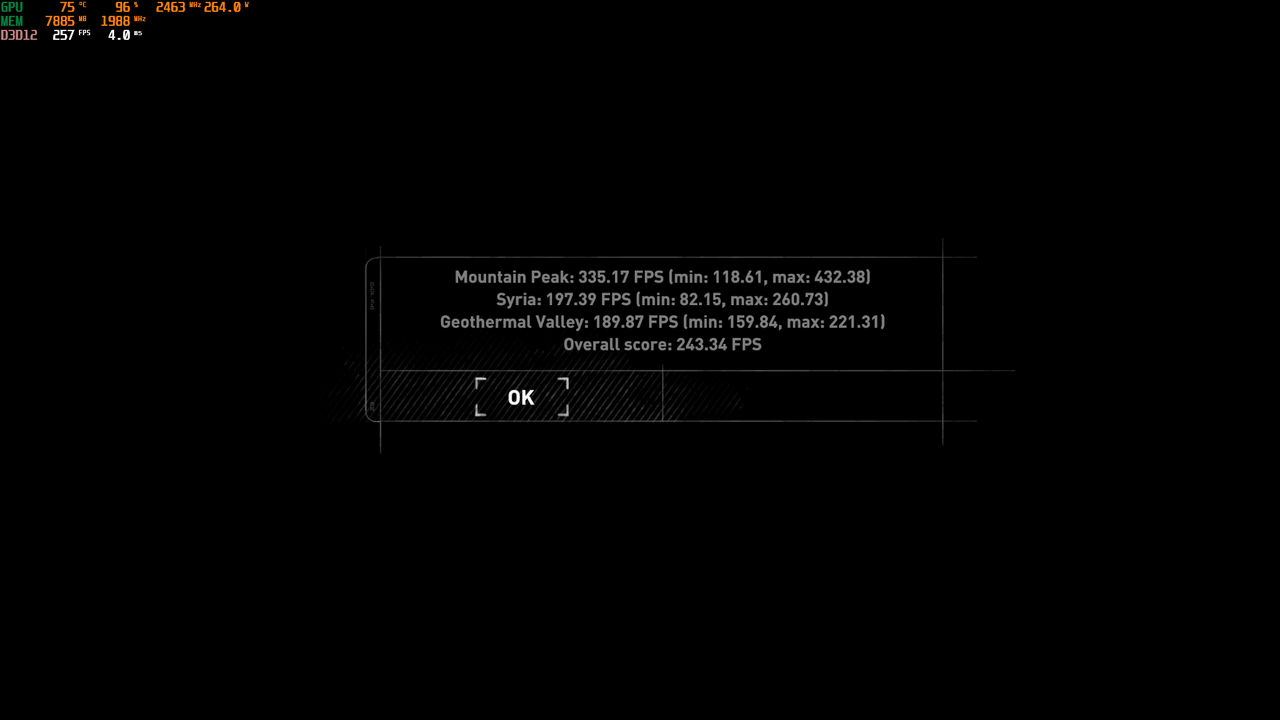
對照組 Core i9-10900K@Boost 1080P Rise of the Tomb Raider Benchmark Overall:243.34FPS
Ryzen 7 5800X@Boost
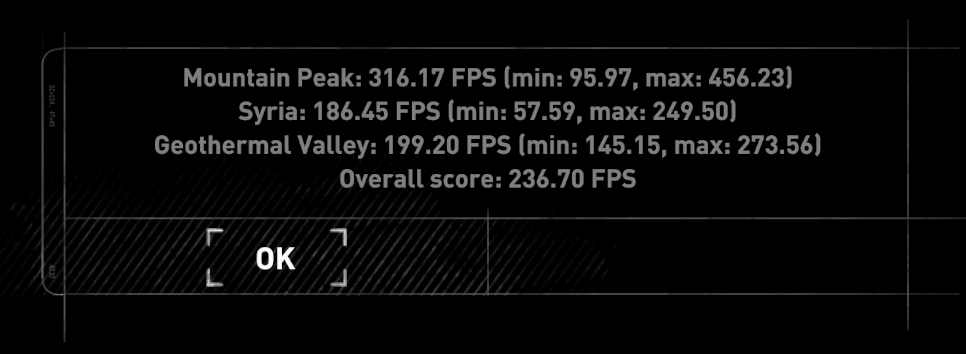
1080P Rise of the Tomb Raider Benchmark Overall:236.7FPS
Rise of the Tomb Raider Benchmark 1080P比較表 單位 : fps(數字愈大愈好)

Rise of the Tomb Raider Benchmark 4K Overall fps Results
Core i9-11900K@Boost 4K Rise of the Tomb Raider Benchmark Overall:110.76FPS

對照組
Core i9-10900K@Boost 4K Rise of the Tomb Raider Benchmark Overall:141.47FPS

Ryzen 7 5800X@Boost
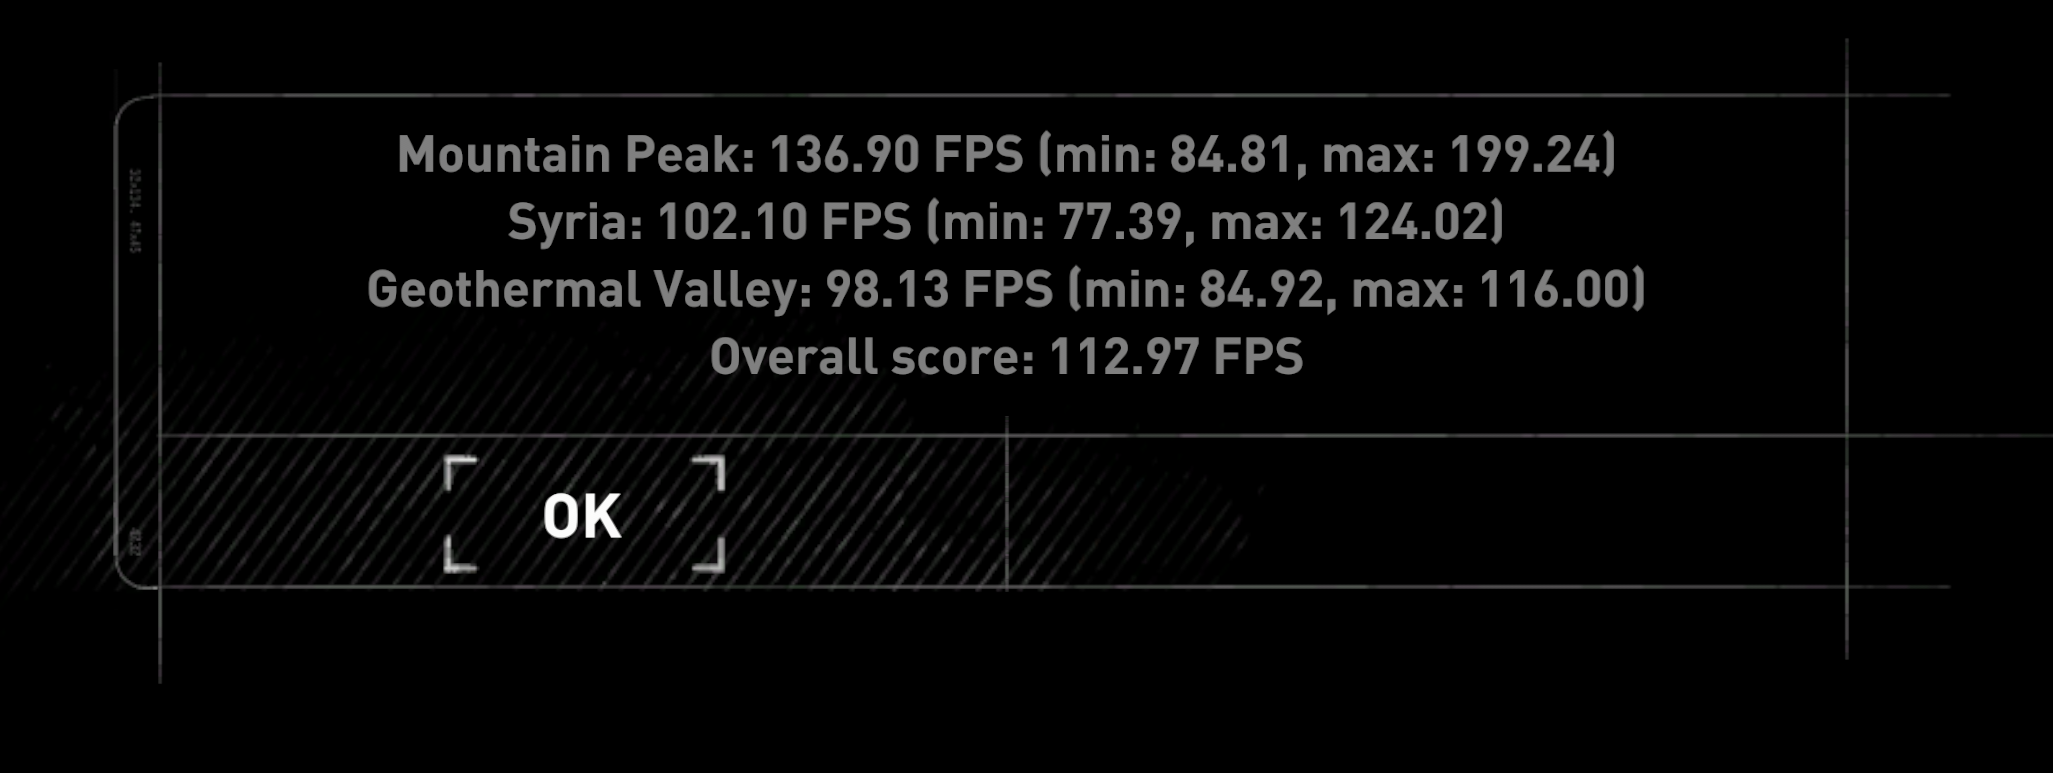
4K Rise of the Tomb Raider Benchmark Overall:112.97FPS
Rise of the Tomb Raider Benchmark 4K比較表 單位 : fps(數字愈大愈好)

c.Assassin's Creed Origins Benchmark
Assassin's Creed Origins《刺客教條:起源》中國大陸譯作「刺客信條:起源」)是一部由育碧蒙特婁開發由育碧公司發行的動作冒險遊戲
本作是刺客教條主系列的第十部作品,也是系列首次把時間線推前到刺客教條初代以前,同樣也自帶有測試軟體,遊戲的舞台是在托勒密王朝埃及豔后統治下的埃及,玩家所操控的角色是一位隸屬於法老的護衛,稱為守護者(Medjai),來自錫瓦(Siwa)名為巴耶克(Bayek)的埃及刺客

Assassin's Creed Origins Benchmark 1080P Results
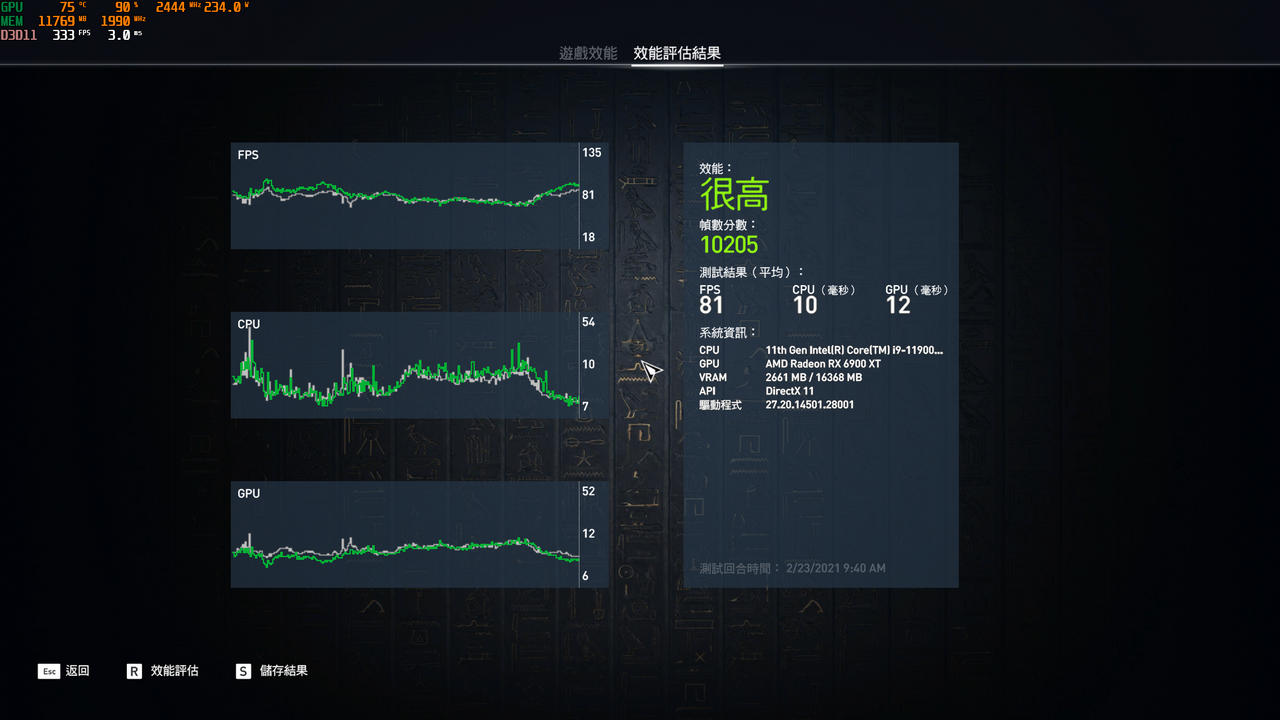
Core i9-11900K@Boost 1080P Assassin's Creed Origins Benchmark :10205分
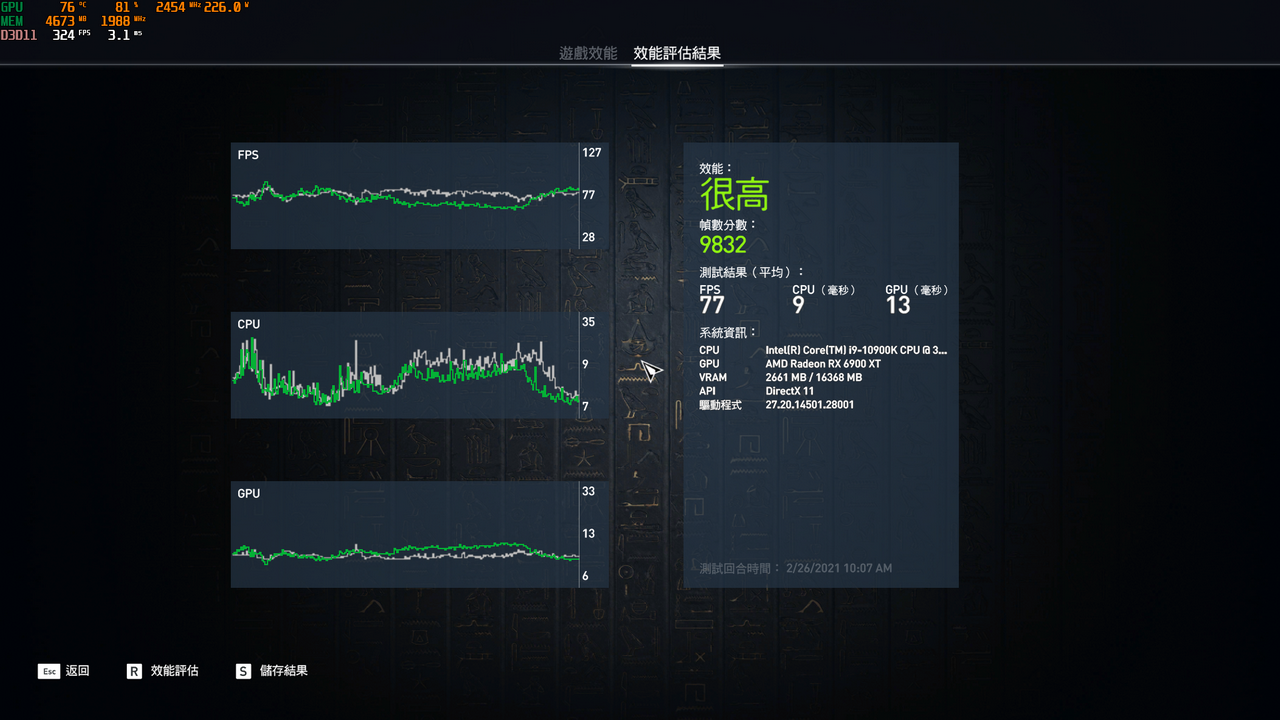
對照組 Core i9-10900K@Boost 1080P Assassin's Creed Origins Benchmark :9832分
Ryzen 7 5800X@Boost
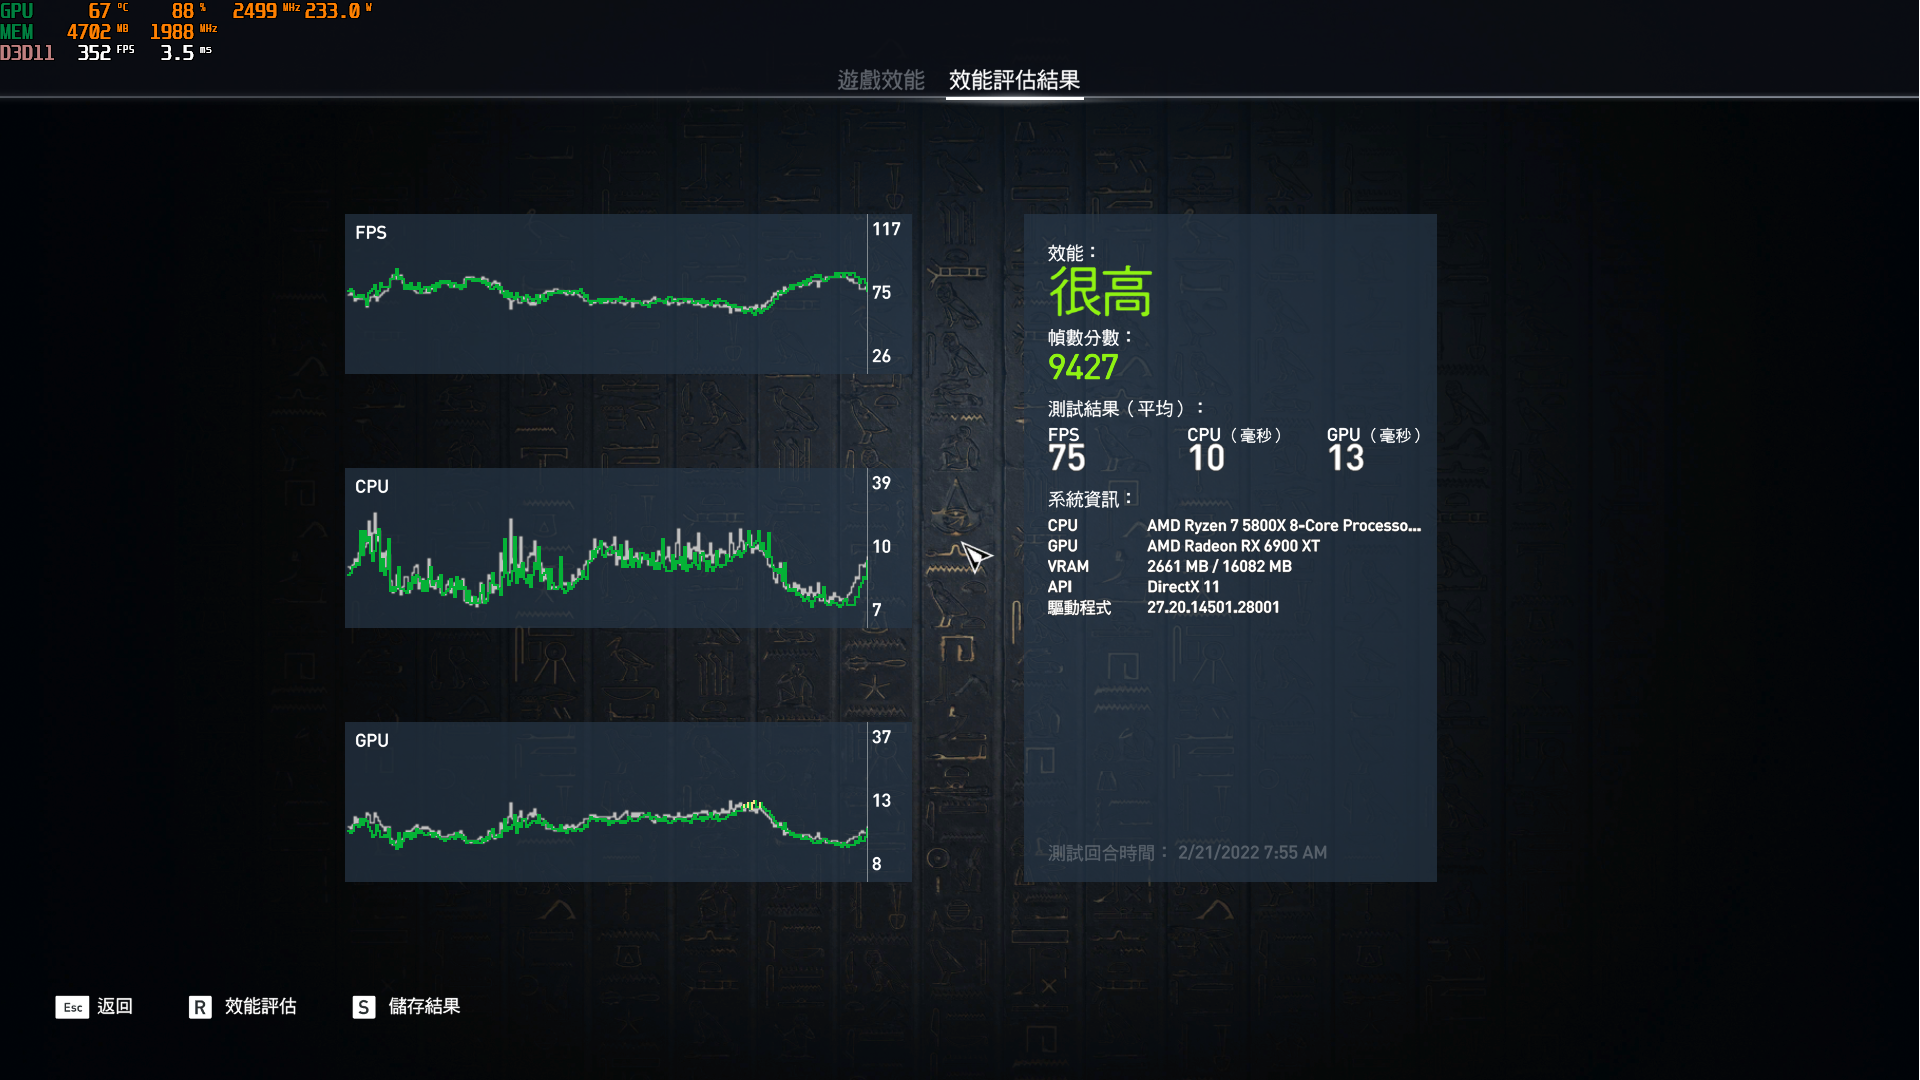
1080P Assassin's Creed Origins Benchmark :9427分
Assassin's Creed Origins Benchmark 1080P比較表 單位 : Score(數字愈大愈好)

Assassin's Creed Origins Benchmark 4K Results
Core i9-11900K@Boost 4K Assassin's Creed Origins Benchmark:9485分

對照組 Core i9-10900K@Boost 4K Assassin's Creed Origins Benchmark:9240分

Ryzen 7 5800X@Boost
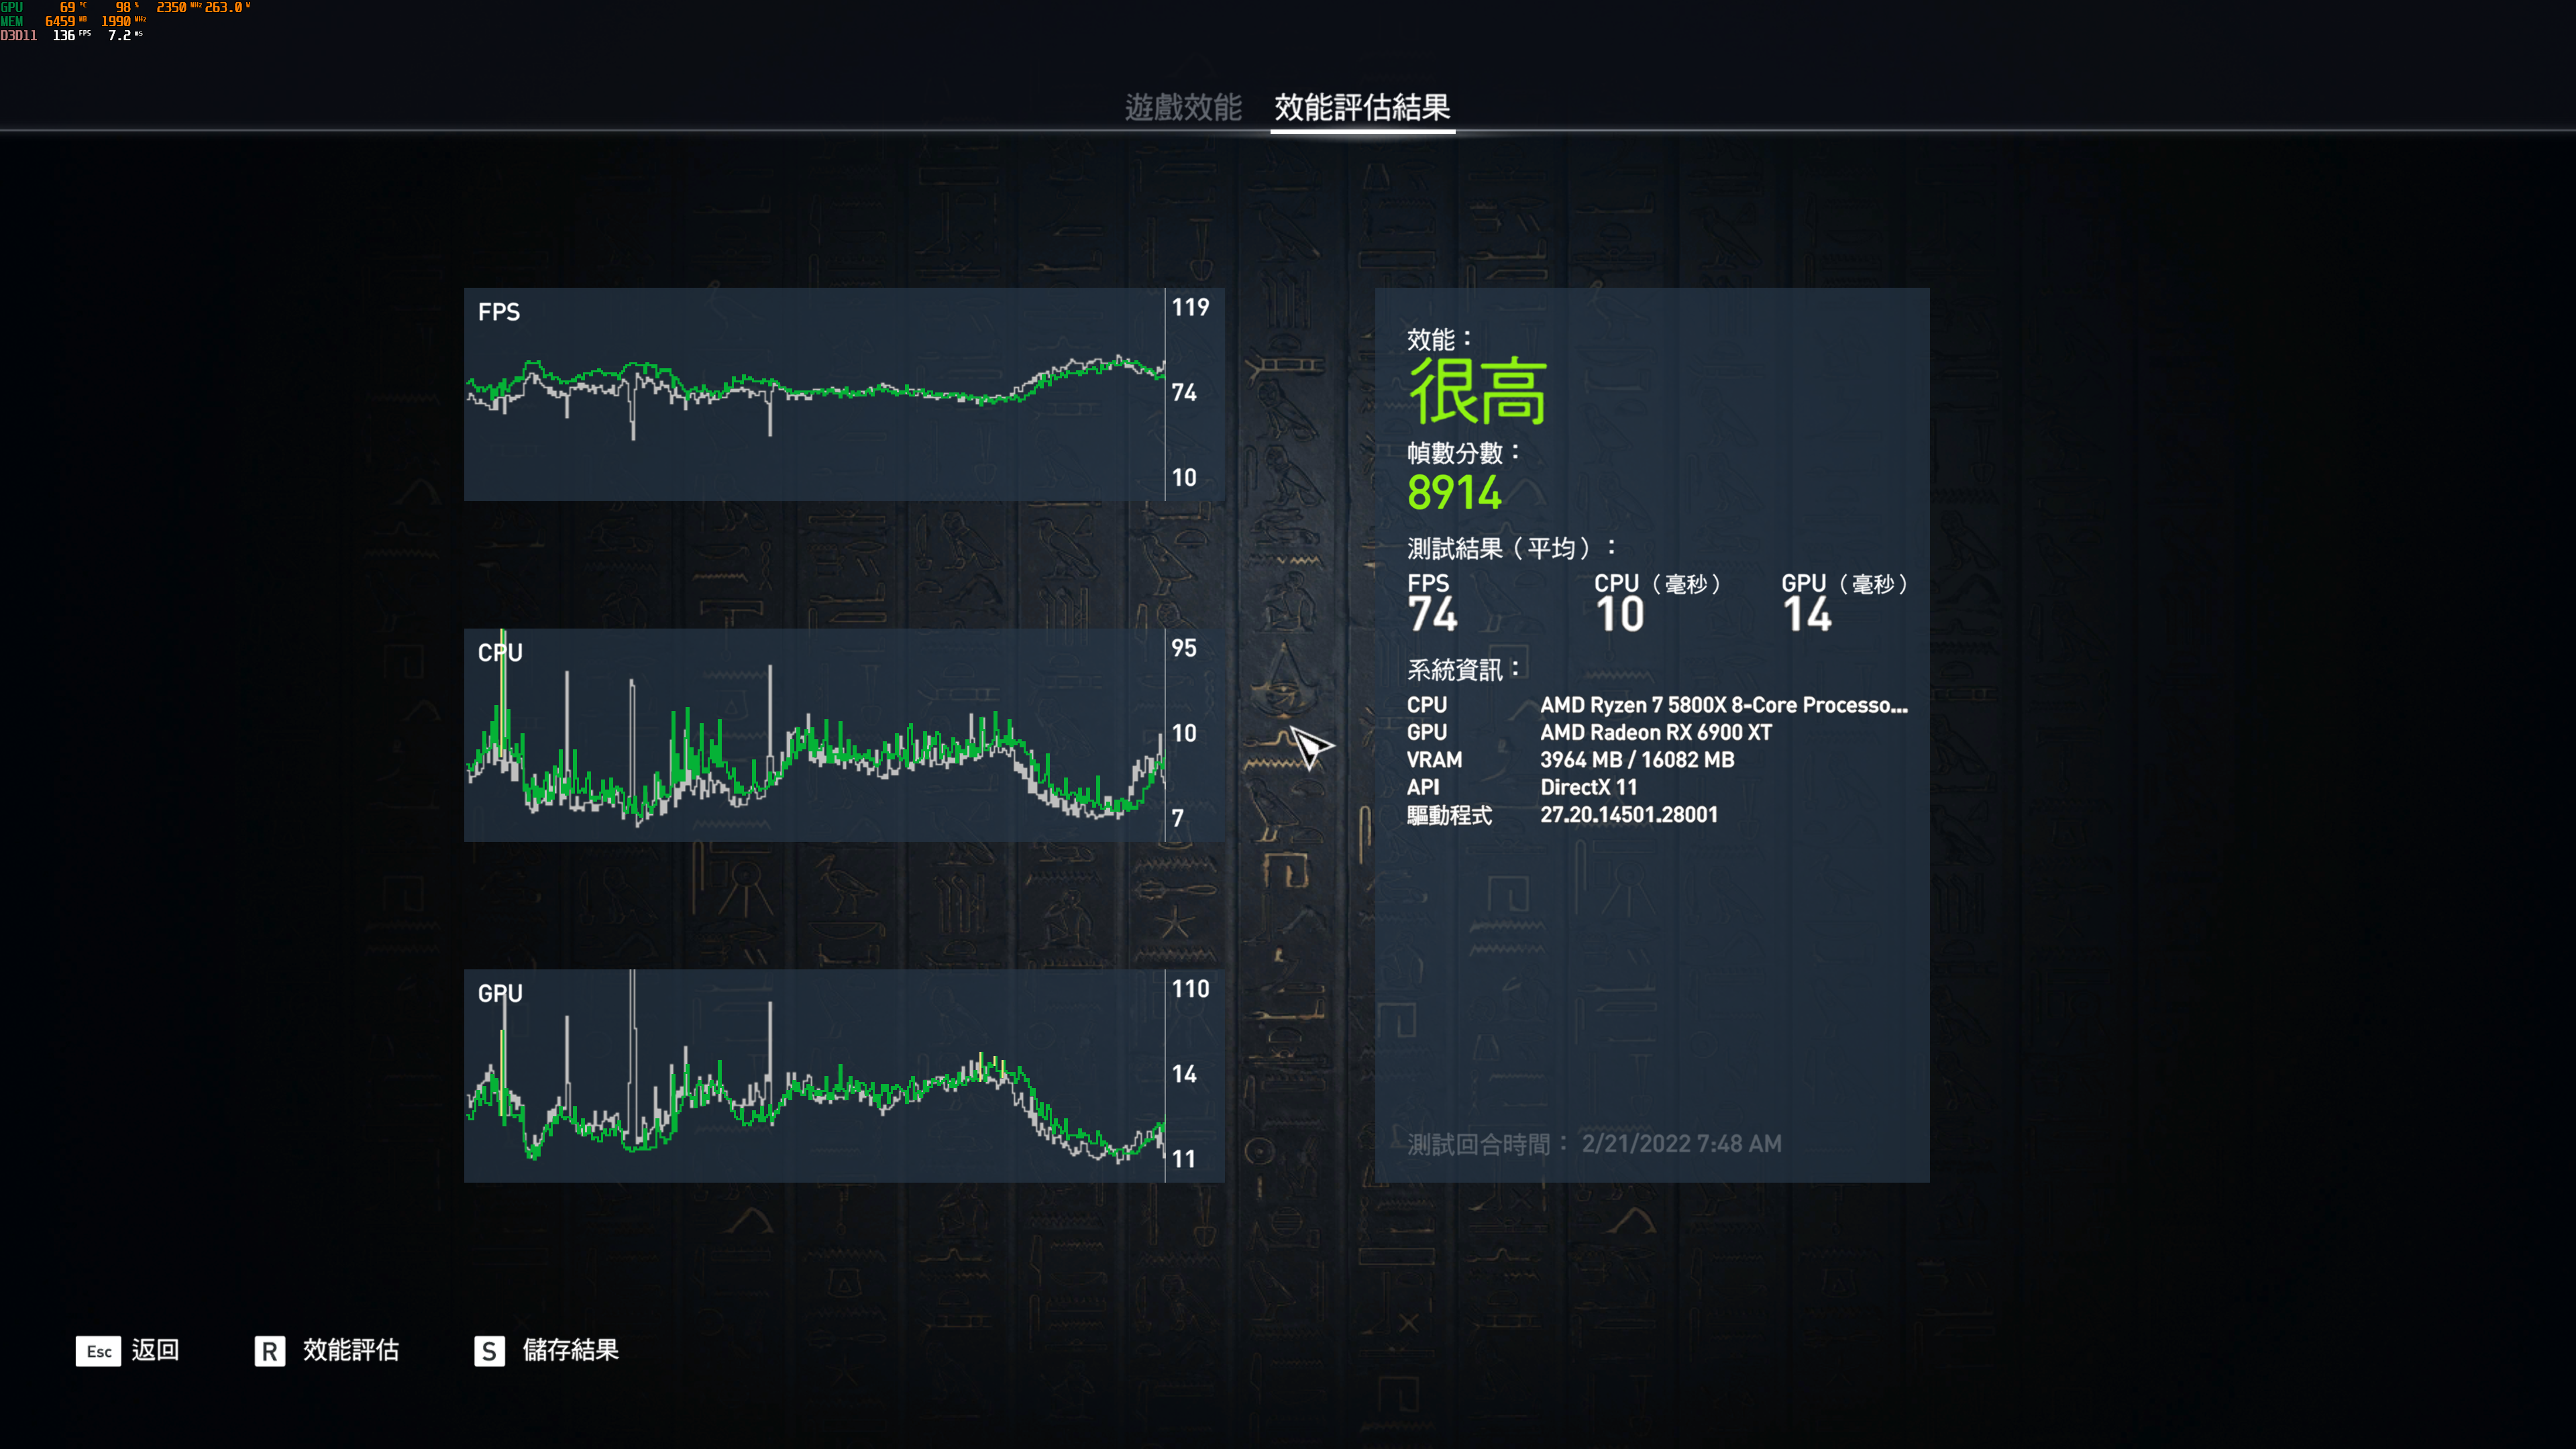
4K Assassin's Creed Origins Benchmark:8914分
Assassin's Creed Origins Benchmark 4K比較表 單位 : Score(數字愈大愈好)

d.UNIGINE Superposition Benchmark
UNIGINE是一款專有的跨平台遊戲引擎,由俄羅斯軟件公司 UNIGINE Corp開發。除了用作遊戲引擎外,它還用於虛擬現實系統,嚴肅遊戲和可視化
UNIGINE最強大的功能是它的高級渲染器,支持 OpenGL 4.0和 DirectX 11,Superposition則為 2017版本,包含極端性能和穩定性測試:視頻卡,電源,冷卻系統,檢查預設和超頻模式與真實負載及在環境中的互動體驗

UNIGINE Superposition Benchmark 1080P Extreme Results
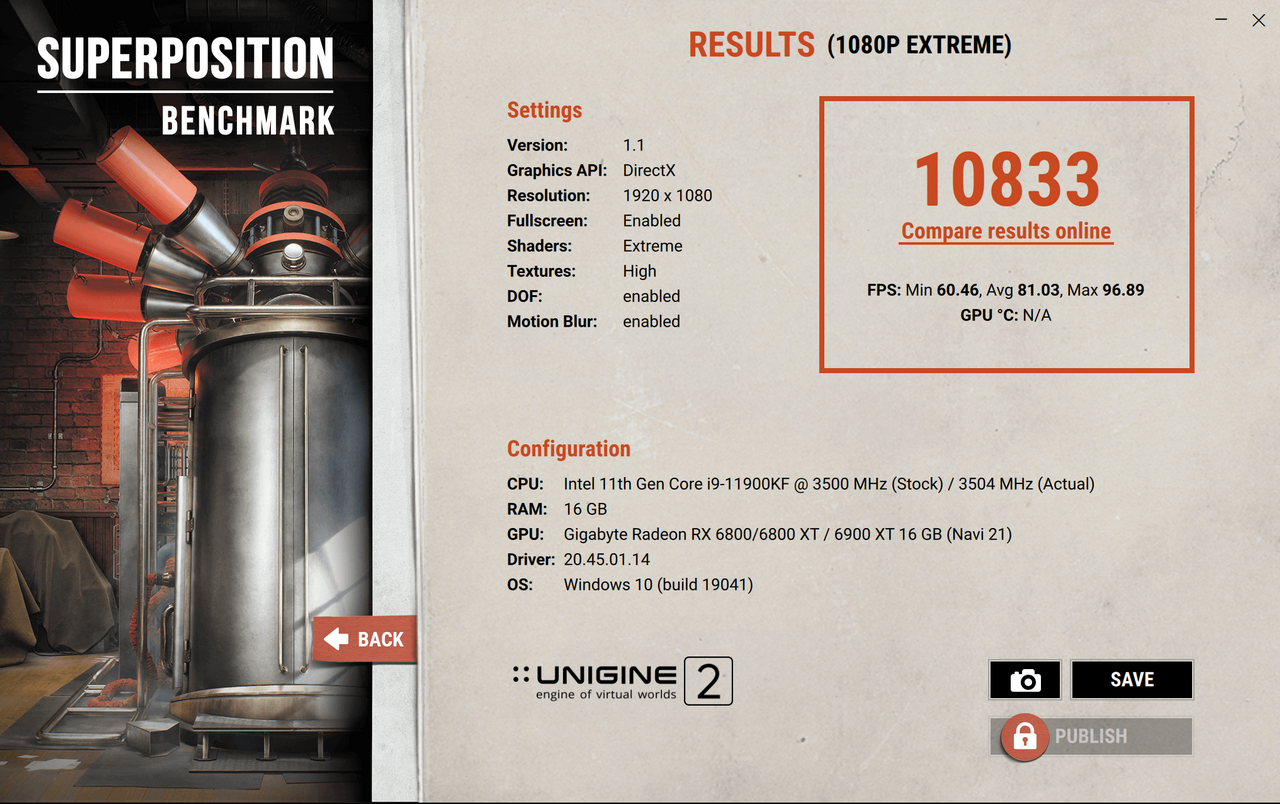
Core i9-11900K@Boost 1080P UNIGINE Superposition Benchmark Extreme:10833分
對照組 Core i9-10900K@Boost 1080P UNIGINE Superposition Benchmark Extreme:10945分

Ryzen 7 5800X@Boost 1080P UNIGINE Superposition Benchmark Extreme:11056分
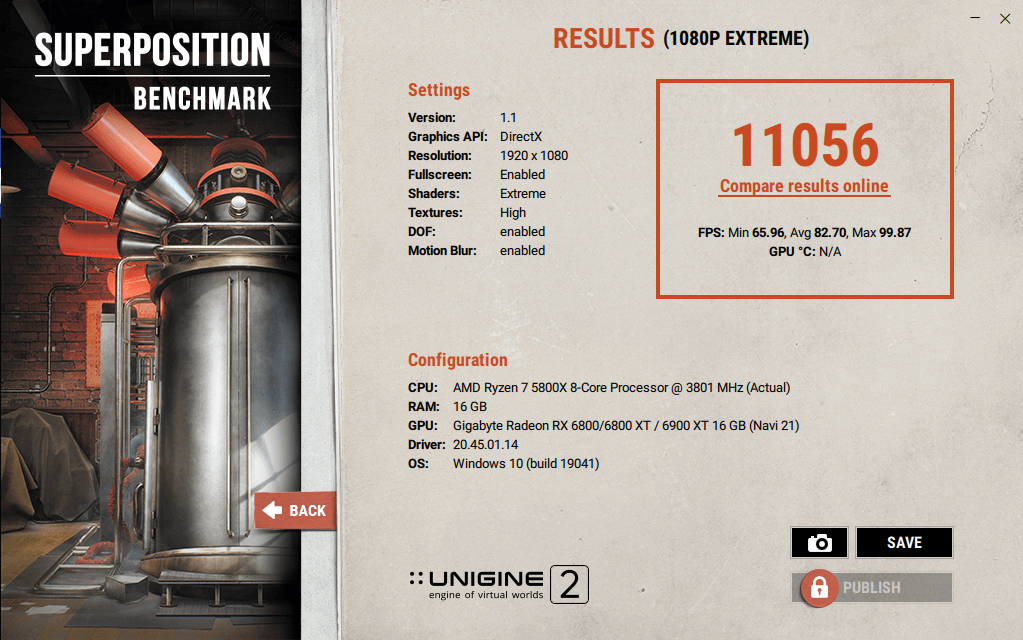
UNIGINE Superposition Benchmark 1080P Extreme比較表 單位 : Score(數字愈大愈好)

UNIGINE Superposition Benchmark 4K Optimazed Results
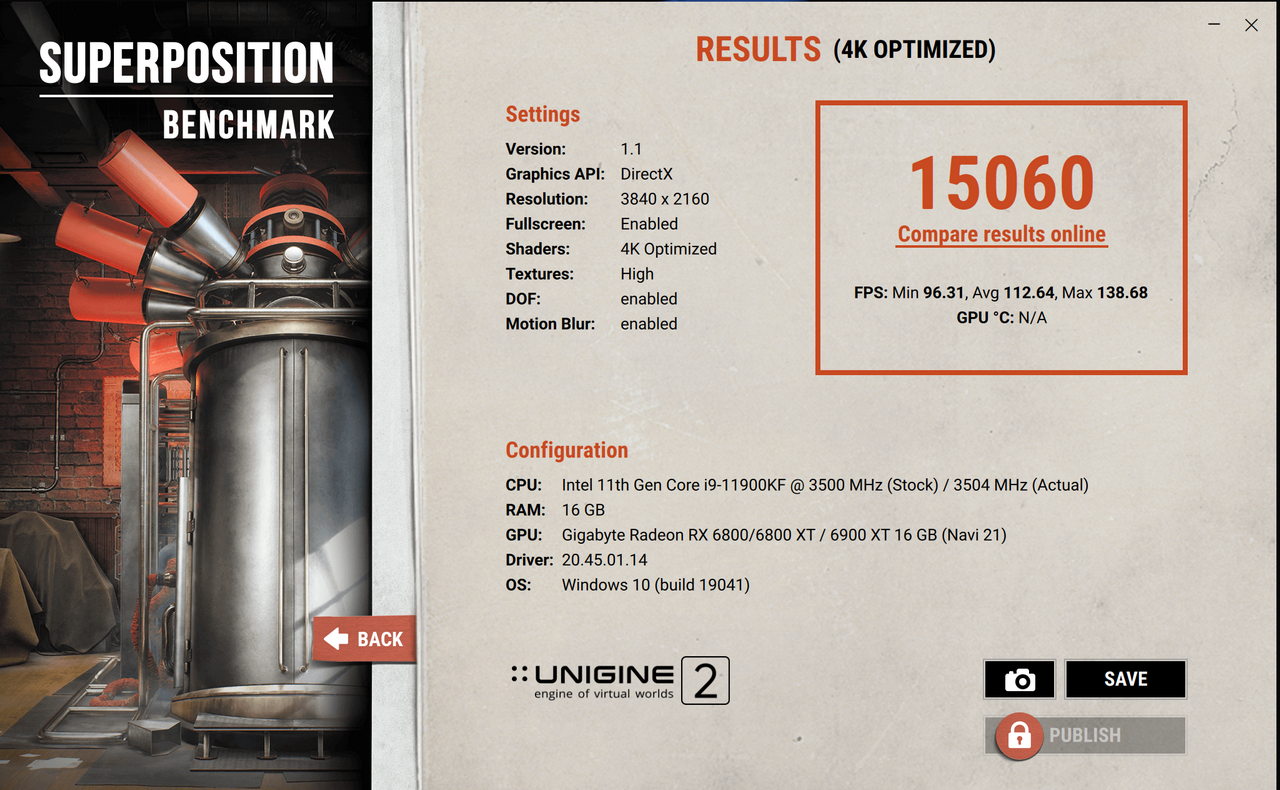
Core i9-11900K@Boost 4K UNIGINE Superposition Benchmark:15060分
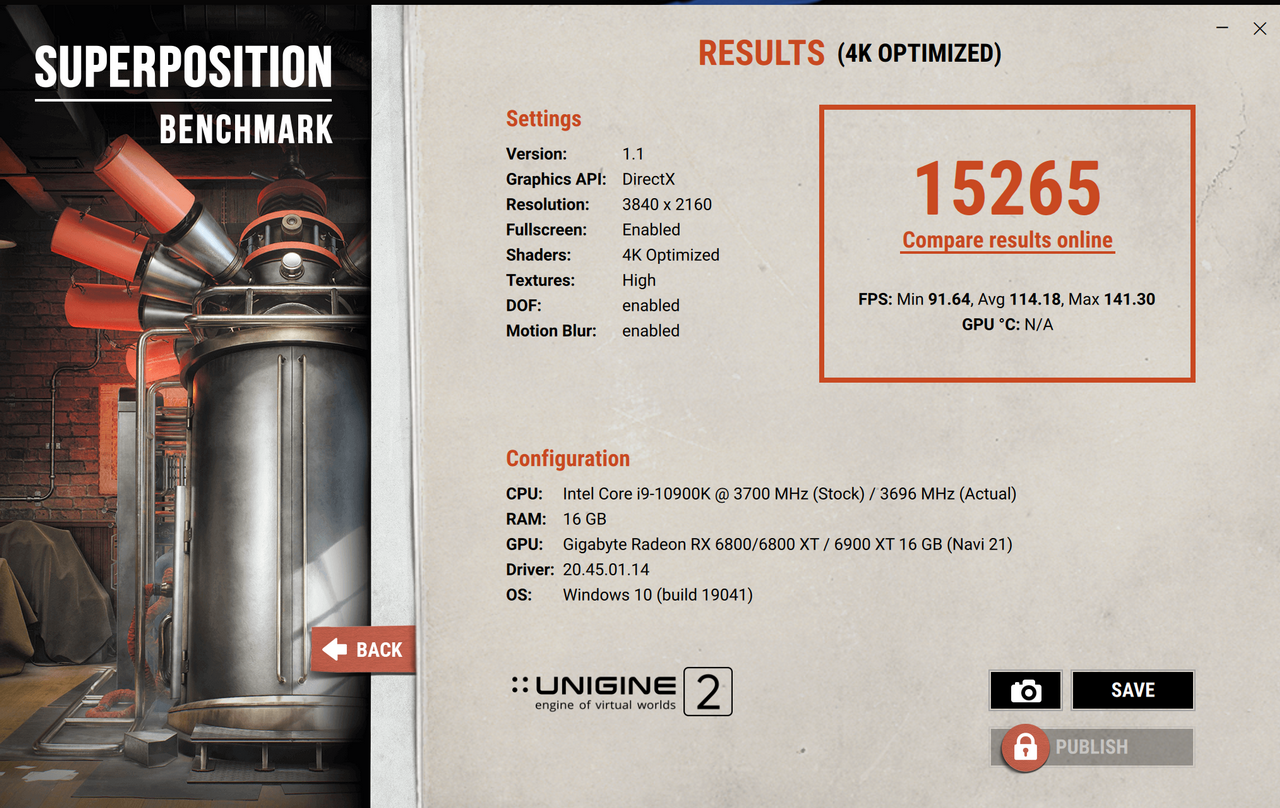
對照組 Core i9-10900K@Boost 4K UNIGINE Superposition Benchmark:15265分
Ryzen 7 5800X@Boost 4K UNIGINE Superposition Benchmark:15455分

UNIGINE Superposition Benchmark 4K Optimazed比較表 單位 : Score(數字愈大愈好)

e.3DMark Time Spy & Extreme
3DMark Time Spy用來測試處理器及顯示卡之 3D圖形表現和工作負載,現由 UL擁有,主要是針對 DirectX 12的效能,測試有三個部分,第一個為顆粒陰影、曲面細分等效果,第二個則是光線追蹤的體積光照明技術,最後則是 CPU效能測試,在前兩個測試中,包含了數千萬個頂點跟多邊形,上百萬個曲面細分,這些都是 FireStrike的幾十倍,而 3DMark Time Spy Extreme是 3DMark Time Spy的 4K版本,所有圖形都是 4K規格

3DMark Time Spy Benchmark Results Core i9-11900K@Boost 3DMark Time Spy:16692分

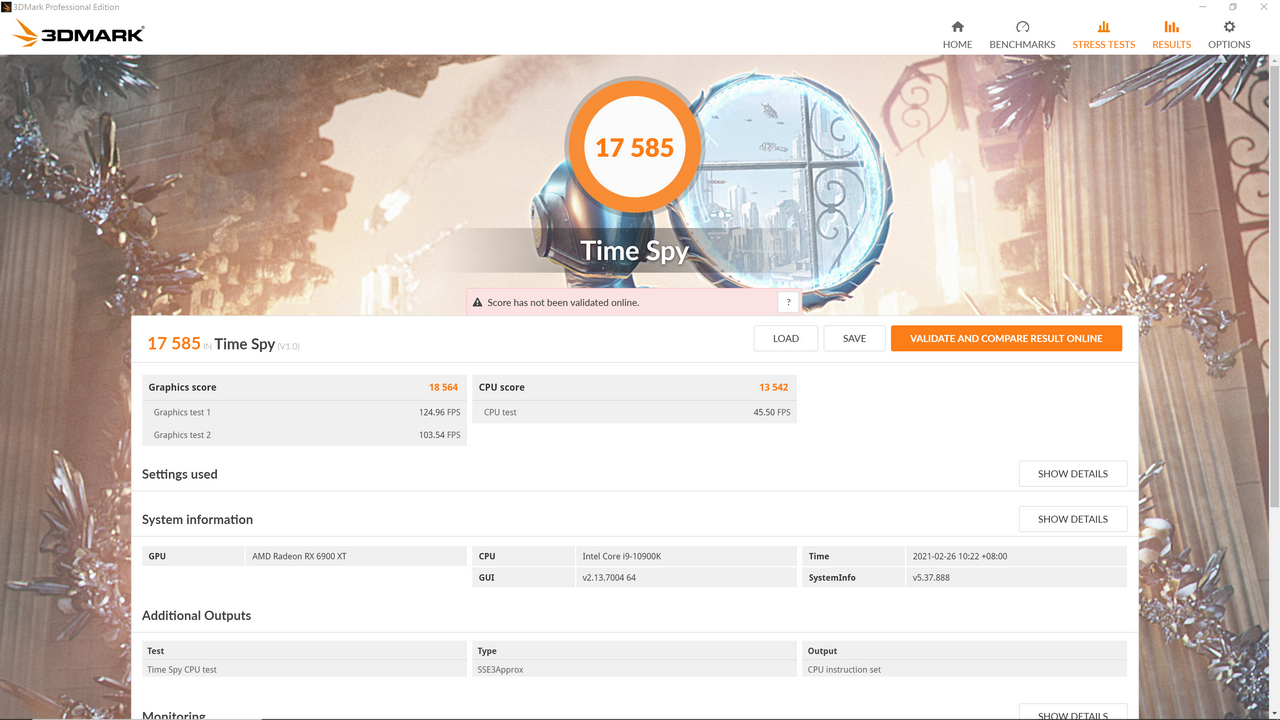
對照組 3DMark Time Spy Benchmark Results Core i9-10900K@Boost 3DMark Time Spy:17585分
Ryzen 7 5800X@Boost 3DMark Time Spy:16900分
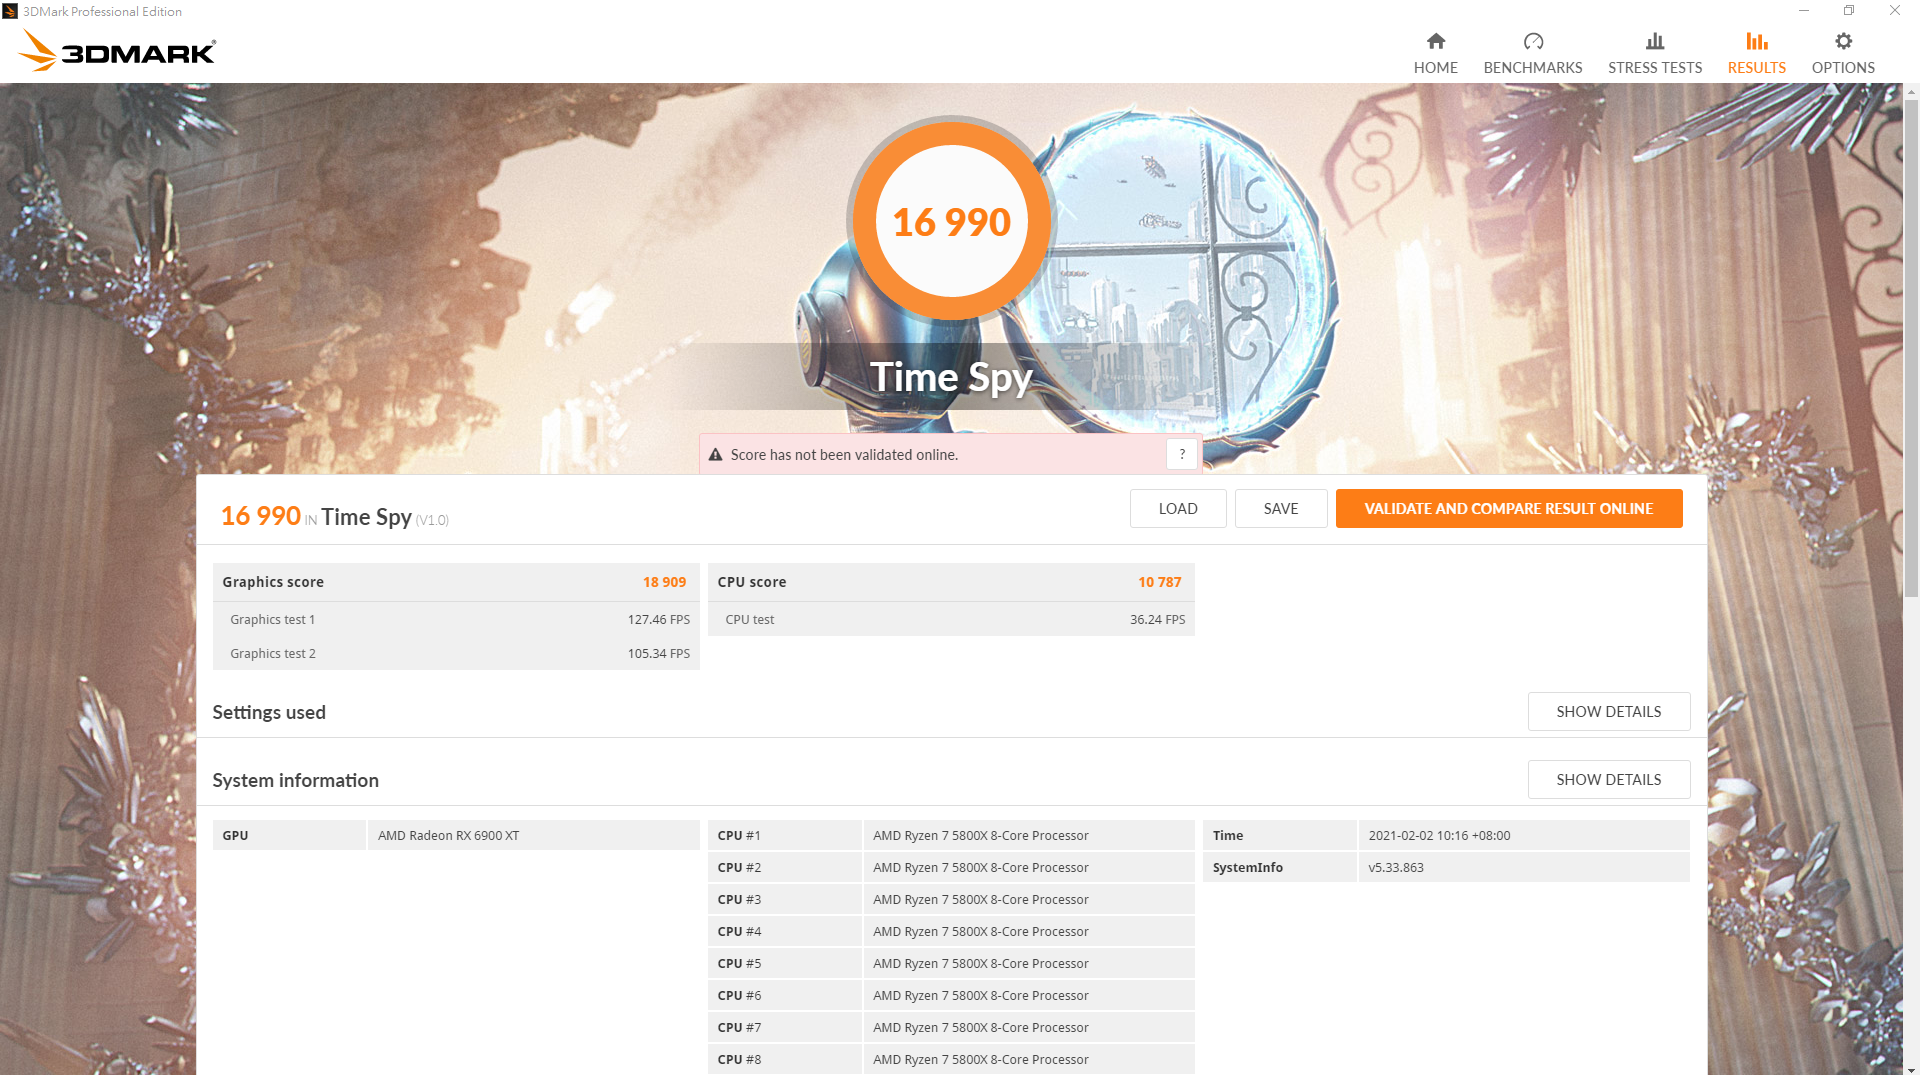
3DMark Time Spy Benchmark CPU Score比較表 單位 : Score(數字愈大愈好)

f.3DMark Time Spy Extreme
3DMark Time Spy Extreme Benchmark Results Core i9-11900K@Boost 3DMark Time Spy Extreme:8196分

對照組 3DMark Time Spy Extreme Benchmark Results Core i9-10900K@Boost 3DMark Time Spy Extreme:8495分
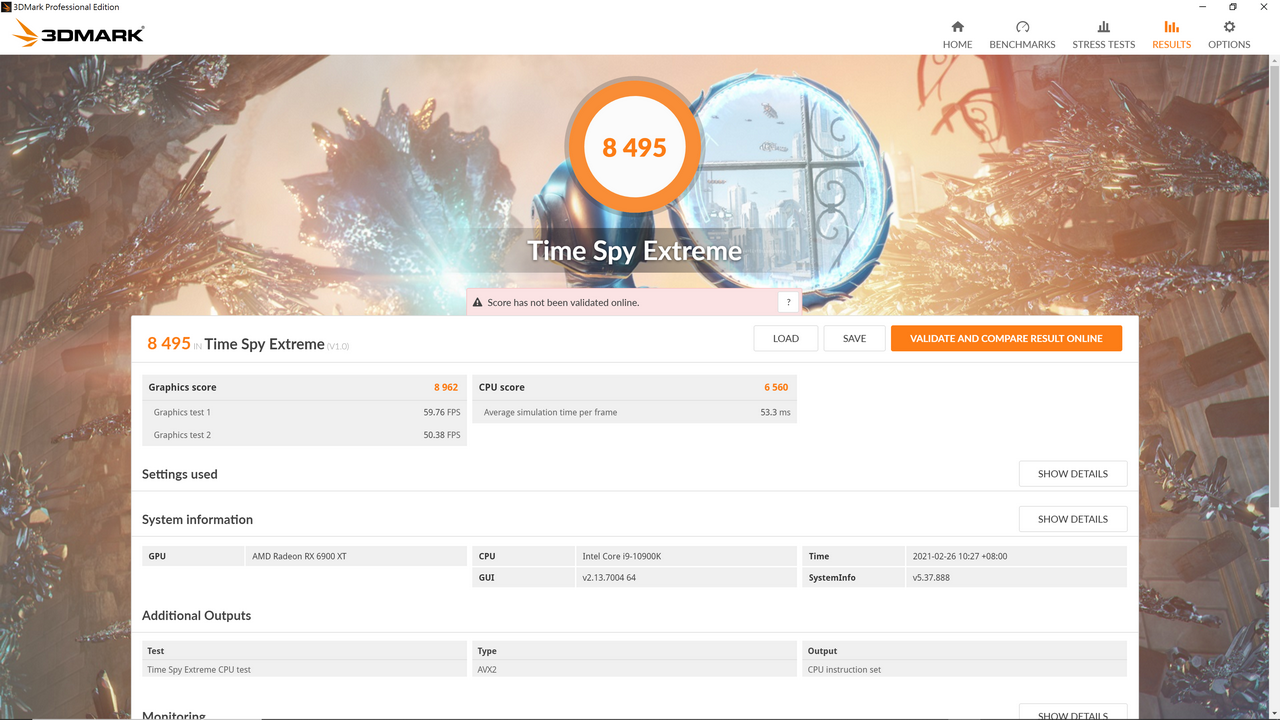
Ryzen 7 5800X@Boost 3DMark Time Spy Extreme:8186分
3DMark Time Spy Extreme Benchmark CPU Score比較表 單位 : Score(數字愈大愈好)

g.Final Fantasy XV Benchmark
Final Fantasy XV《太空戰士 15》的 Benchmark,是一款由史克威爾艾尼克斯在 2016年 11月推出的動作角色扮演遊戲《Final Fantasy系列》的第 15部,依照傳統,太空戰士都有 Benchmark的項目

Final Fantasy XV Benchmark 1080P Results Core i9-11900K@Boost 1080P Final Fantasy XV Benchmark:15271分
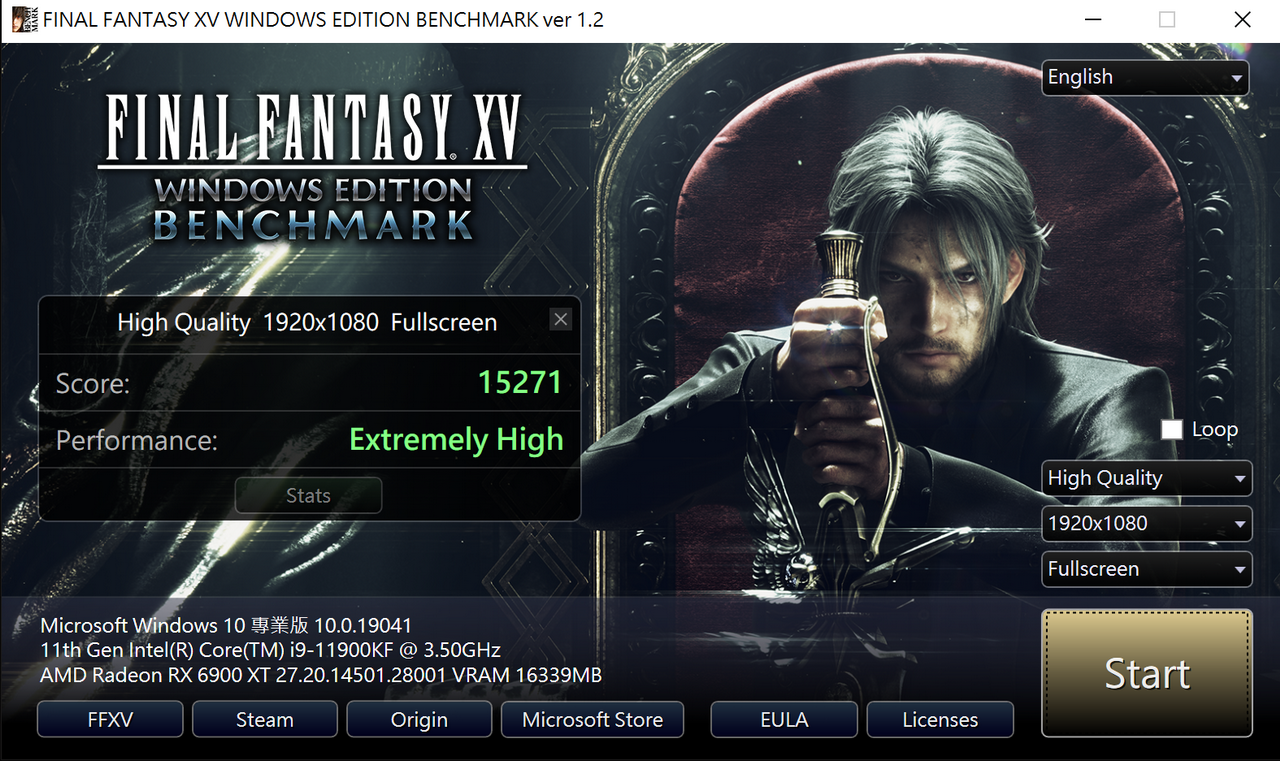
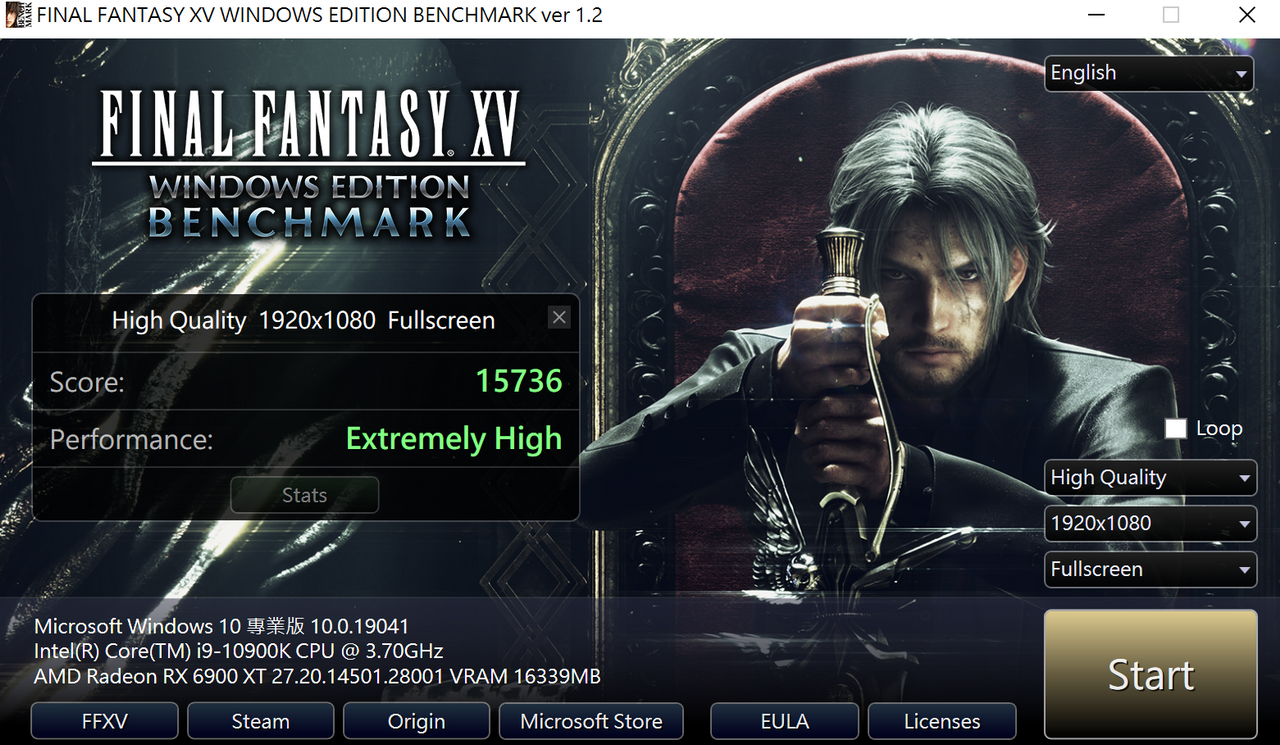
對照組 Final Fantasy XV Benchmark 1080P Results Core i9-10900K@Boost 1080P Final Fantasy XV Benchmark:15736分
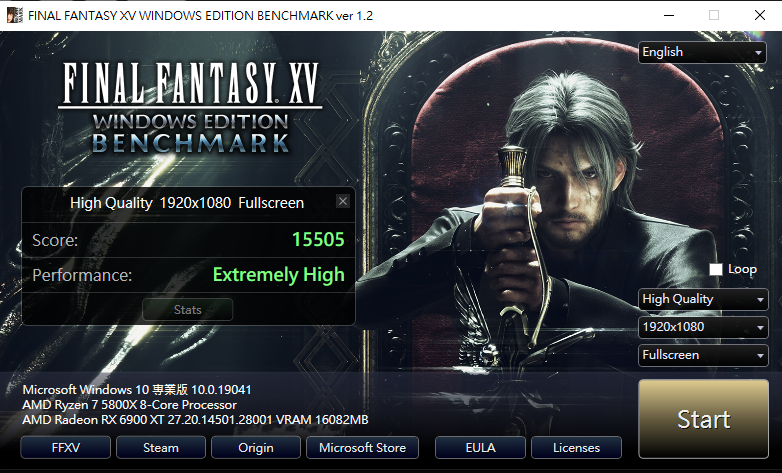
Ryzen 7 5800X@Boost 1080P Final Fantasy XV Benchmark:15505分
Final Fantasy XV Benchmark 1080P比較表 單位 : Score(數字愈大愈好)

Final Fantasy XV Benchmark 4K Results
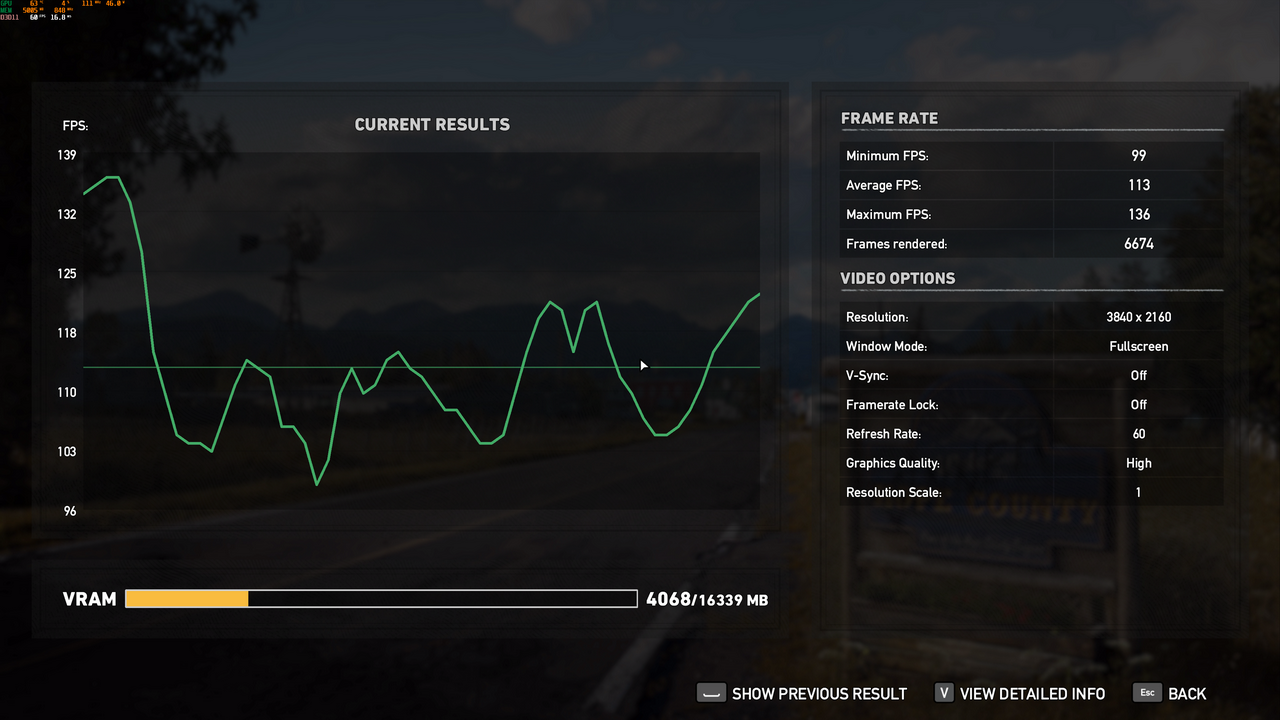
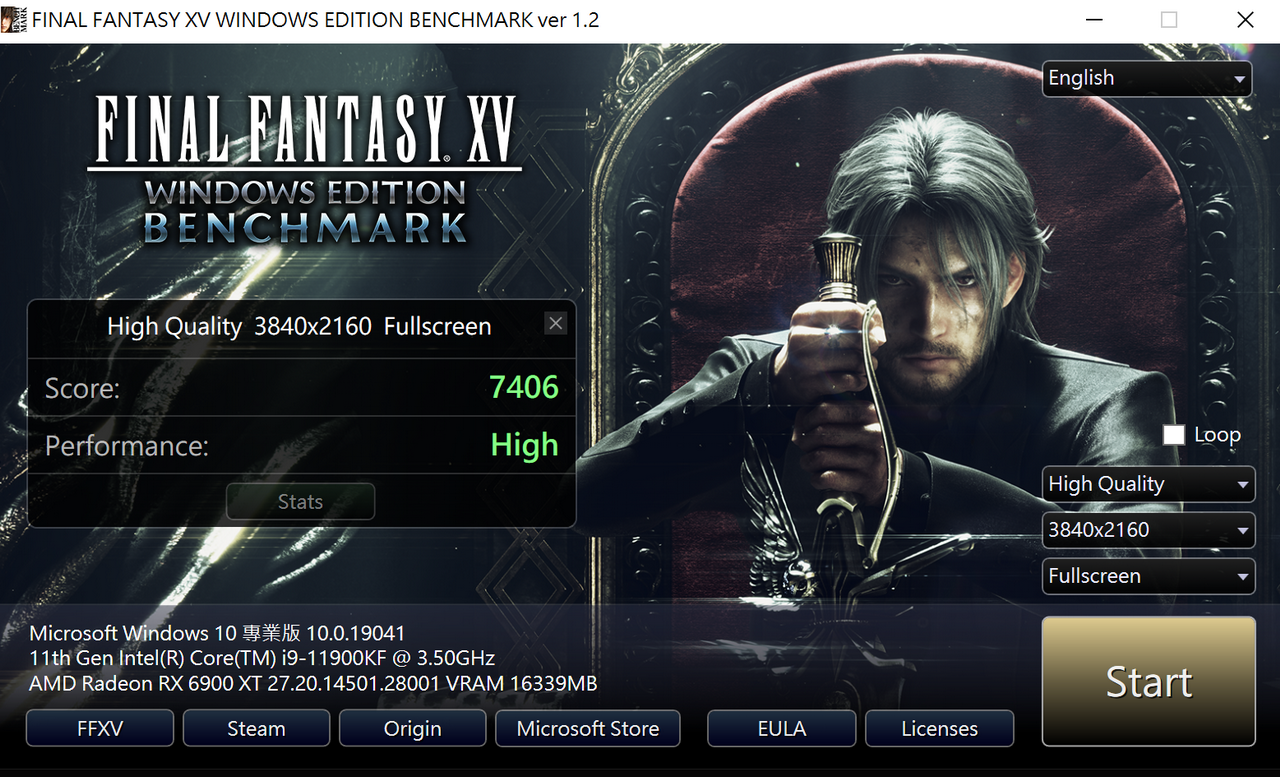
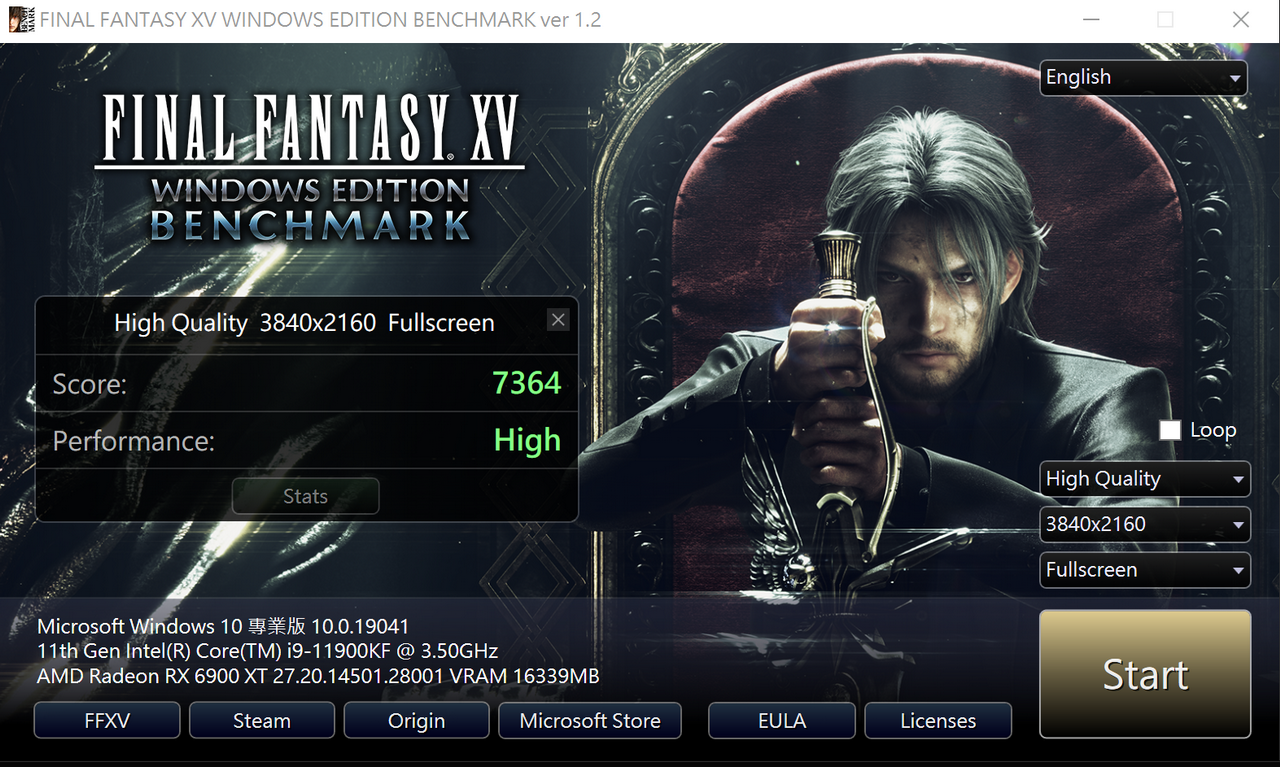
Core i9-11900K@Boost 4K Final Fantasy XV Benchmark:7406分
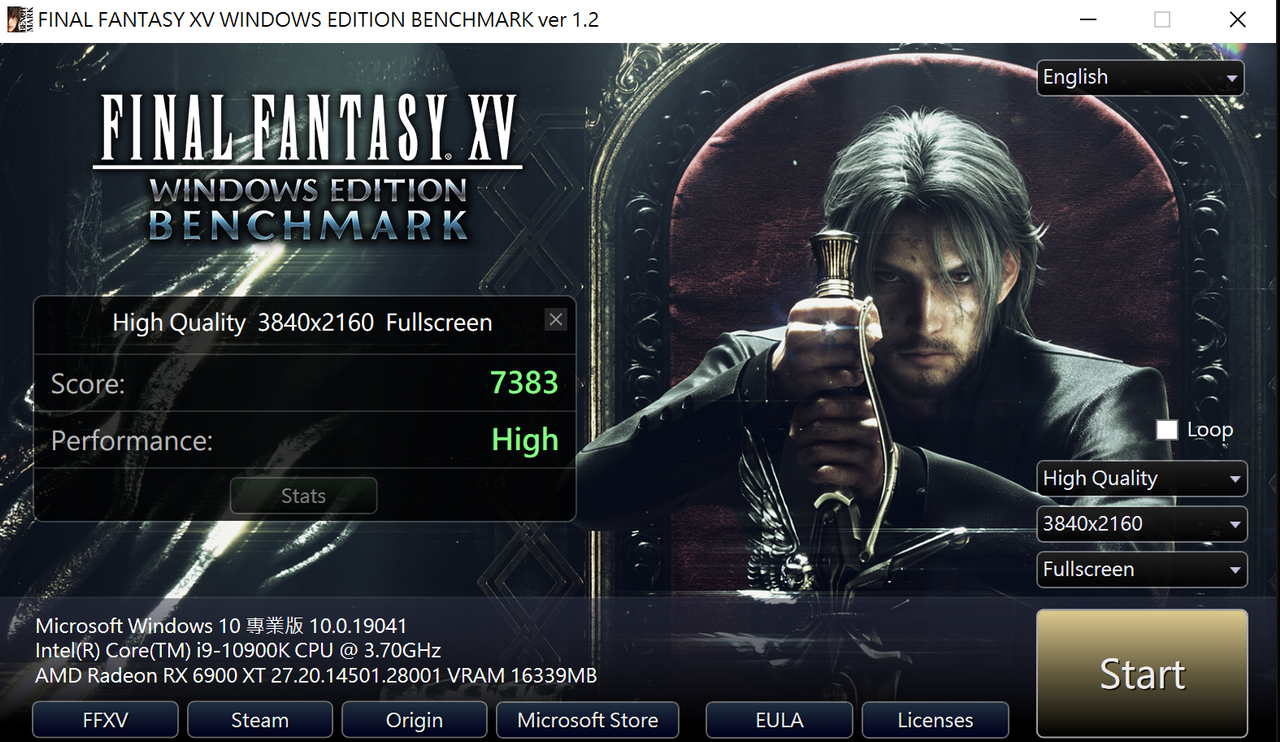
對照組 Core i9-10900K@Boost 4K Final Fantasy XV Benchmark:7383分
Ryzen 7 5800X@Boost 4K Final Fantasy XV Benchmark:7355分

Final Fantasy XV Benchmark 4K比較表 單位 : Score(數字愈大愈好)

h.Middle-earth: Shadow of War Benchmark《中土世界:戰爭之影》
Middle-earth: Shadow of War《中土世界:戰爭之影》亦為一自帶 Benchmark的角色扮演遊戲,是由 Monolith Productions開發並由華納兄弟互動娛樂發行並於 2017年 10月 10日在全球發布
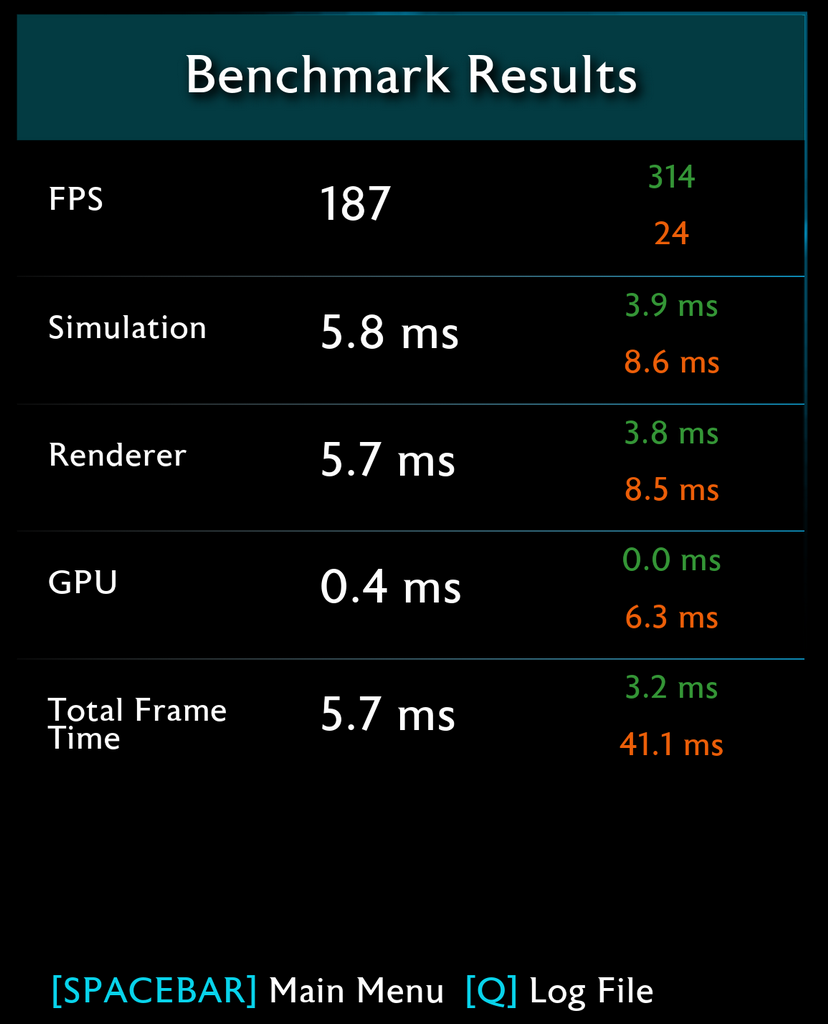
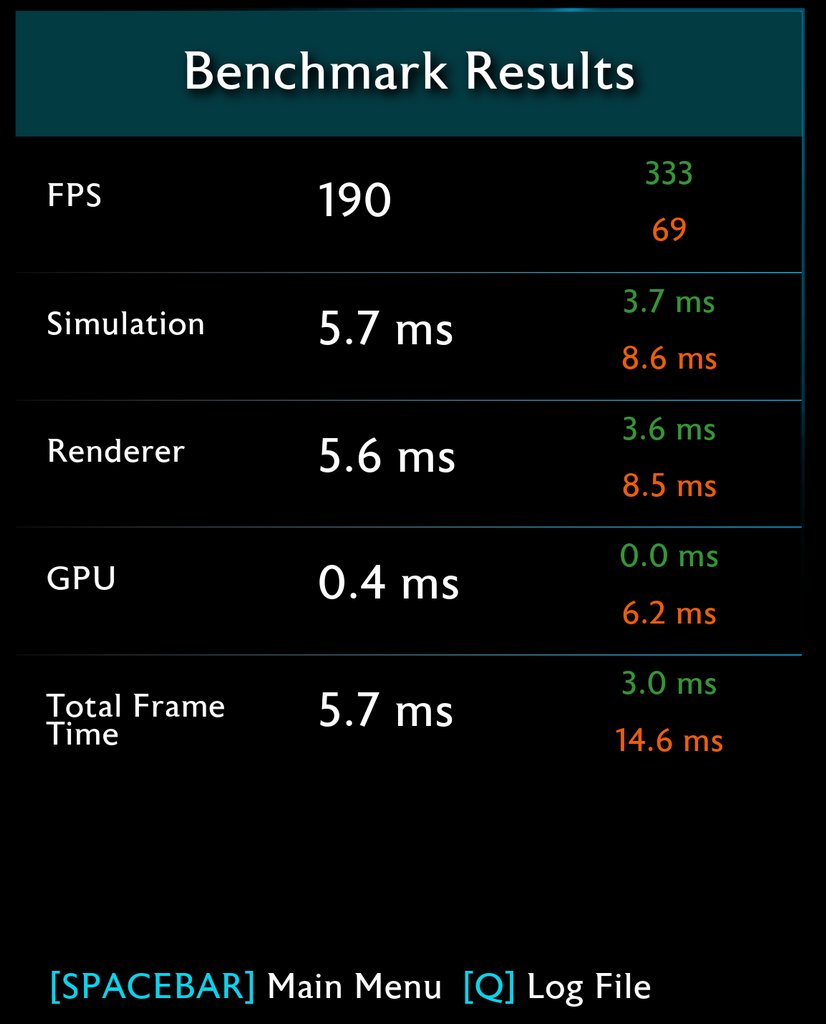
Middle-earth: Shadow of War Benchmark 1080P Results Core i9-11900K@Boost 1080P Middle-earth: Shadow of War Benchmark:187fps
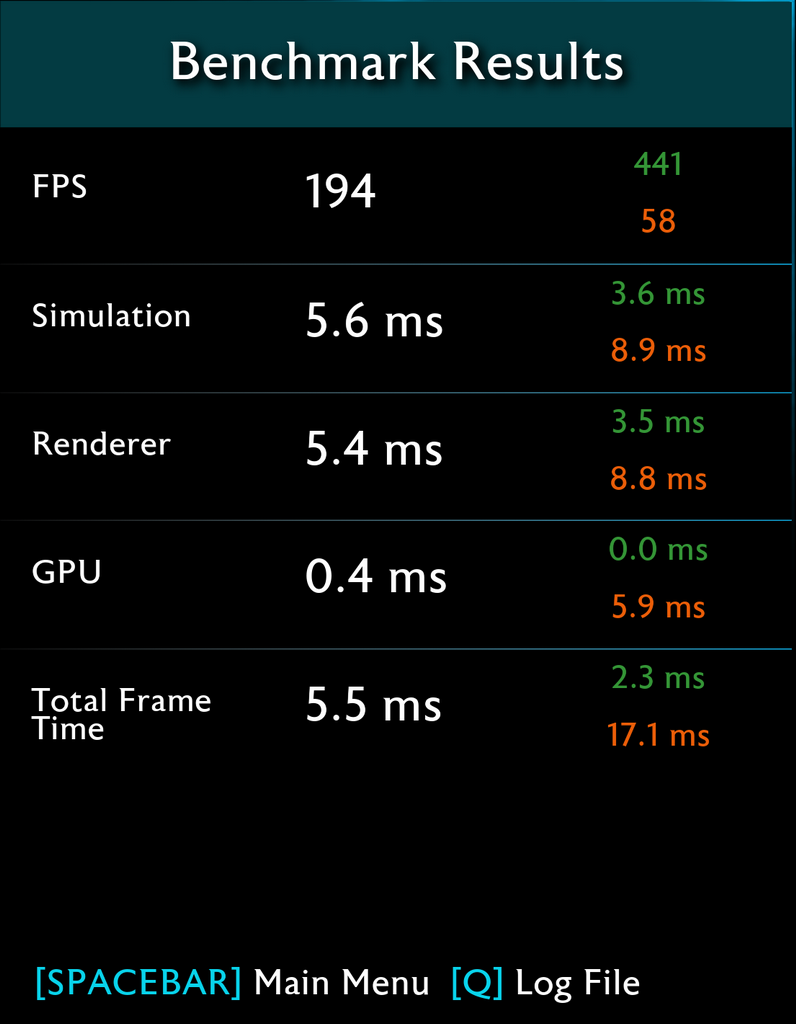
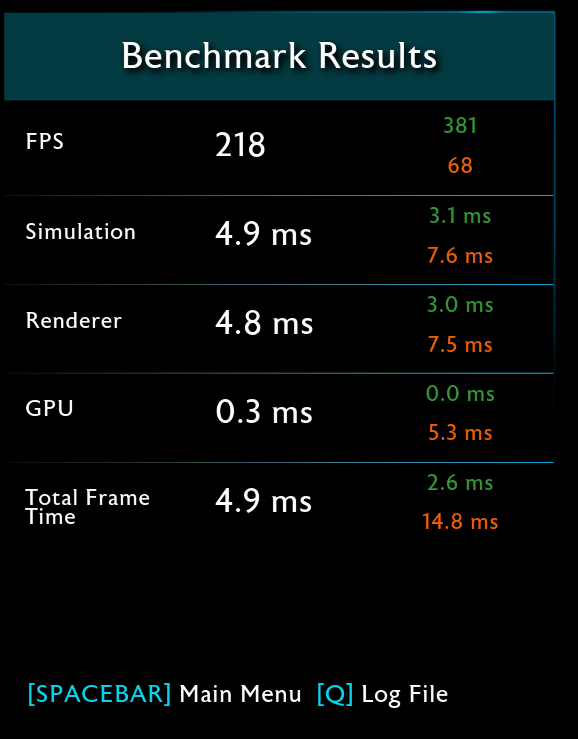
對照組 Middle-earth: Shadow of War Benchmark 1080P Results Core i9-10900K@Boost 1080P Middle-earth: Shadow of War Benchmark:194fps
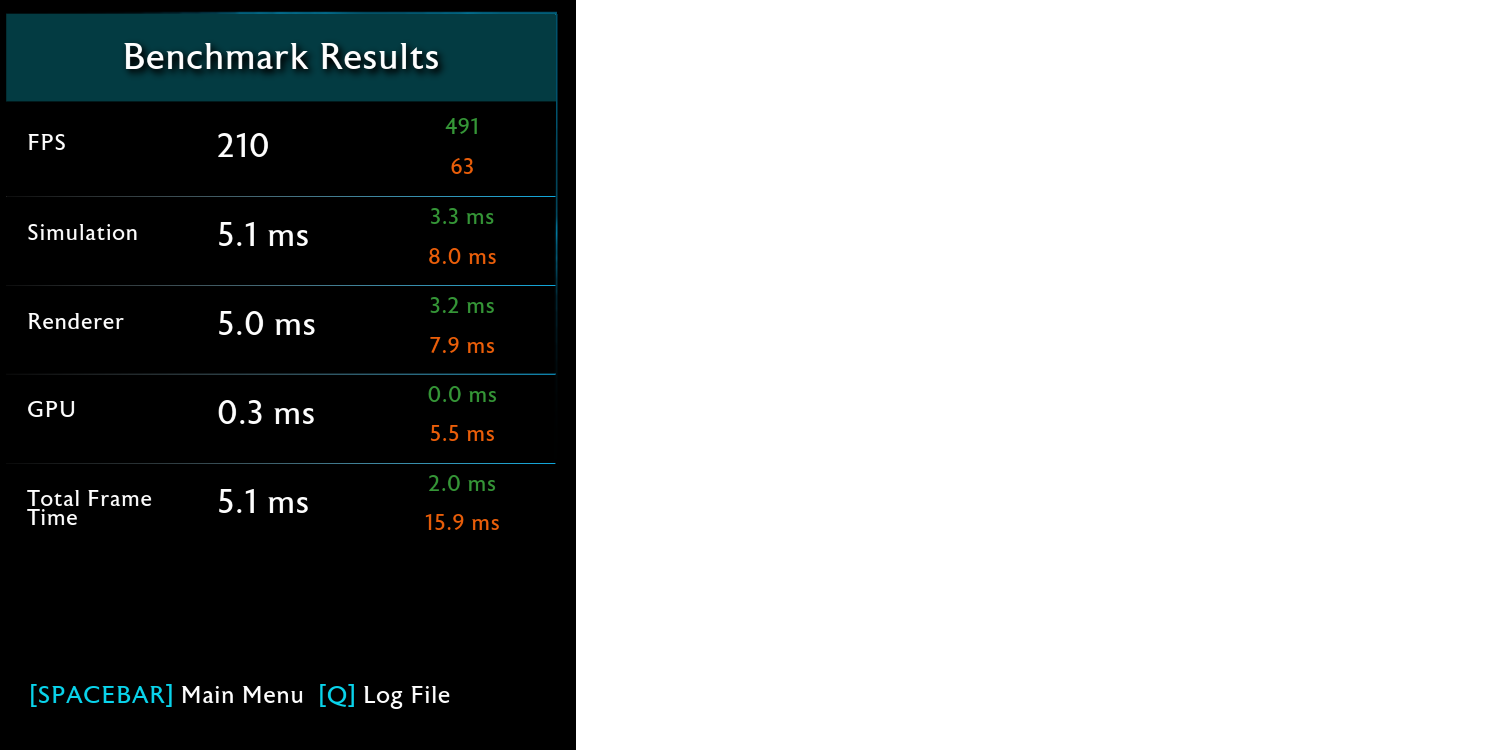
Ryzen 7 5800X@Boost 1080P Middle-earth: Shadow of War Benchmark:210fps
Middle-earth: Shadow of War Benchmark 1080P比較表 單位 : Score(數字愈大愈好)

Middle-earth: Shadow of War Benchmark 4K Results
Core i9-11900K@Boost 4K Middle-earth: Shadow of War Benchmark:98fps
對照組 Core i9-10900K@Boost 4K Middle-earth: Shadow of War Benchmark:103fps
Ryzen 7 5800X@Boost 4K Middle-earth: Shadow of War Benchmark:105fps
Middle-earth: Shadow of War Benchmark 1080P比較表 單位 : Score(數字愈大愈好)

B.Overclocking All Core 5.2GHz
1.Gaming Benchmark
測試諸元:
Core i9-11900K@All Core 5.2GHz
對照組
Ryzen 7 5800X@All Core 4.725GHz
Ryzen 5 5600X@All Core 4.7GHz
a.Far Cry 5 Benchmark
Far Cry 5 Benchmark《極地戰嚎5》
Far Cry 5《極地戰嚎5》是一個自帶 Benchmark的新遊戲,是由育碧蒙特婁、育碧多倫多開發和育碧軟體發行的開放世界第一人稱動作冒險遊戲
1080P Far Cry 5 Benchmark Ave Results
Core i9-11900K@All Core 5.2GHz 1080P Far Cry 5 1080P Benchmark Ave 168fps

對照組 Core i9-10900K@All Core 5GHz 1080P Far Cry 5 1080P Benchmark Ave 165fps


Ryzen 7 5800X@All Core 4.725GHz
1080P Far Cry 5 1080P Benchmark Ave 156fps
Far Cry 5 1080P比較表 單位 : fps(數字愈大愈好)

Far Cry 5 Benchmark 4K Ave Results
Core i9-11900K@All Core 5.2GHz 4K Far Cry 5 Benchmark Ave 112ps
對照組 Core i9-10900K@All Core 5GHz 4K Far Cry 5 Benchmark Ave 113ps

Ryzen 7 5800X@All Core 4.725GHz
4K Far Cry 5 Benchmark Ave 114ps
Far Cry 5 4K比較表 單位 : fps(數字愈大愈好)

b.Rise of the Tomb Raider Benchmark
Rise of the Tomb Raider Benchmark《古墓奇兵:崛起》
Rise of the Tomb Raider《古墓奇兵:崛起》,是一款由晶體動力開發,微軟工作室和史克威爾艾尼克斯合作發行的動作冒險遊戲,同樣自帶測試軟體,本作是 2013年《古墓奇兵》的續作
Rise of the Tomb Raider Benchmark 1080P Overall fps Results
Core i9-11900K@All Core 5.2GHz 1080P Rise of the Tomb Raider Benchmark Overall:237.57fps
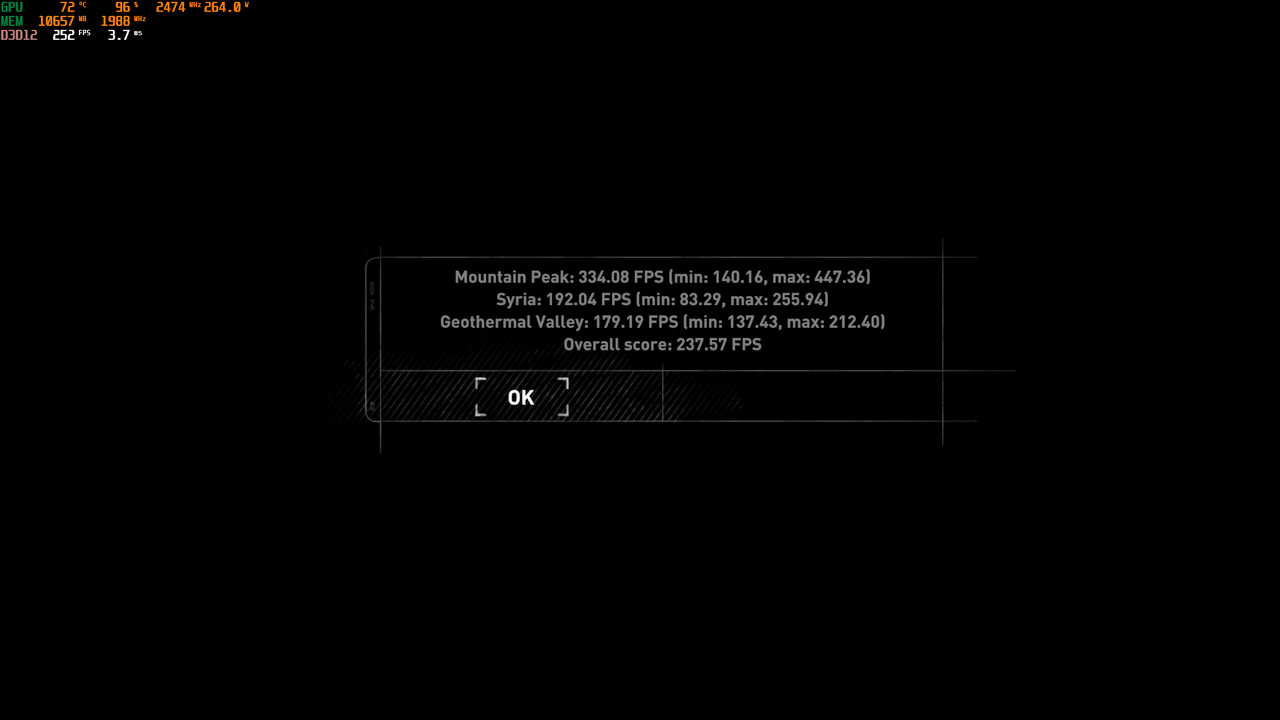
對照組 Core i9-10900K@All Core 5GHz 1080P Rise of the Tomb Raider Benchmark Overall:247.32fps

Ryzen 7 5800X@All Core 4.725GHz
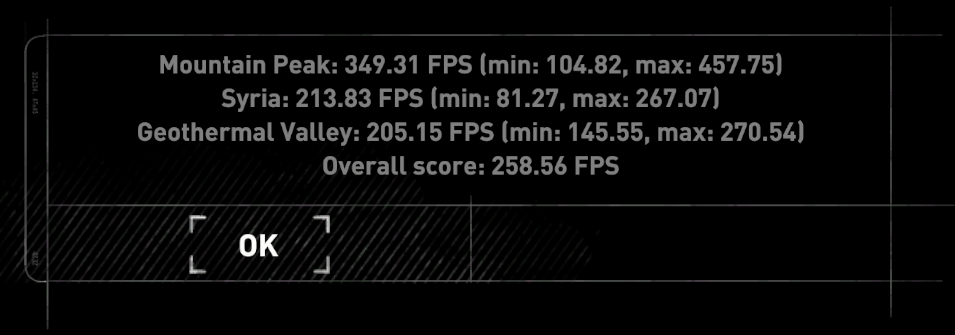
1080P Rise of the Tomb Raider Benchmark Overall:258.56fps
Rise of the Tomb Raider Benchmark 1080P比較表 單位 : fps(數字愈大愈好)

Rise of the Tomb Raider Benchmark 4K Overall fps Results
Core i9-11900K@All Core 5.2GHz 4K Rise of the Tomb Raider Benchmark Overall:110.33fps
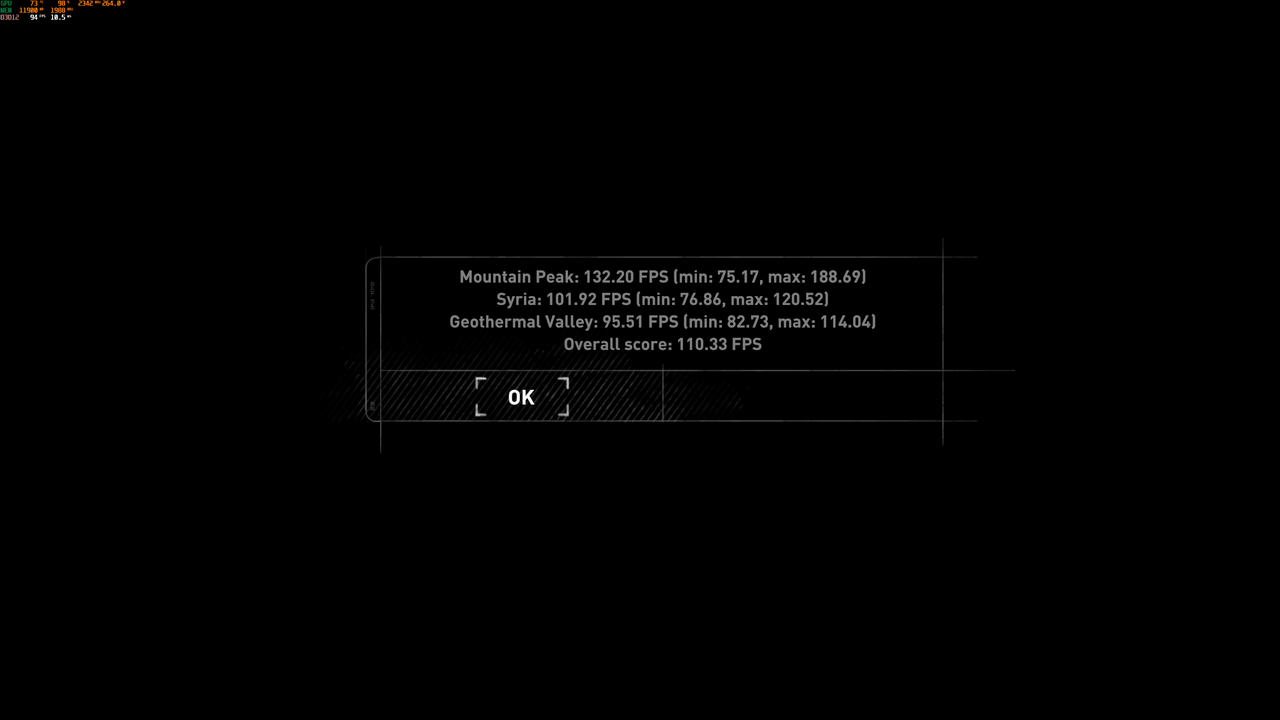
對照組 Core i9-10900K@All Core 5GHz 4K Rise of the Tomb Raider Benchmark Overall:113.04fps

Ryzen 7 5800X@All Core 4.725GHz
4K Rise of the Tomb Raider Benchmark Overall:112.17fps

Rise of the Tomb Raider Benchmark 4K比較表 單位 : fps (數字愈大愈好)

c.Assassin's Creed Origins Benchmark
Assassin's Creed Origins《刺客教條:起源》中國大陸譯作「刺客信條:起源」)是一部由育碧蒙特婁開發由育碧公司發行的動作冒險遊戲
本作是刺客教條主系列的第十部作品,也是系列首次把時間線推前到刺客教條初代以前,同樣也自帶有測試軟體,遊戲的舞台是在托勒密王朝埃及豔后統治下的埃及,玩家所操控的角色是一位隸屬於法老的護衛,稱為守護者(Medjai),來自錫瓦(Siwa)名為巴耶克(Bayek)的埃及刺客
Assassin's Creed Origins Benchmark 1080P Results
Core i9-11900K@All Core 5.2GHz1080P Assassin's Creed Origins Benchmark :11029分
對照組 Core i9-10900K@All Core 5GHz1080P Assassin's Creed Origins Benchmark :10733分

Ryzen 7 5800X@All Core 4.725GHz
1080P Assassin's Creed Origins Benchmark :10127分
Assassin's Creed Origins Benchmark 1080P比較表 單位 : Score(數字愈大愈好)

Assassin's Creed Origins Benchmark 4K Results
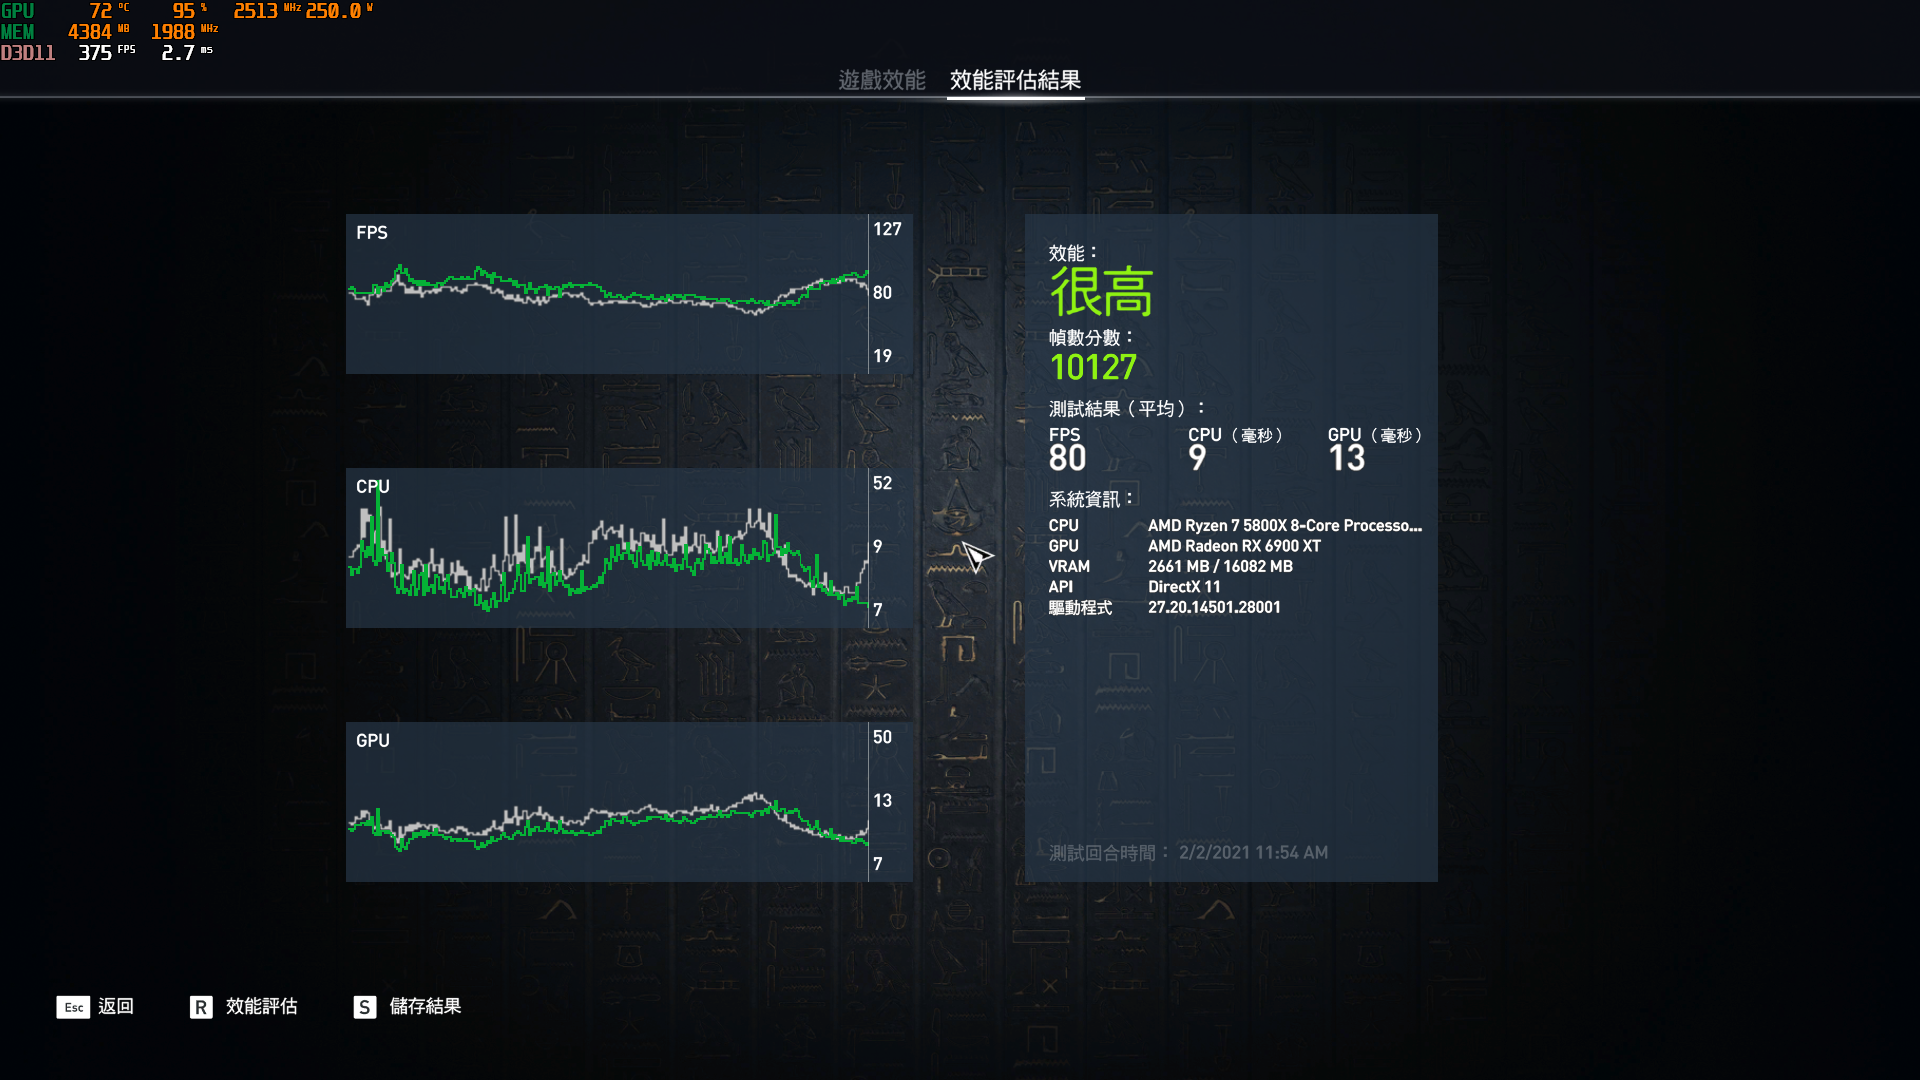
Core i9-11900K@All Core 5.2GHz 4K Assassin's Creed Origins Benchmark:9809分
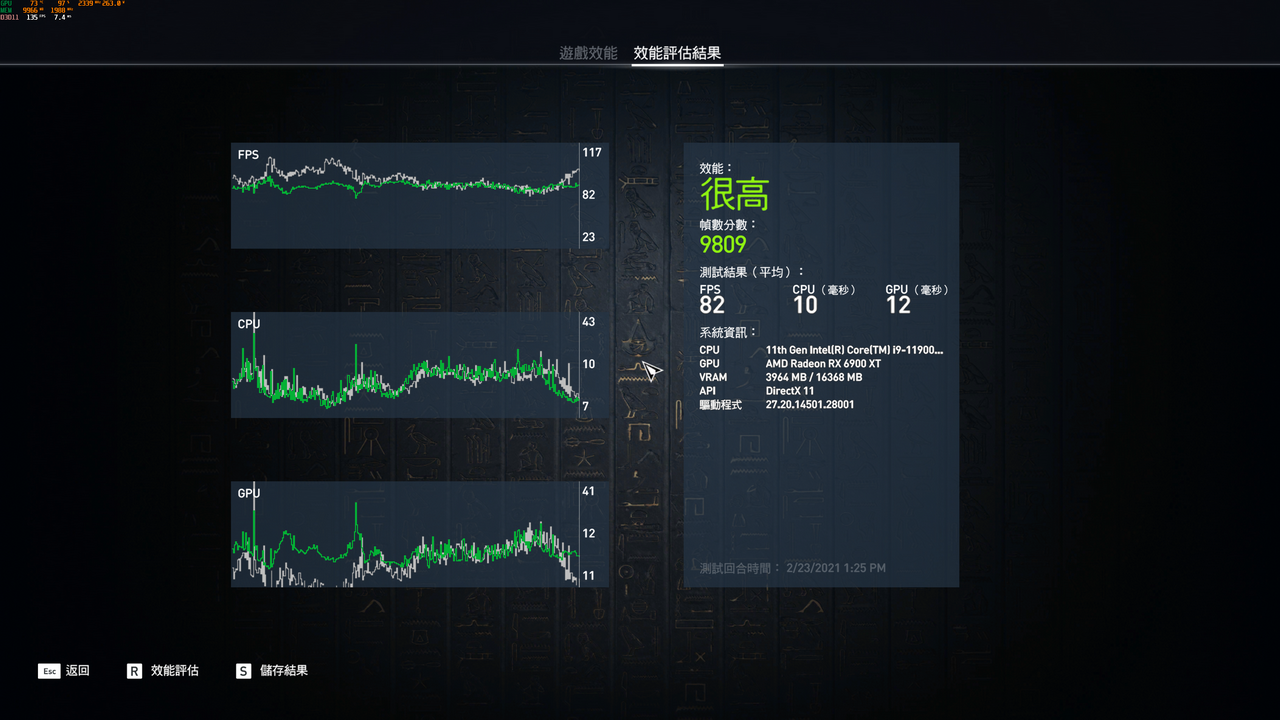
對照組 Core i9-10900K@All Core 5GHz 4K Assassin's Creed Origins Benchmark:9693分

Ryzen 7 5800X@All Core 4.725GHz
4K Assassin's Creed Origins Benchmark:9449分
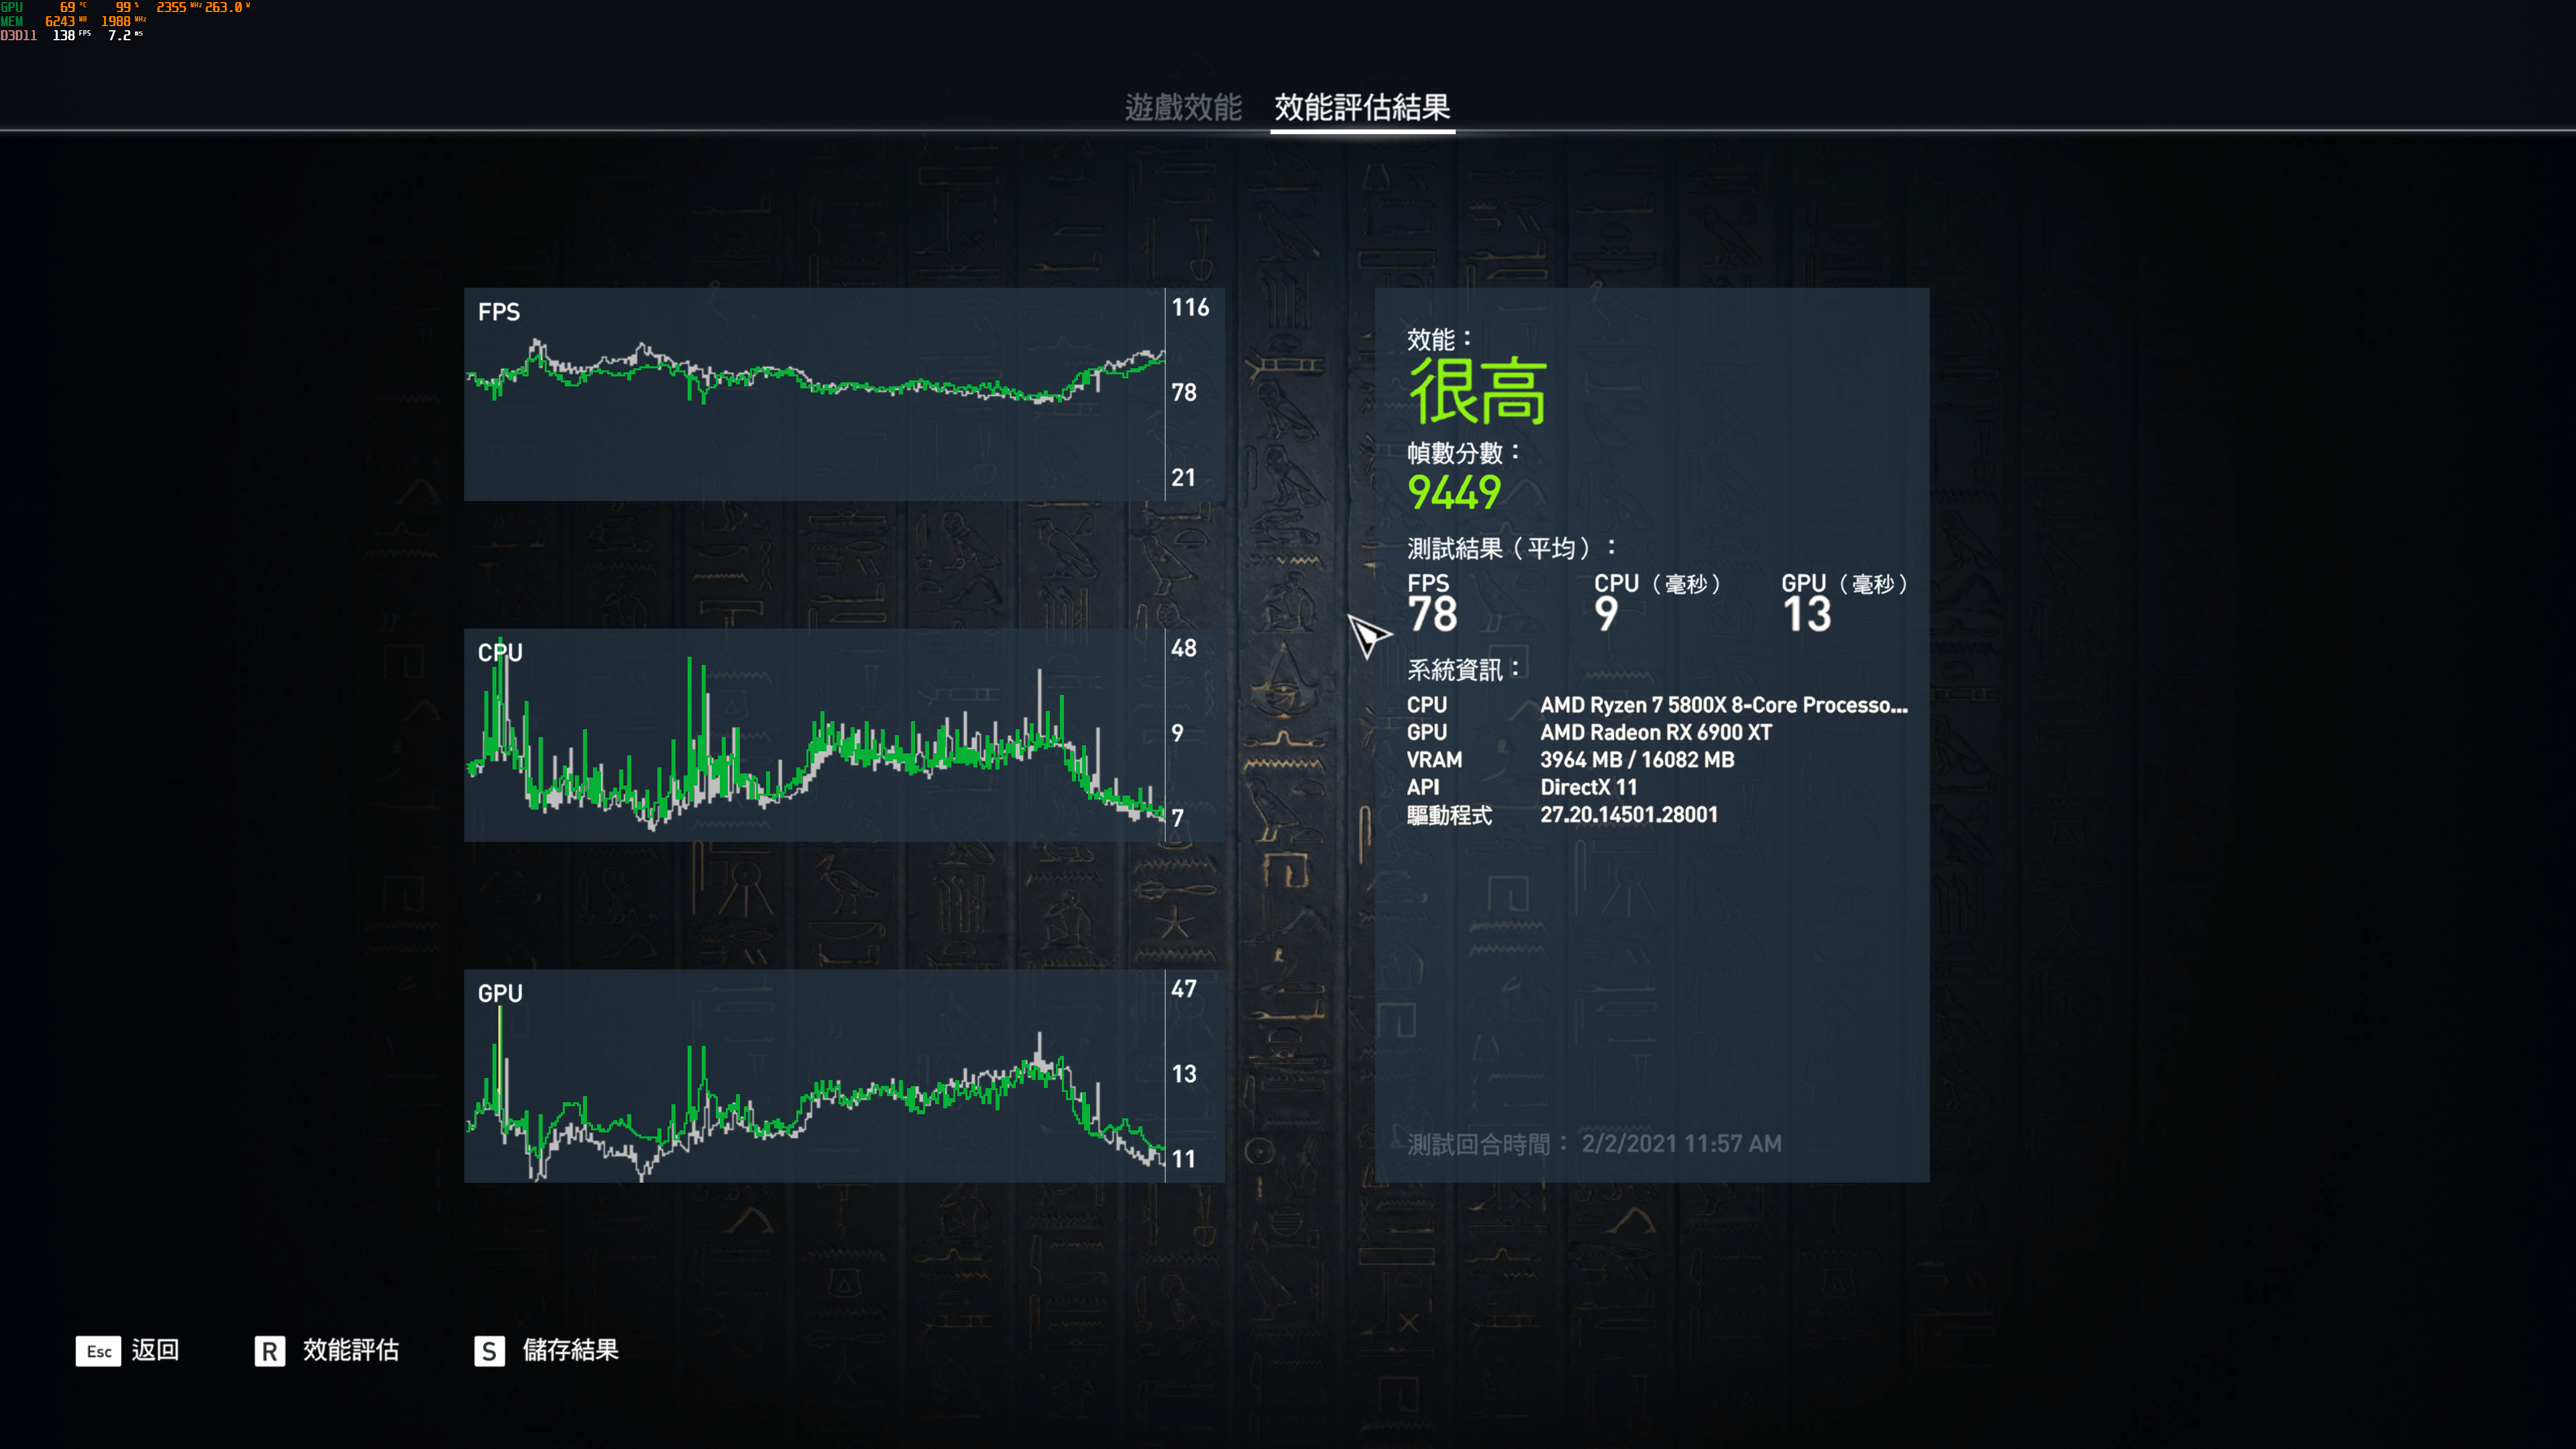
Assassin's Creed Origins Benchmark 4K比較表 單位 : Score (數字愈大愈好)

d.UNIGINE Superposition Benchmark
UNIGINE是一款專有的跨平台遊戲引擎,由俄羅斯軟件公司 UNIGINE Corp開發。除了用作遊戲引擎外,它還用於虛擬現實系統,嚴肅遊戲和可視化
UNIGINE最強大的功能是它的高級渲染器,支持 OpenGL 4.0和 DirectX 11,Superposition則為 2017版本,包含極端性能和穩定性測試:視頻卡,電源,冷卻系統,檢查預設和超頻模式與真實負載及在環境中的互動體驗
UNIGINE Superposition Benchmark 1080P Extreme Results
Core i9-11900K@All Core 5.2GHz 1080P UNIGINE Superposition Benchmark Extreme:10833分
對照組 Core i9-10900K@All Core 5GHz 1080P UNIGINE Superposition Benchmark Extreme:10993分

Ryzen 7 5800X@All Core 4.725GHz
1080P UNIGINE Superposition Benchmark Extreme:11065分
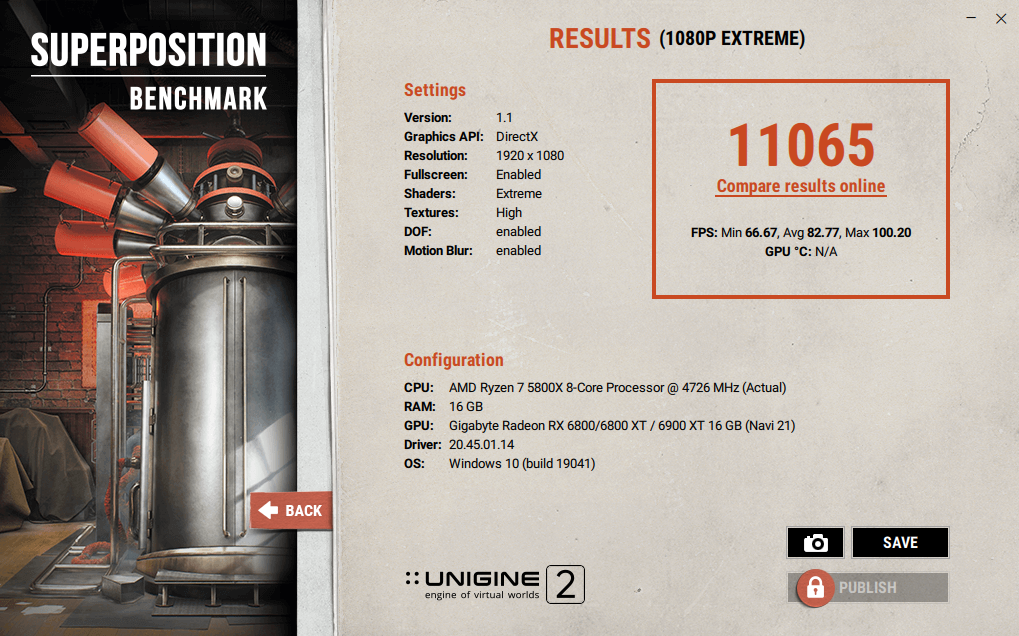
UNIGINE Superposition Benchmark 1080P Extreme比較表 單位 : Score(數字愈大愈好)

UNIGINE Superposition Benchmark 4K Optimazed Results
Core i9-11900K@All Core 5.2GHz 4K UNIGINE Superposition Benchmark:15060分
對照組 Core i9-10900K@All Core 5GHz 4K UNIGINE Superposition Benchmark:15386分

Ryzen 7 5800X@All Core 4.725GHz
4K UNIGINE Superposition Benchmark:15481分

UNIGINE Superposition Benchmark 4K Optimazed比較表 單位 : Score(數字愈大愈好)

e.3DMark Time Spy & Extreme
3DMark Time Spy用來測試處理器及顯示卡之 3D圖形表現和工作負載,現由 UL擁有,主要是針對 DirectX 12的效能,測試有三個部分,第一個為顆粒陰影、曲面細分等效果,第二個則是光線追蹤的體積光照明技術,最後則是 CPU效能測試,在前兩個測試中,包含了數千萬個頂點跟多邊形,上百萬個曲面細分,這些都是 FireStrike的幾十倍,而 3DMark Time Spy Extreme是 3DMark Time Spy的 4K版本,所有圖形都是 4K規格
3DMark Time Spy Benchmark Results
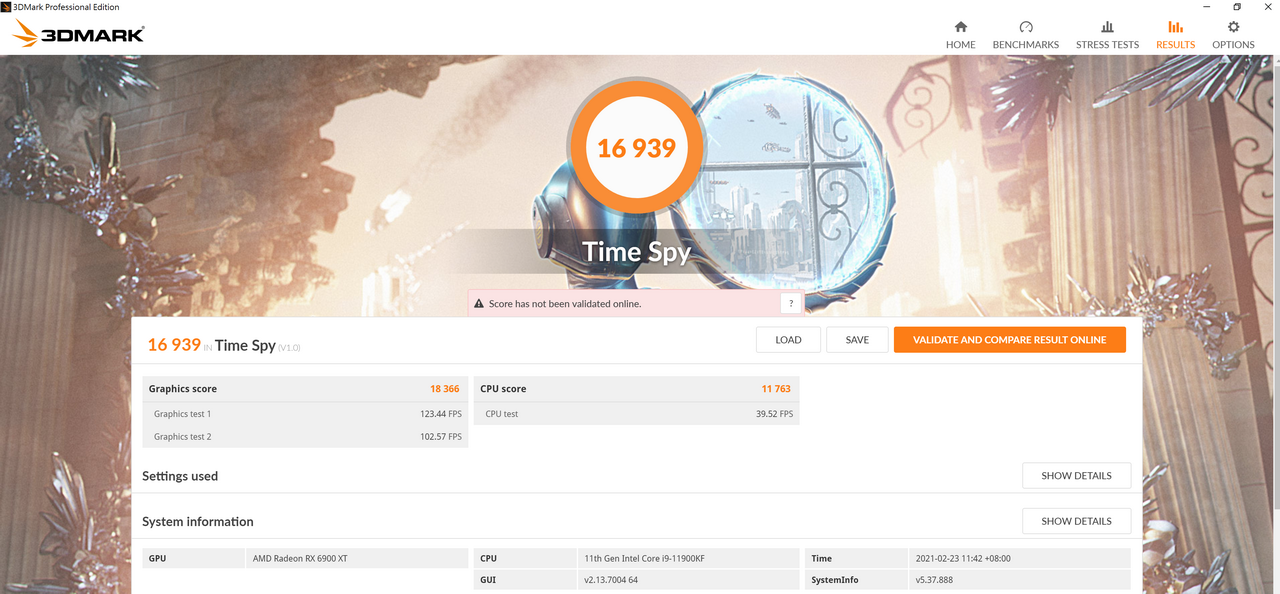
Core i9-11900K@All Core 5.2GHz 3DMark Time Spy:16939分
對照組 Core i9-10900K@All Core 5GHz 3DMark Time Spy:17890分

Ryzen 7 5800X@All Core 4.725GHz
3DMark Time Spy:17333分
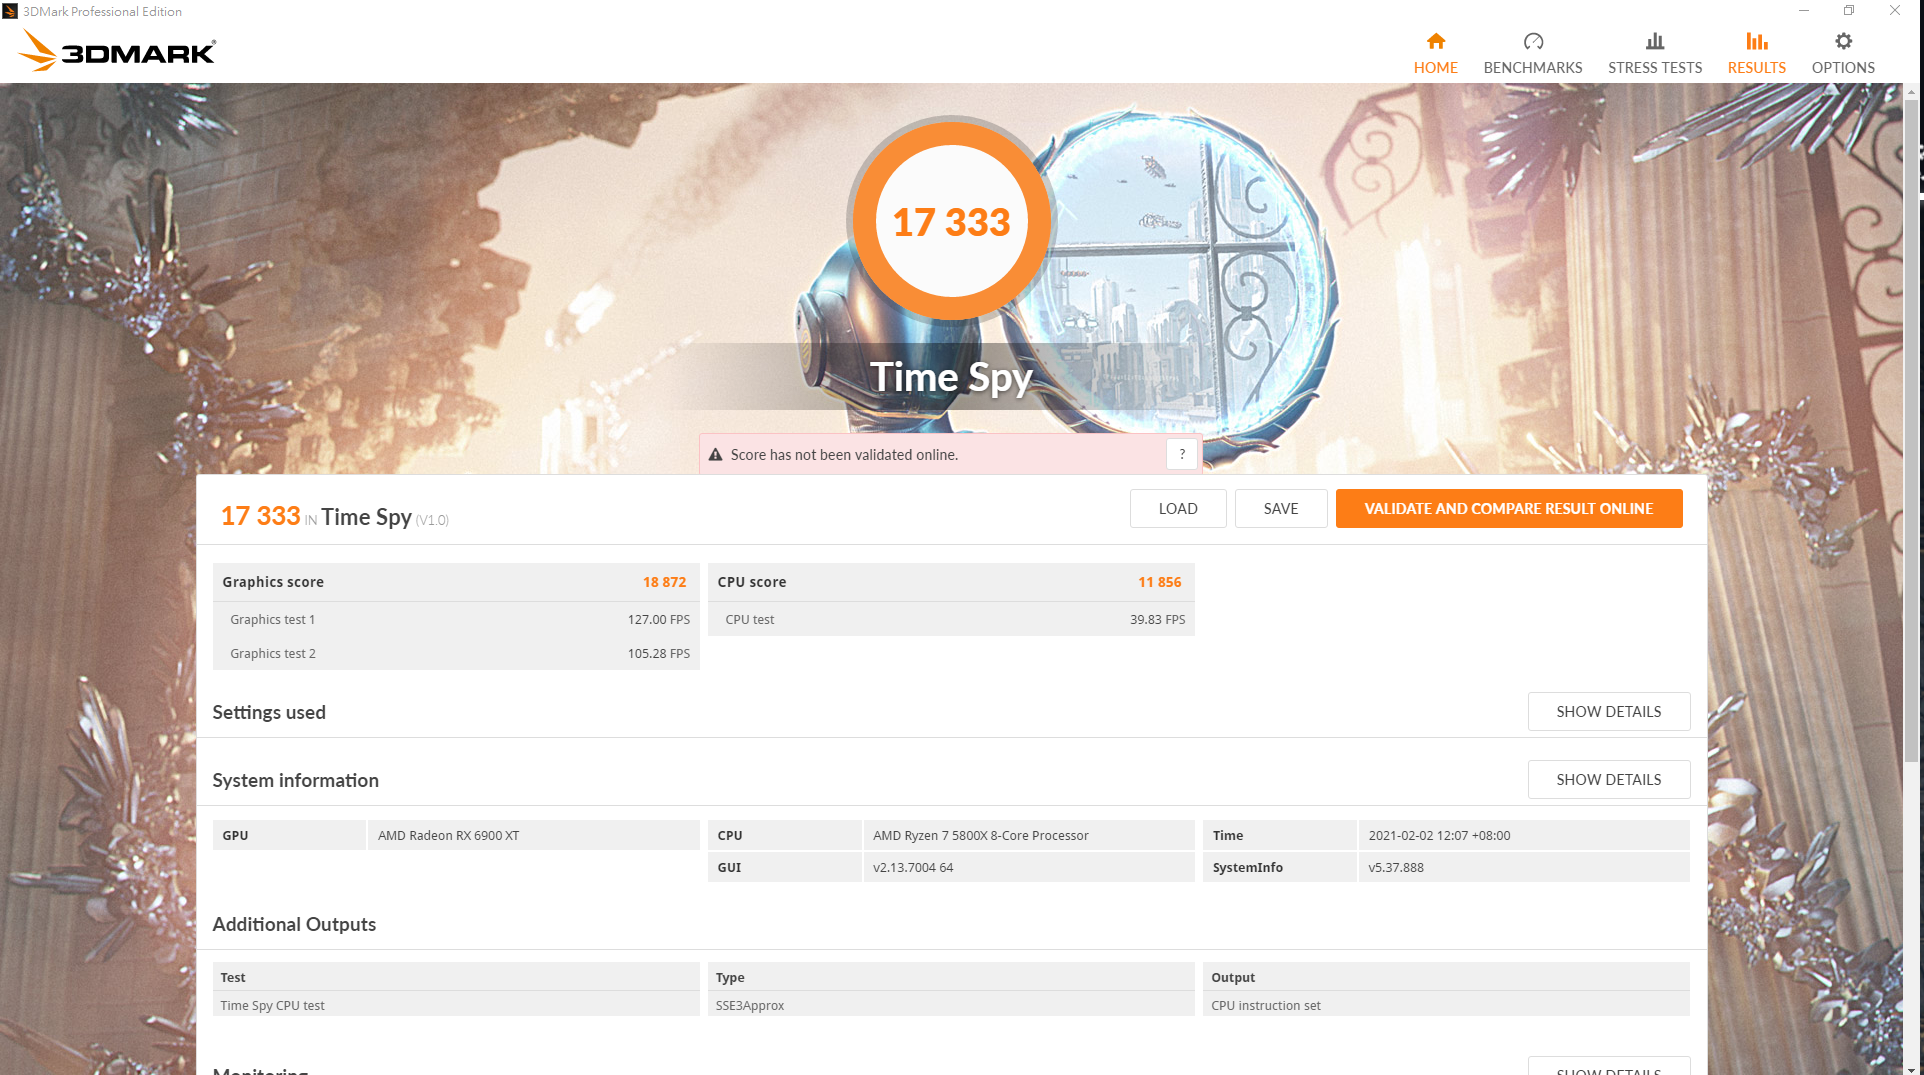
3DMark Time Spy Benchmark CPU Score比較表 單位 : Score(數字愈大愈好)

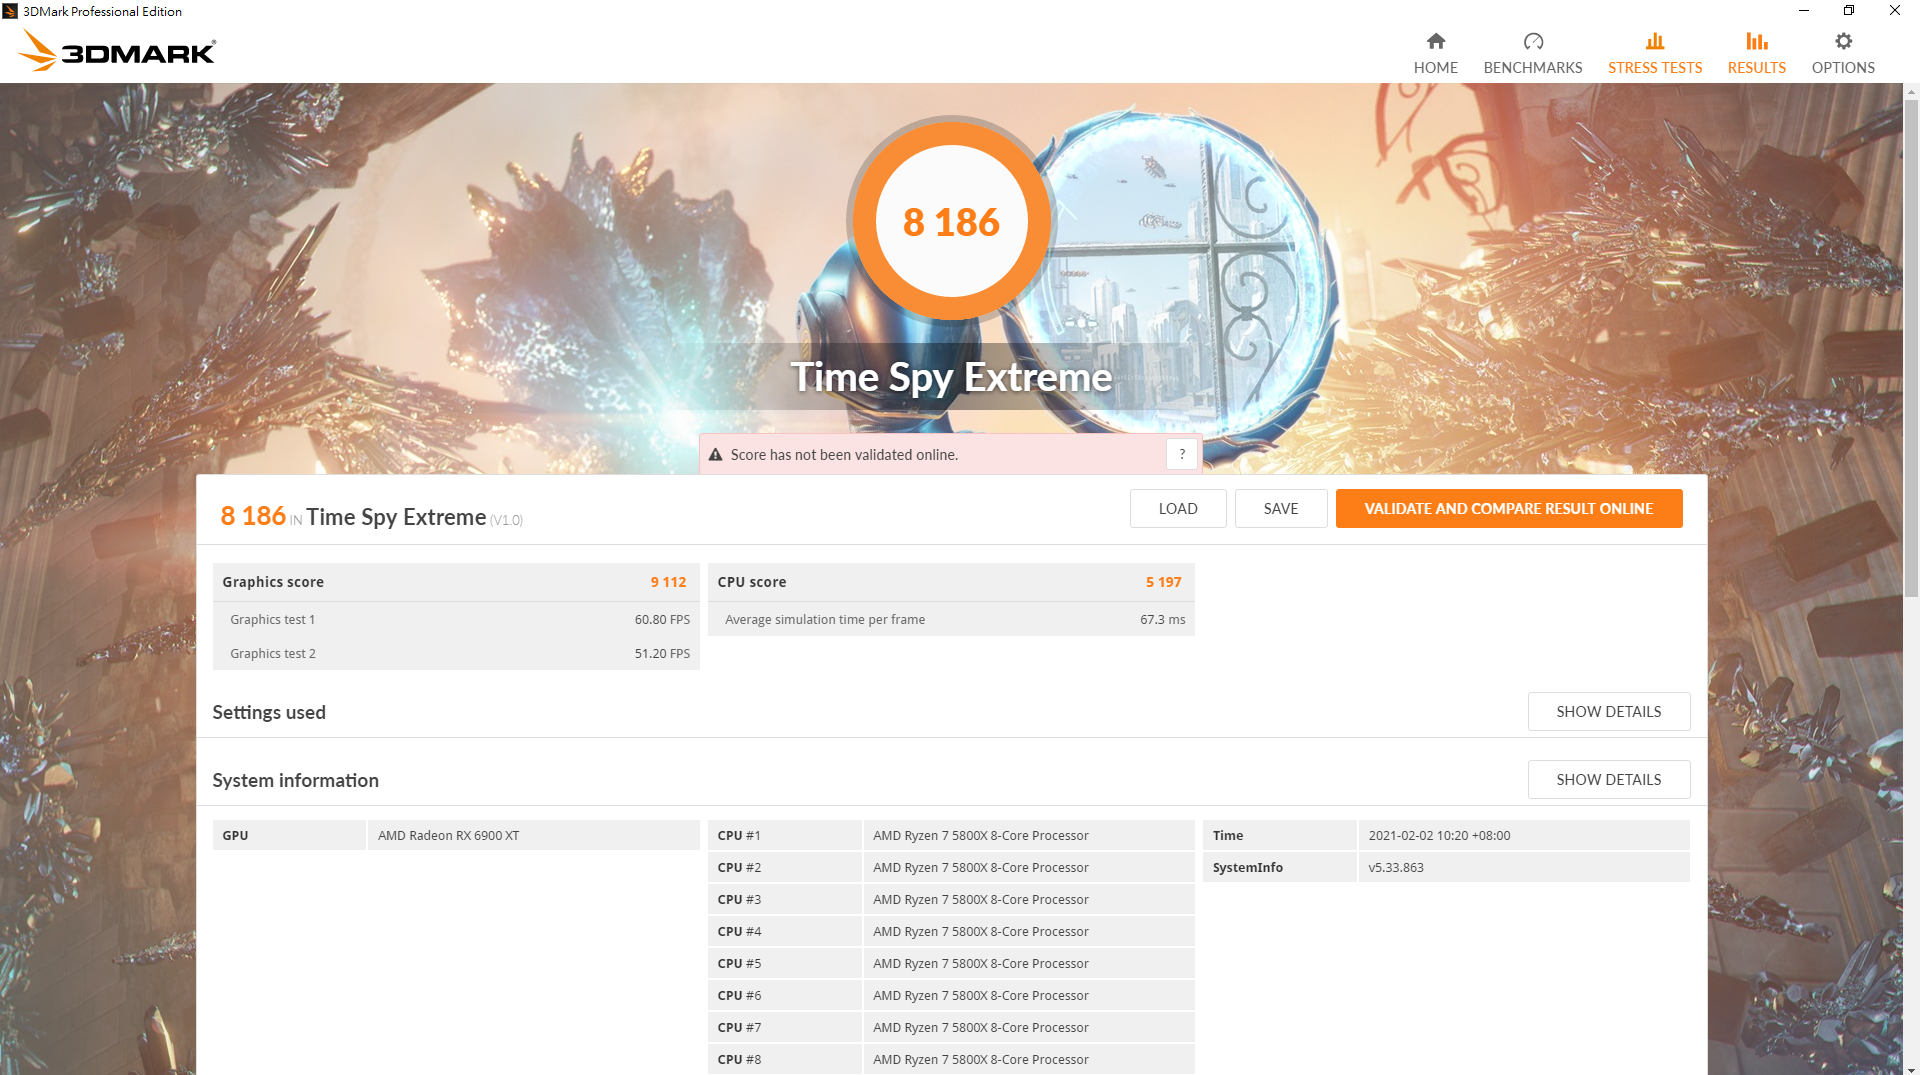
f.3DMark Time Spy Extreme
3DMark Time Spy Extreme Benchmark Results
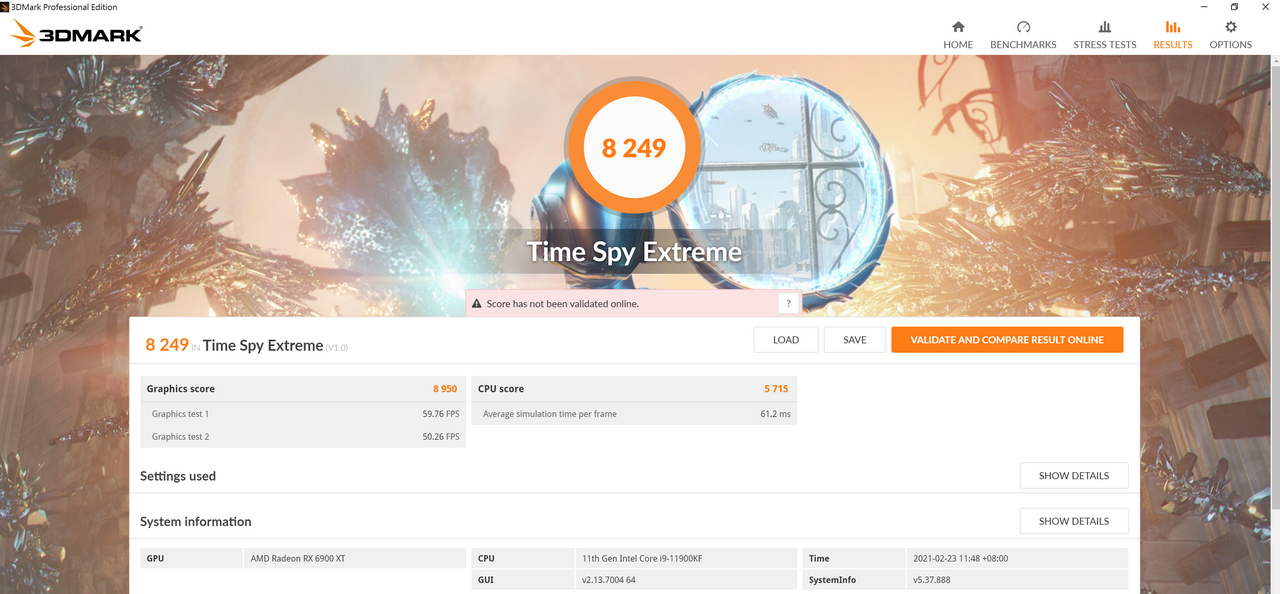
Core i9-11900K@All Core 5.2GHz 3DMark Time Spy Extreme:8249分
對照組 Core i9-10900K@All Core 5GHz 3DMark Time Spy Extreme:8621分

Ryzen 7 5800X@All Core 4.725GHz
3DMark Time Spy Extreme:8375分
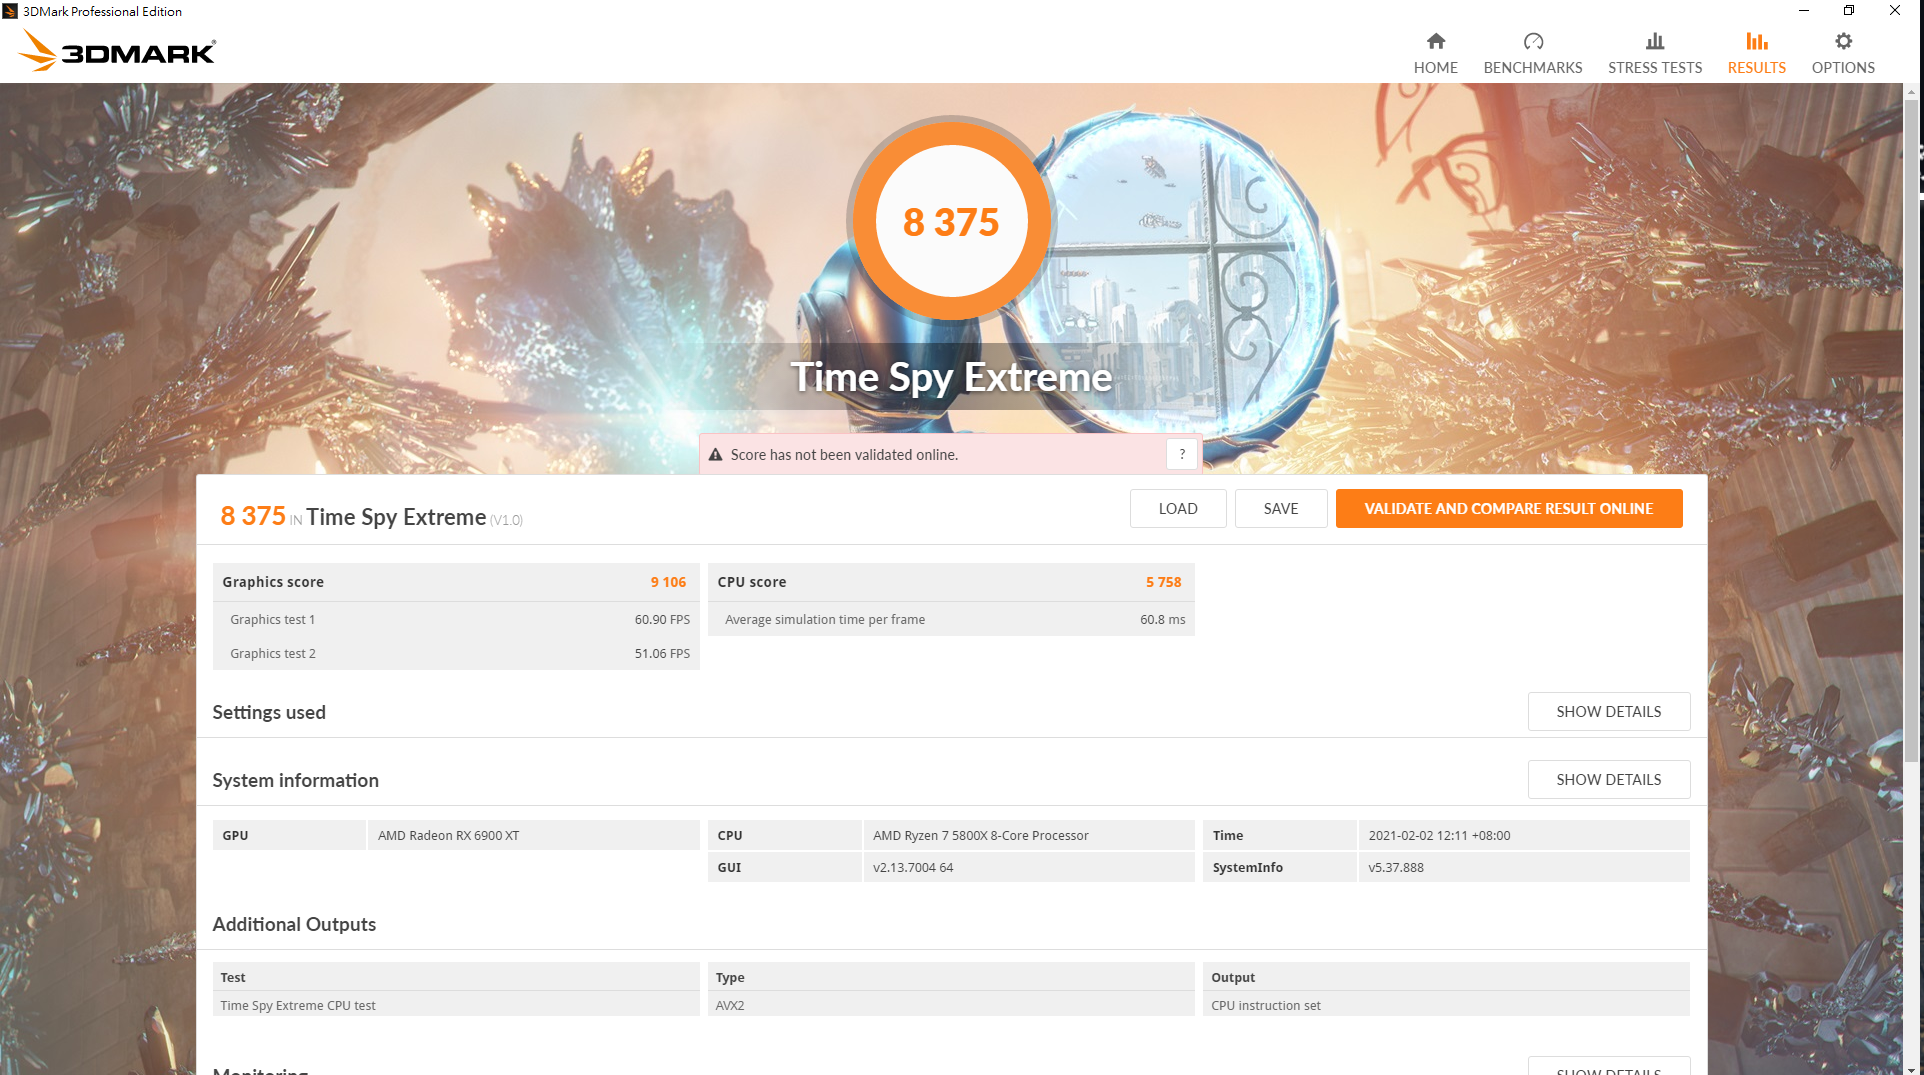
3DMark Time Spy Extreme Benchmark CPU Score比較表 單位 : Score(數字愈大愈好)

g.3DMark Port Royal
3DMark 之 Port Royal加入 DirectX 12 的 DXR(DirectX Raytracing)選用 API 集,能夠於當代遊戲大量使用的光柵化成像,加入即時光影追蹤效果,以便達成視區外物件反射、即時陰影等光柵化無法達成的畫面效果

3DMark Port Royal Benchmark Results
Core i9-11900K@All Core 5.2GHz 3DMark Port Royal:9856分
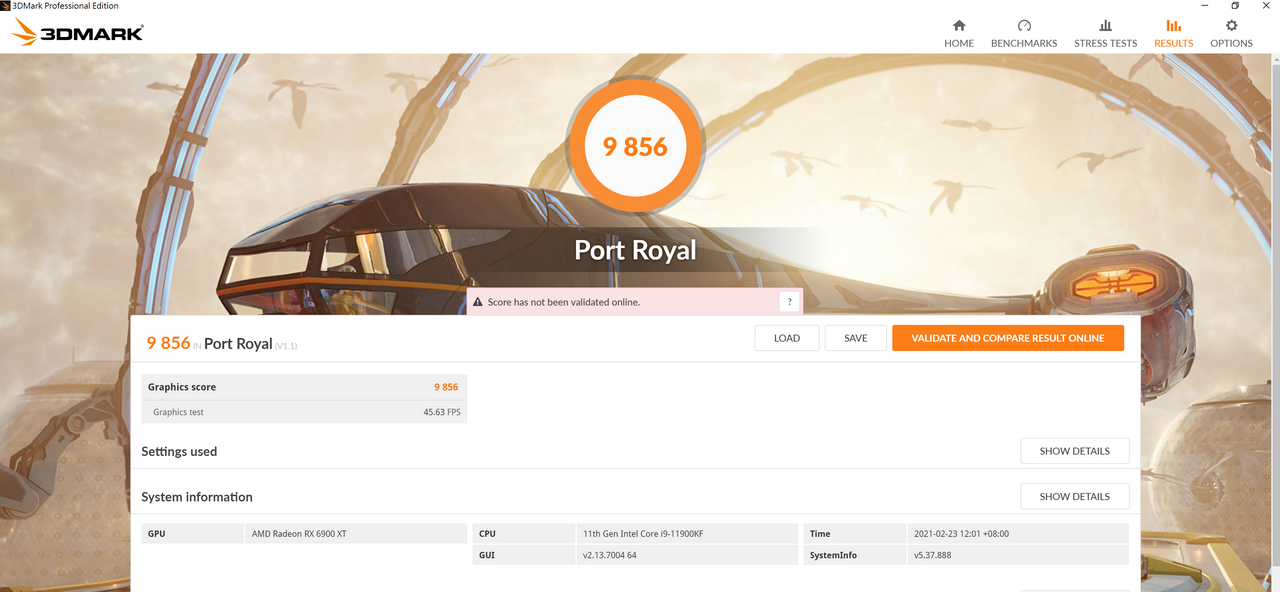
對照組 Core i9-10900K@All Core 5GHz 3DMark Port Royal:9875分

Ryzen 7 5800X@All Core 4.725GHz
3DMark Port Royal:9836分
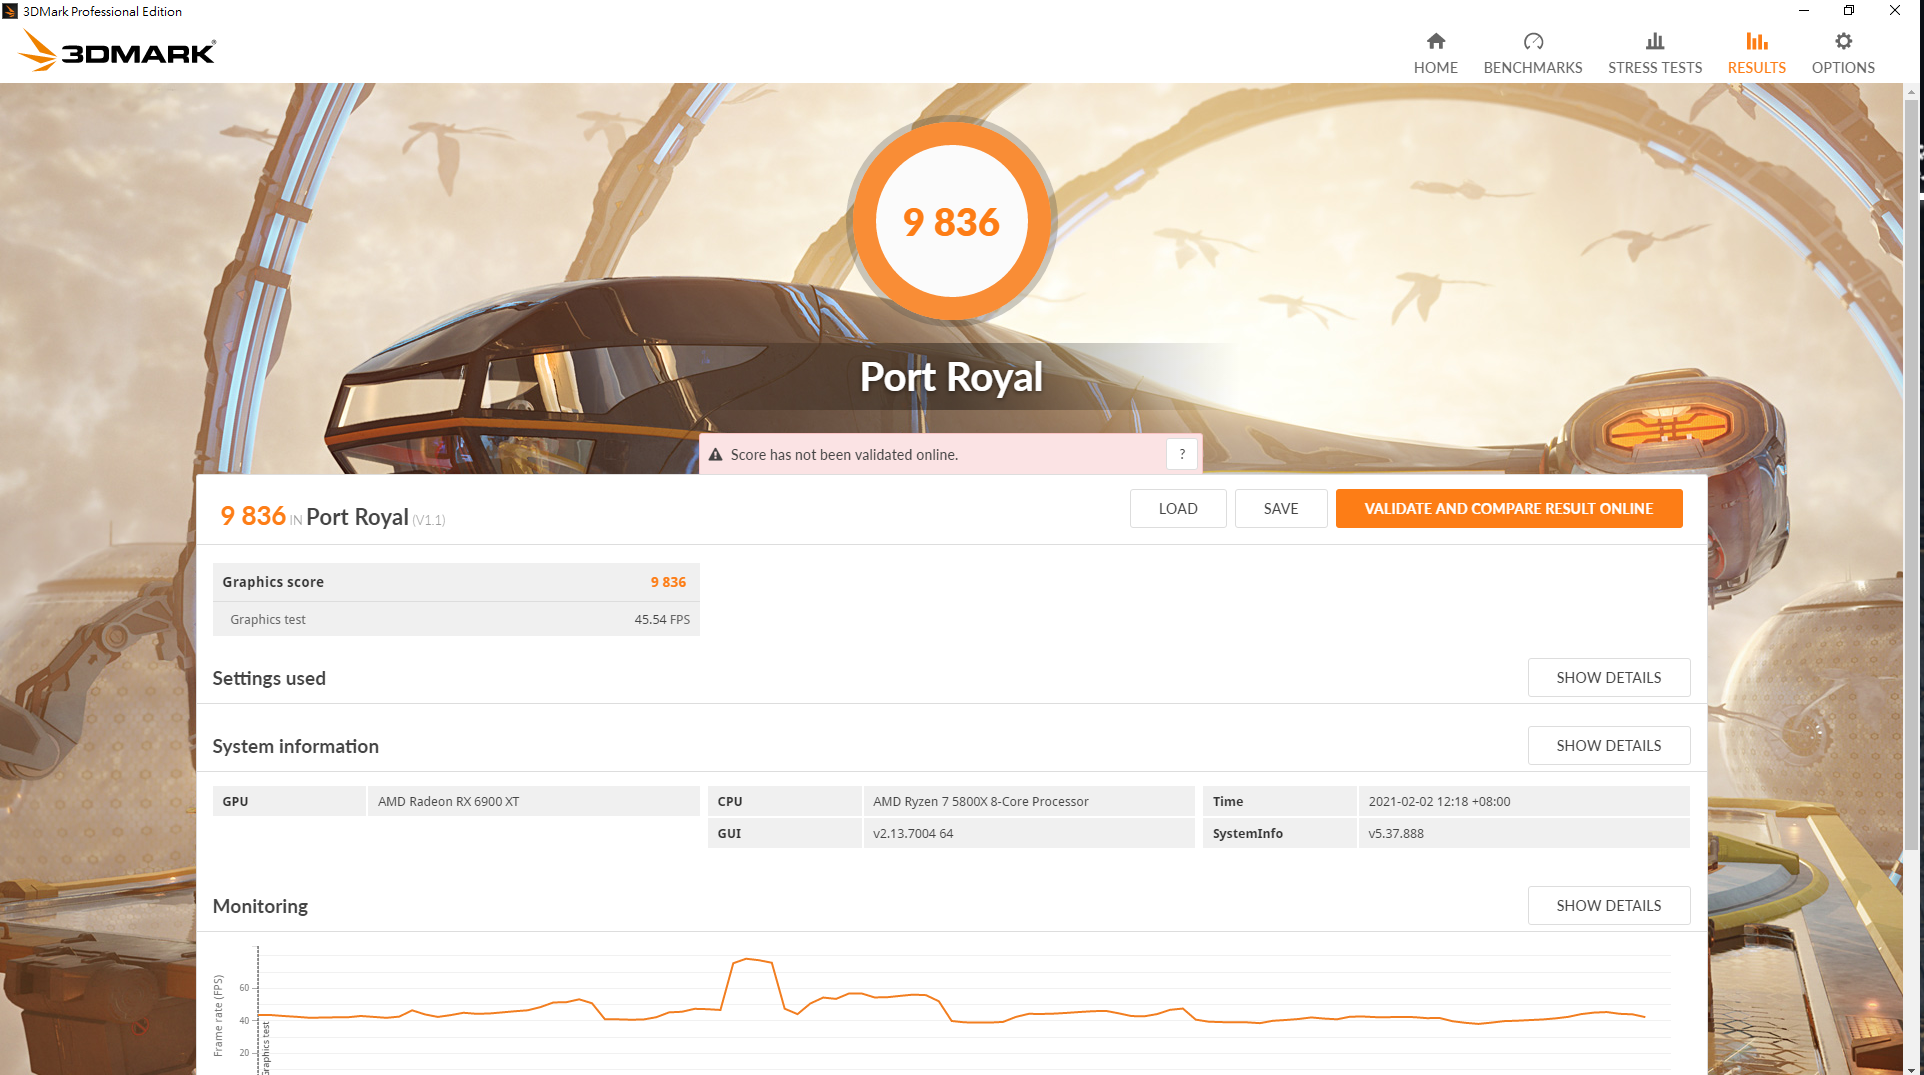
3DMark Port Royal比較表 單位 : Score (數字愈大愈好)

h.Final Fantasy XV Benchmark
Final Fantasy XV《太空戰士 15》的 Benchmark,是一款由史克威爾艾尼克斯在 2016年 11月推出的動作角色扮演遊戲《Final Fantasy系列》的第 15部,依照傳統,太空戰士都有 Benchmark的項目
Final Fantasy XV Benchmark 1080P Results
Core i9-11900K@All Core 5.2GHz 1080P Final Fantasy XV Benchmark:15690分
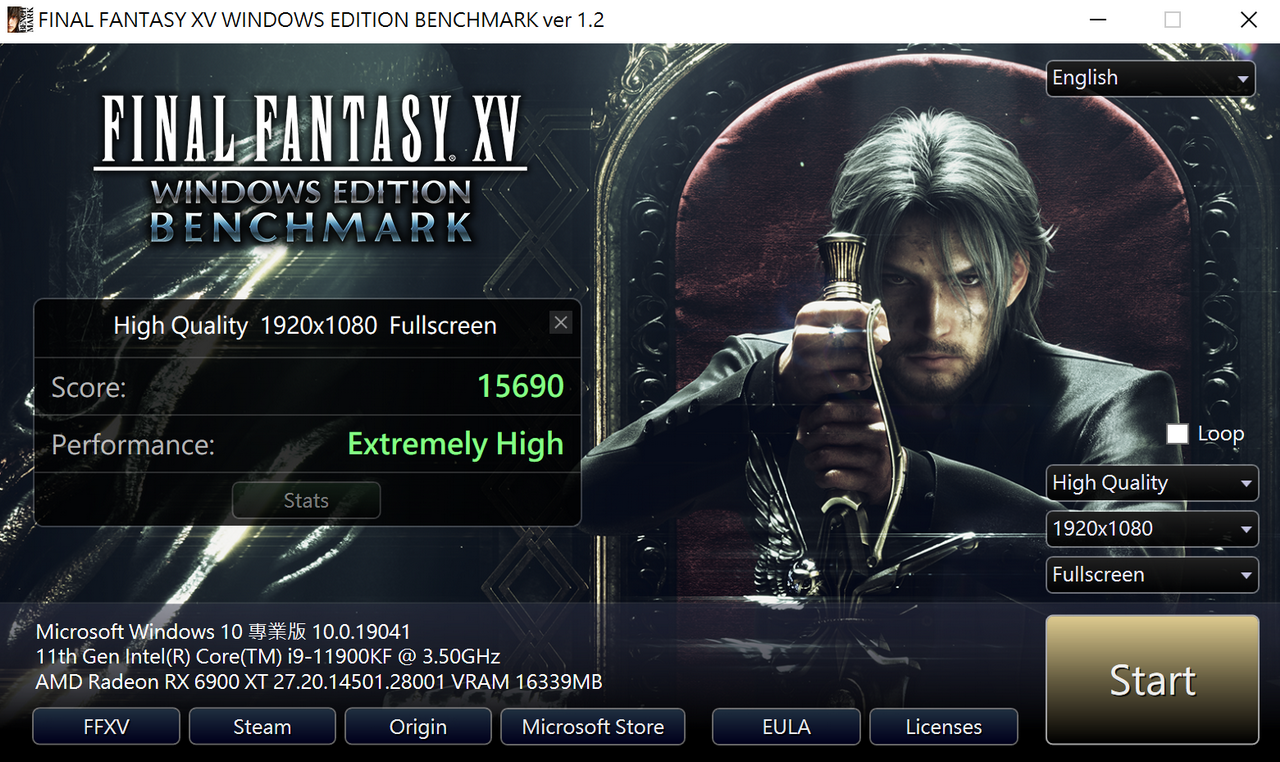
對照組 Core i9-10900K@All Core 5GHz 1080P Final Fantasy XV Benchmark:15985分

Ryzen 7 5800X@All Core 4.725GHz
1080P Final Fantasy XV Benchmark:15759分
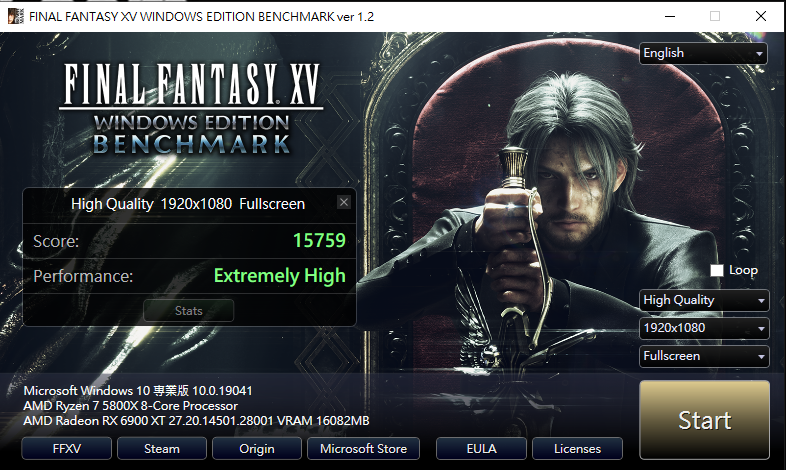
Final Fantasy XV Benchmark 1080P比較表 單位 : Score(數字愈大愈好)

Final Fantasy XV Benchmark 4K Results
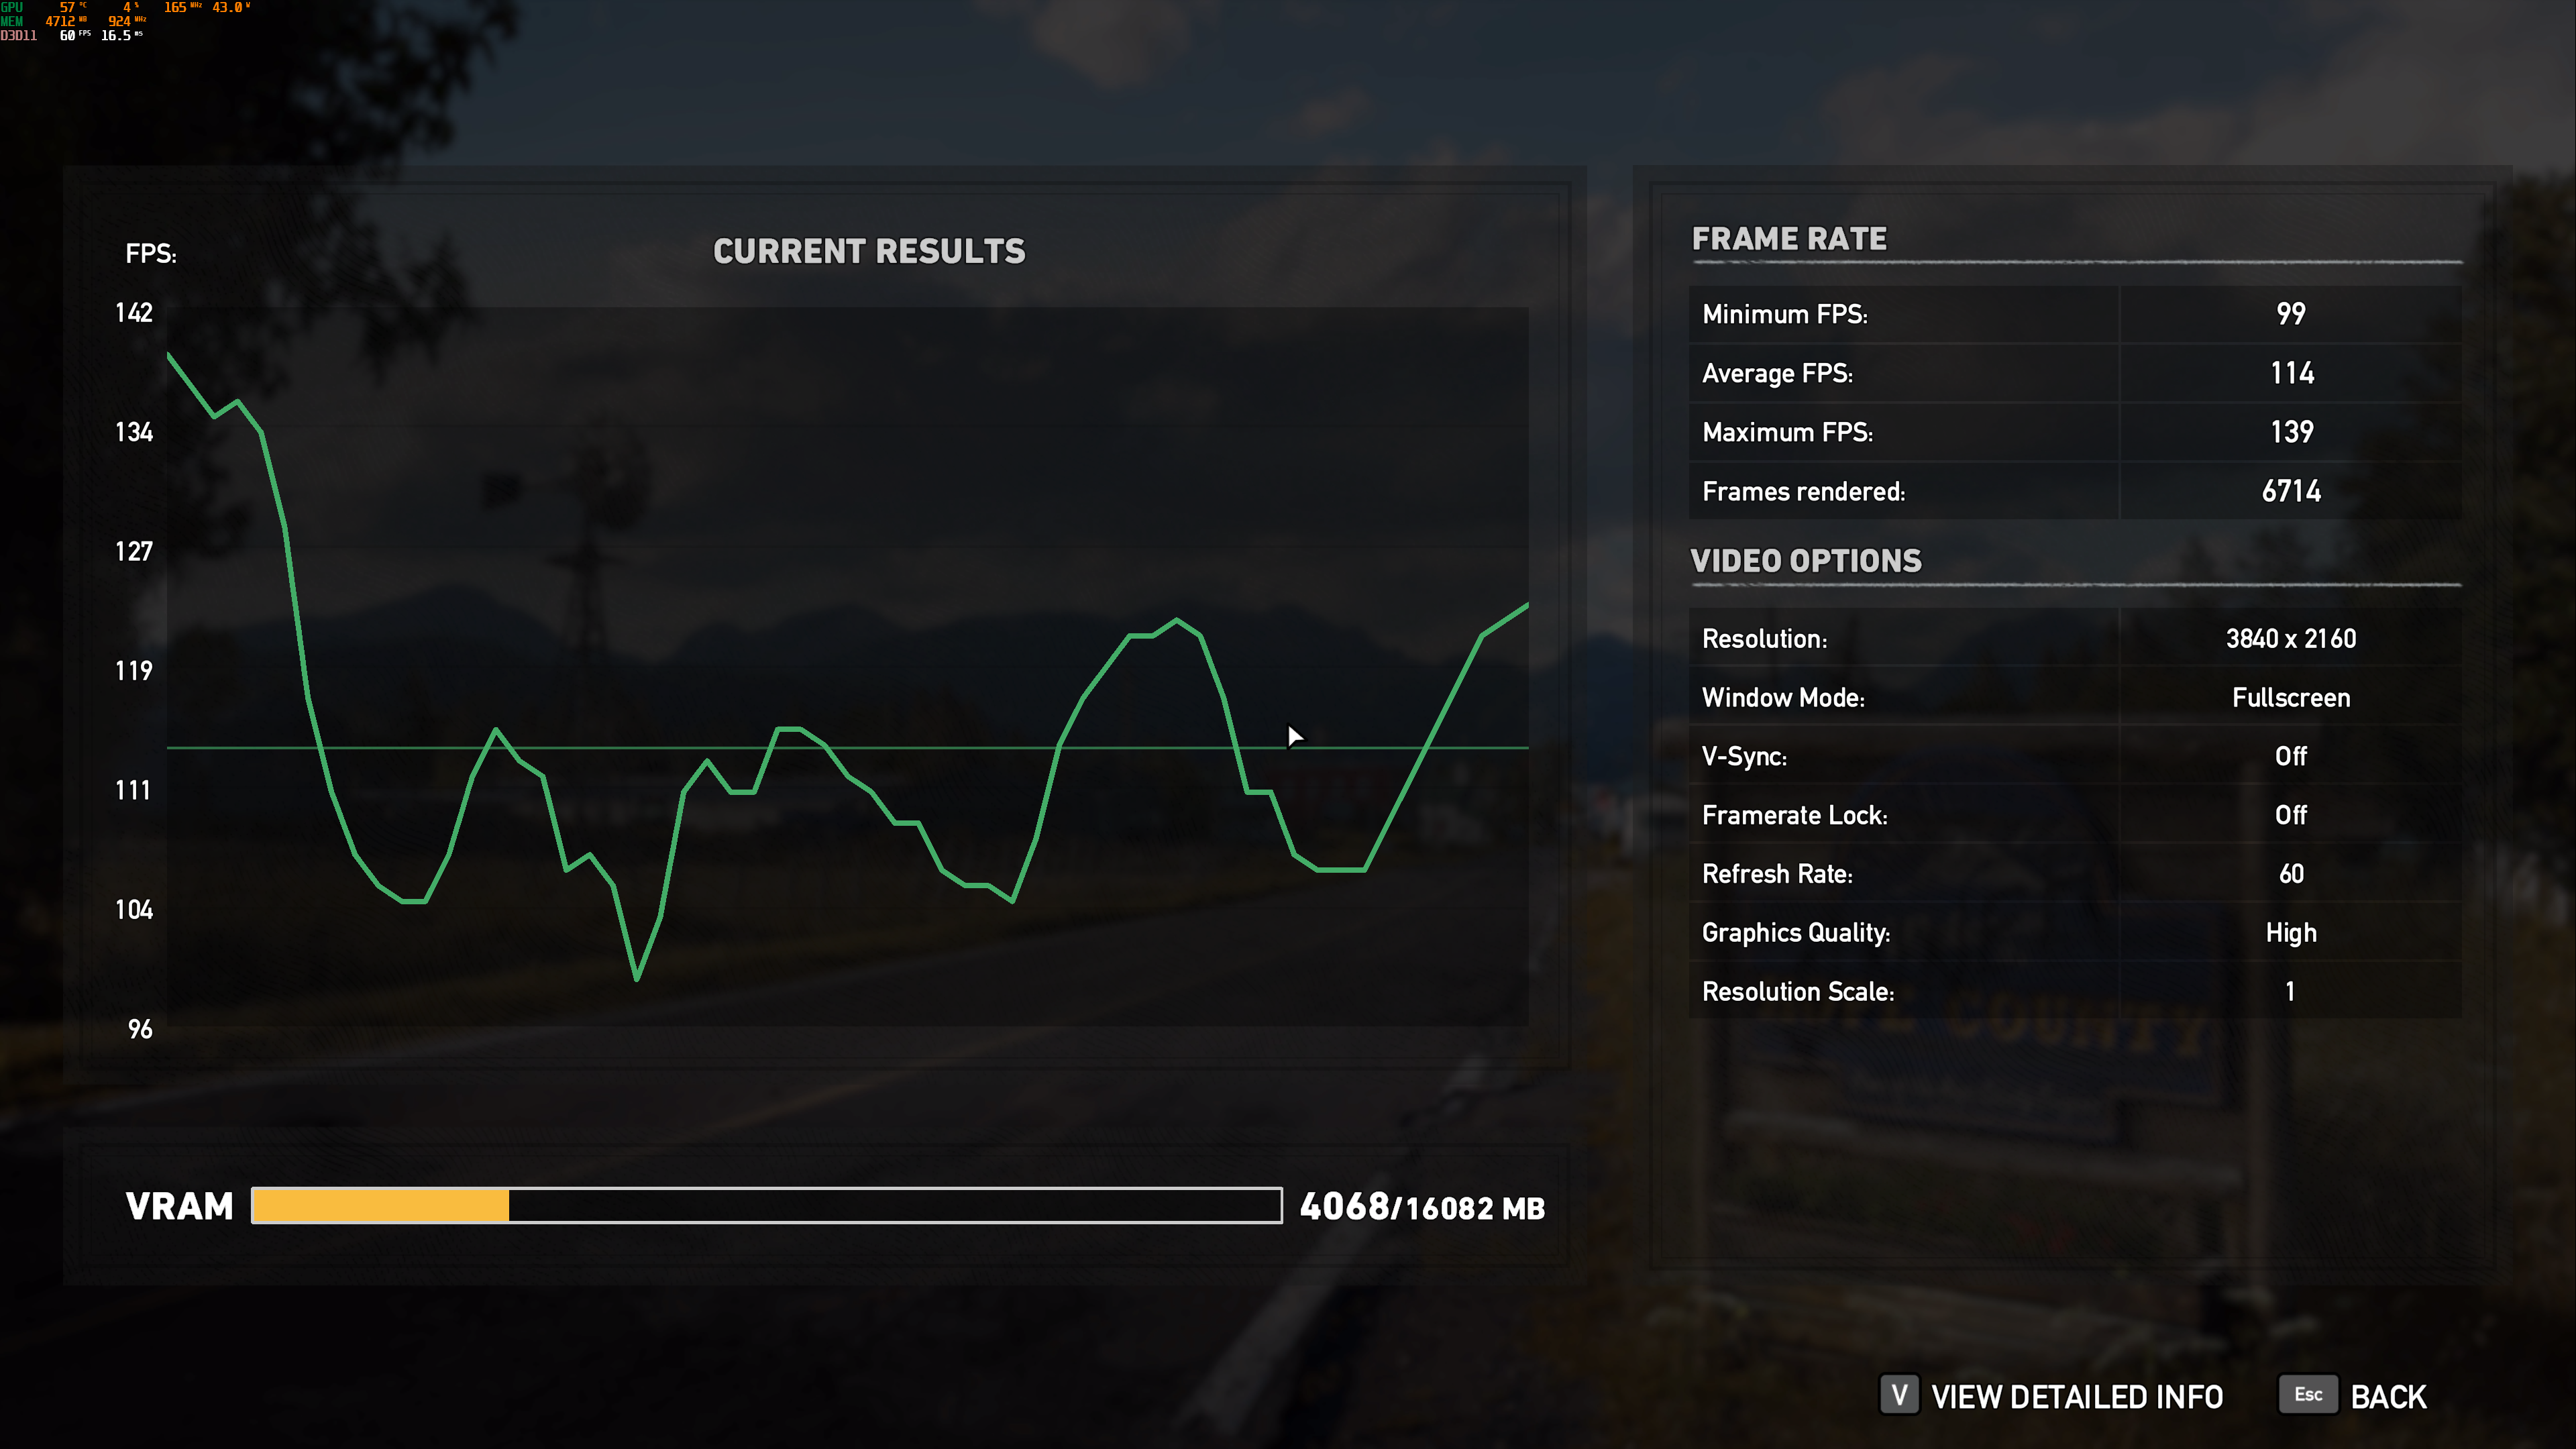
Core i9-11900K@All Core 5.2GHz 4K Final Fantasy XV Benchmark:7364分
對照組 Core i9-10900K@All Core 5GHz 4K Final Fantasy XV Benchmark:7386分

Ryzen 7 5800X@All Core 4.725GHz
4K Final Fantasy XV Benchmark:7254分
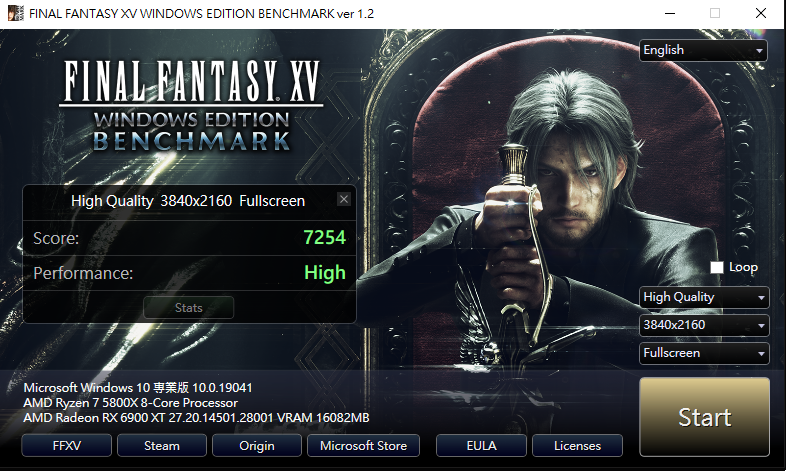
Final Fantasy XV Benchmark 4K比較表 單位 : Score(數字愈大愈好)

i.Middle-earth: Shadow of War Benchmark《中土世界:戰爭之影》
Middle-earth: Shadow of War《中土世界:戰爭之影》亦為一自帶 Benchmark的角色扮演遊戲,是由 Monolith Productions開發並由華納兄弟互動娛樂發行並於 2017年 10月 10日在全球發布
Middle-earth: Shadow of War Benchmark 1080P Results
Core i9-11900K@All Core 5.2GHz 1080P Middle-earth: Shadow of War Benchmark:190fps
對照組 Core i9-10900K@All Core 5.2GHz 1080P Middle-earth: Shadow of War Benchmark:200fps

Ryzen 7 5800X@All Core 4.725GHz
1080P Middle-earth: Shadow of War Benchmark:218fps
Middle-earth: Shadow of War Benchmark 1080P比較表 單位 : Score(數字愈大愈好)

Middle-earth: Shadow of War Benchmark 4K Results
Core i9-11900K@All Core 5.2GHz 4K Middle-earth: Shadow of War Benchmark:98fps
對照組 Core i9-10900K@All Core 5GHz 4K Middle-earth: Shadow of War Benchmark:77fps

Ryzen 7 5800X@All Core 4.725GHz
4K Middle-earth: Shadow of War Benchmark:105fps
Middle-earth: Shadow of War Benchmark 4K比較表 單位 : Score(數字愈大愈好)

C.內顯測試
11700K@Xe Benchmark (11700K內顯為 Xe架構 GT1,代號 UHD 750 (擁有 32個 EU)
使用 GIGABYTE Z590 AORUS TACHYON

測試諸元
對照組
10900K@UHD 630 Benchmark
測試諸元
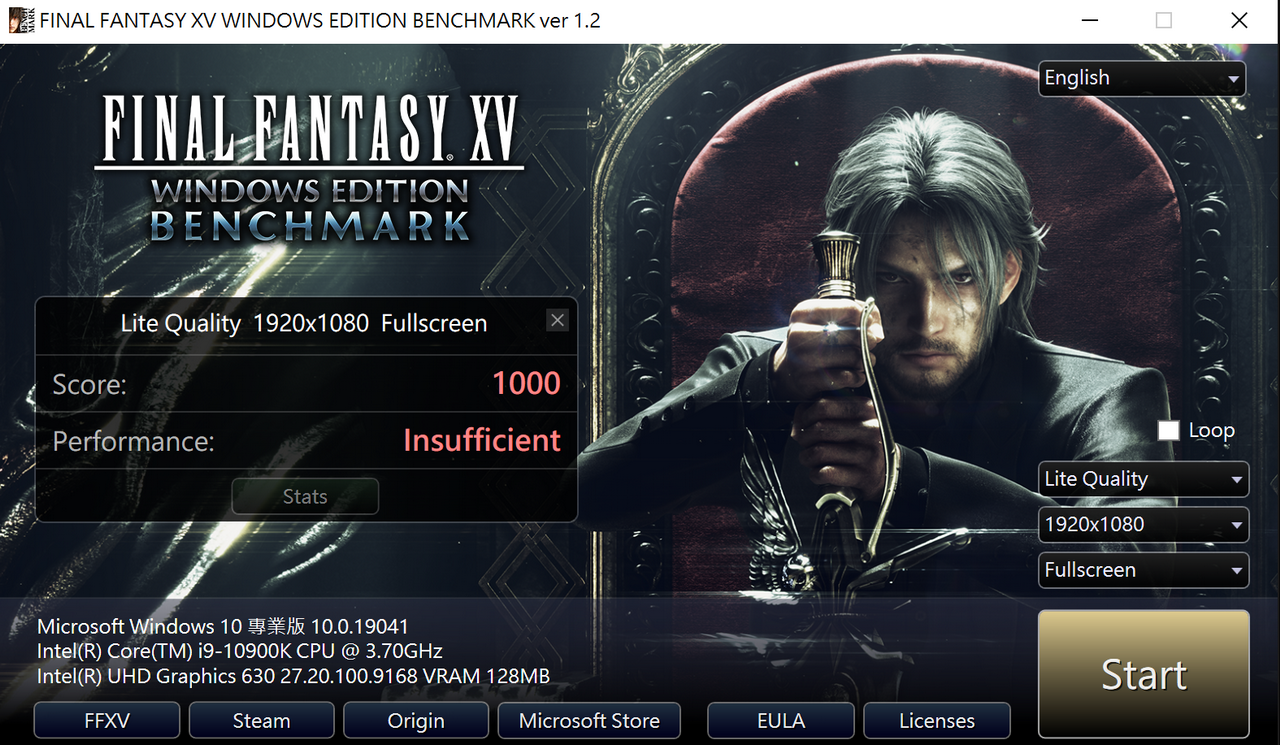
Core i7-11700K UHD 750
Final Fantasy XV Lite mode 1080P 1000分
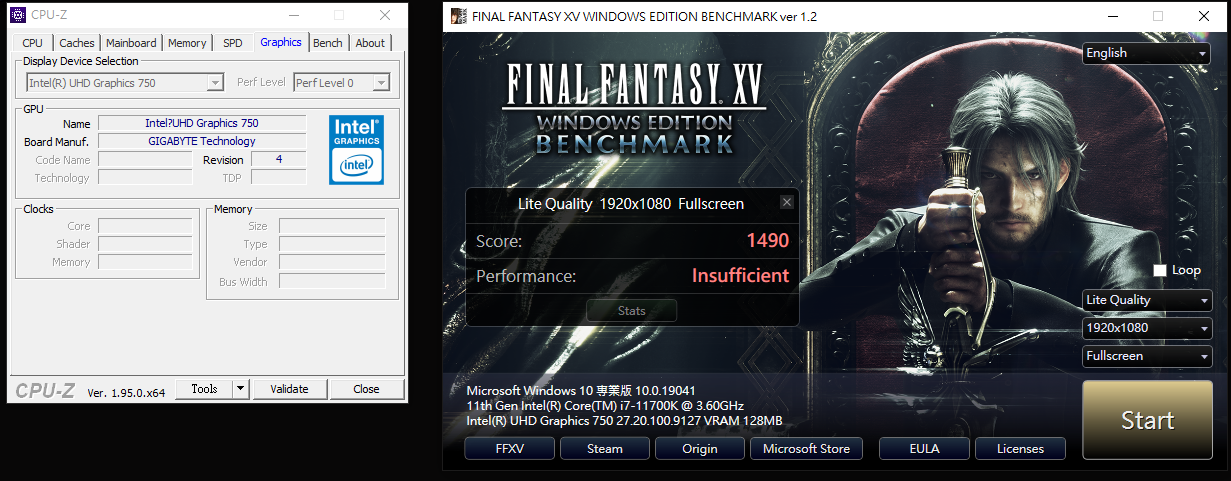
對照組
Core i9-10900K UHD 630
Final Fantasy XV Lite mode 1080P 1000分
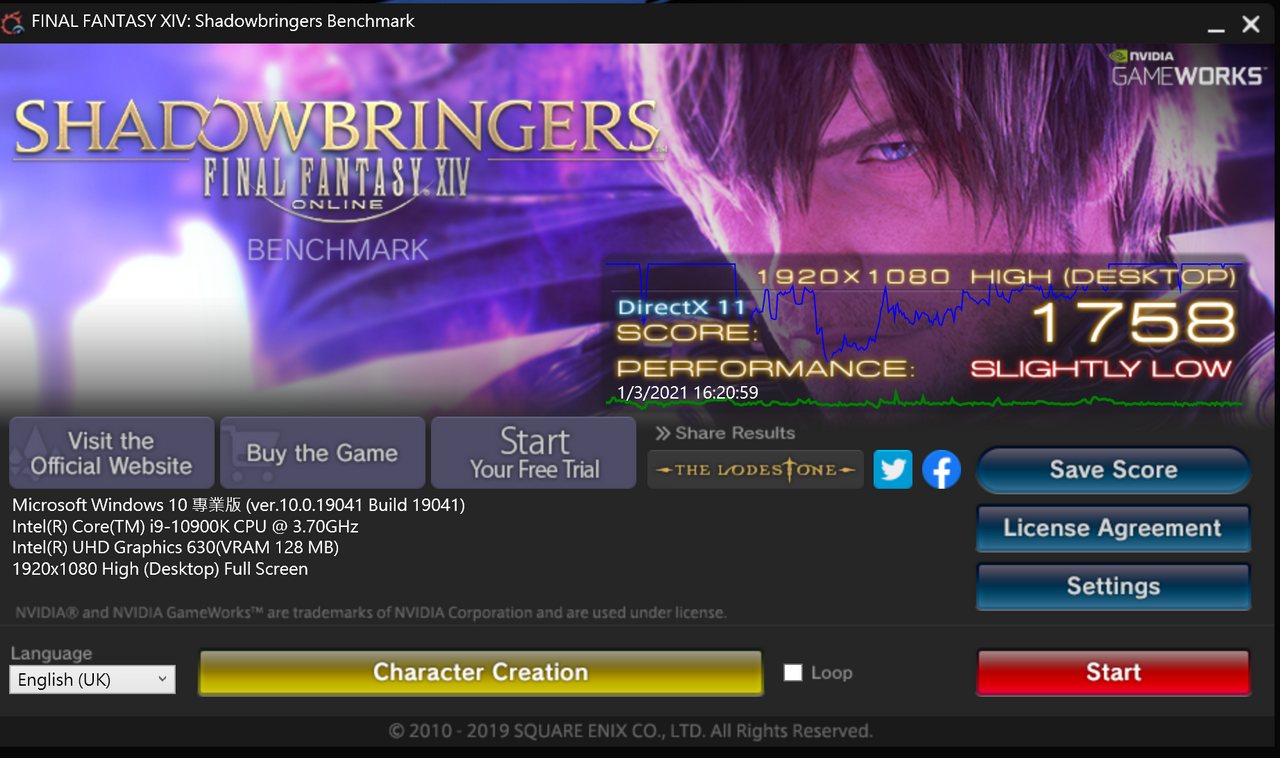
Core i7-11700K UHD 750
Final Fantasy XIV Lite mode 1080P 2373分
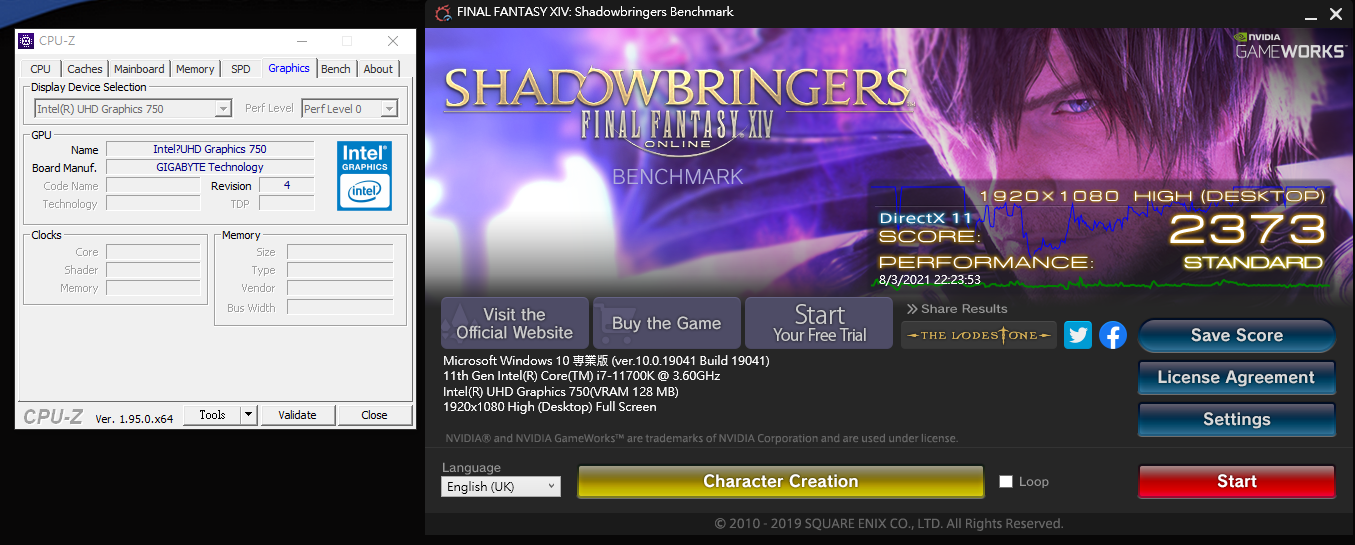
對照組
10900K UHD 630
Final Fantasy XIV Lite mode 1080P 1758分
Core i7-11700K UHD 750
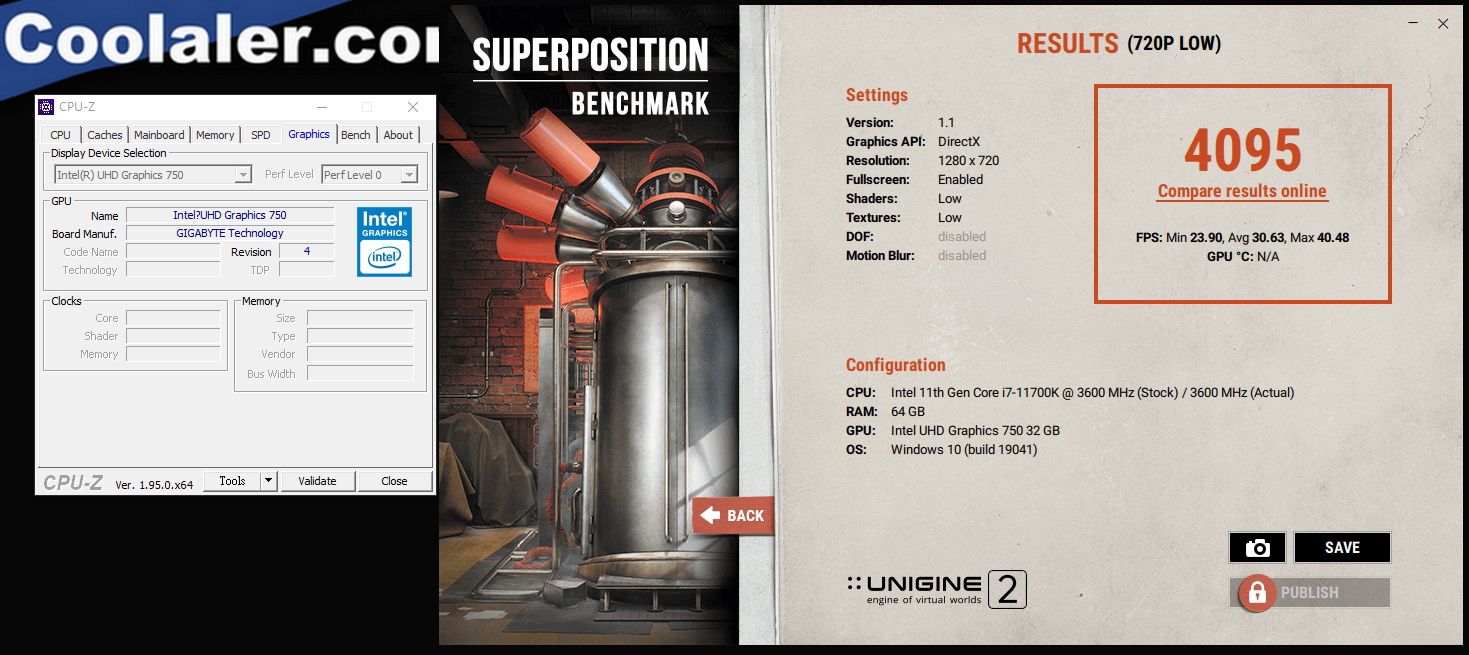
UNIGINE Superposition Benchmark 720P Low:4095分
對照組 UHD 630
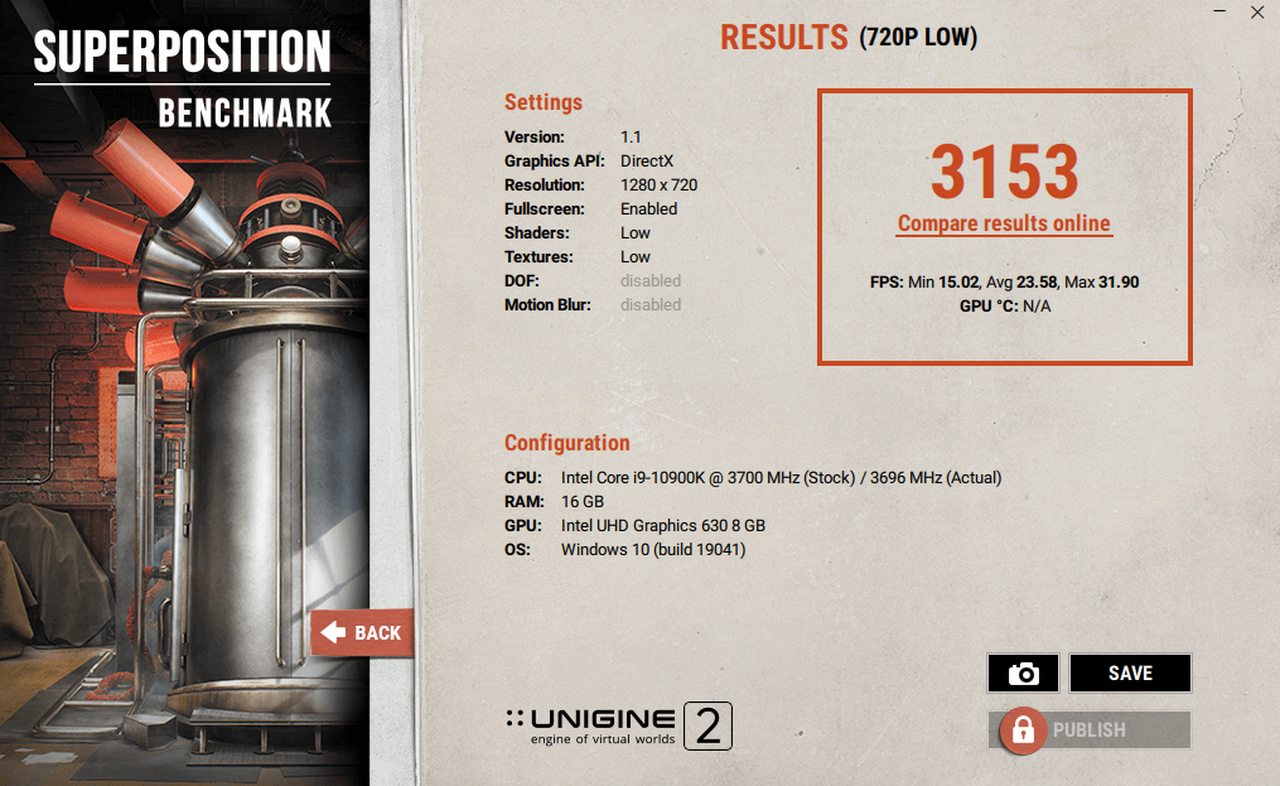
Core i9-10900K UNIGINE Superposition Benchmark 720P Low:3153分
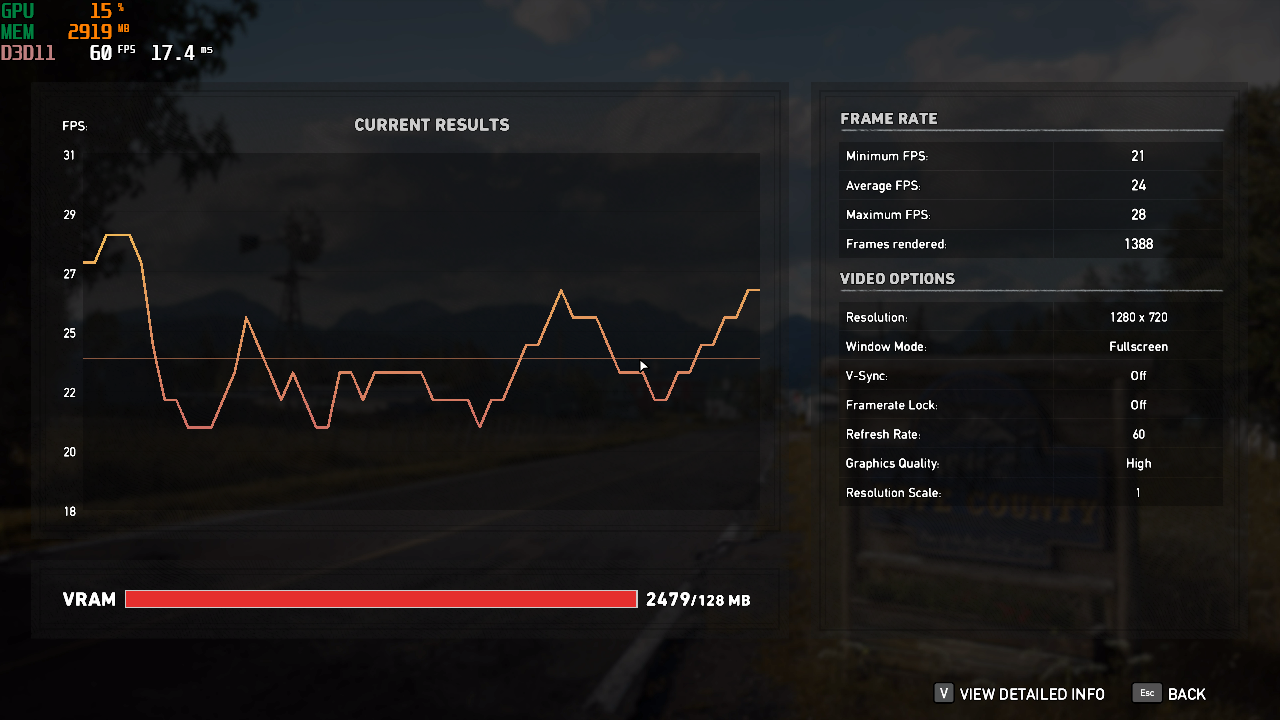
Core i9-11700K UHD 750 FarCry5 Benchmark 720P :24fps
對照組
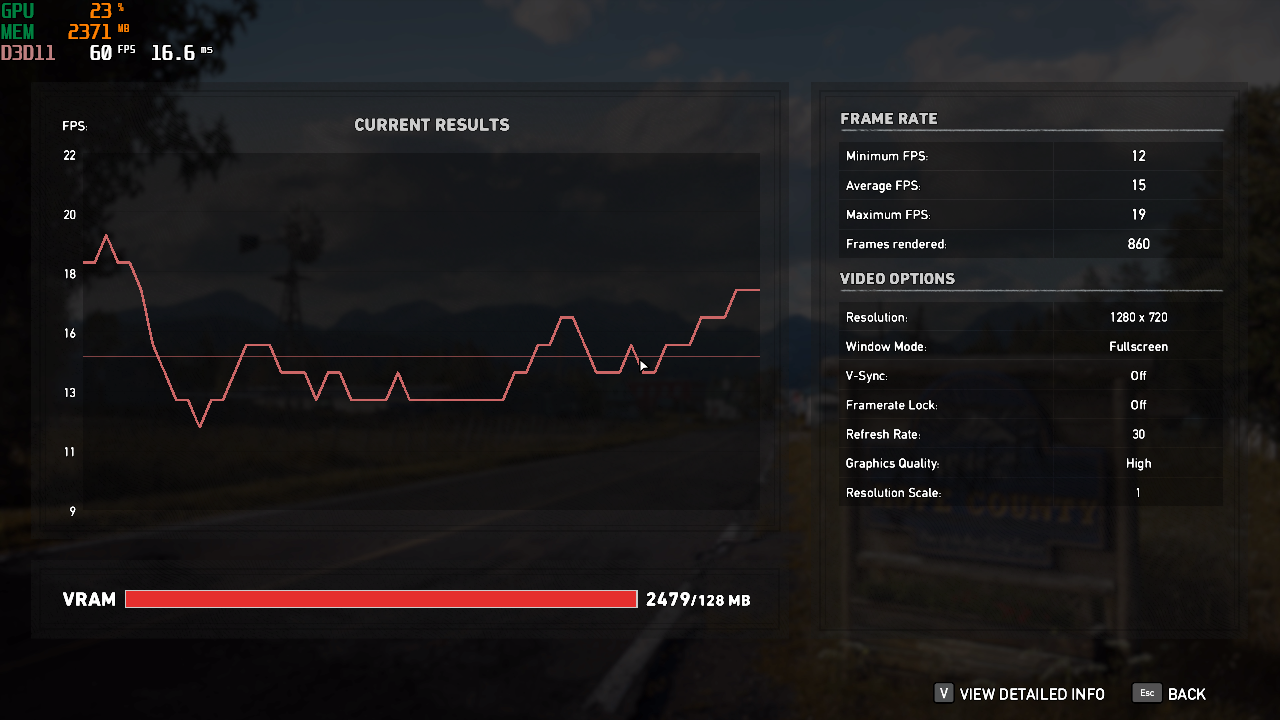
Core i9-10900K UHD 630 FarCry5 Benchmark 720P :15fps
內顯測試效能比較表 單位:Score & fps(數字愈大愈好)

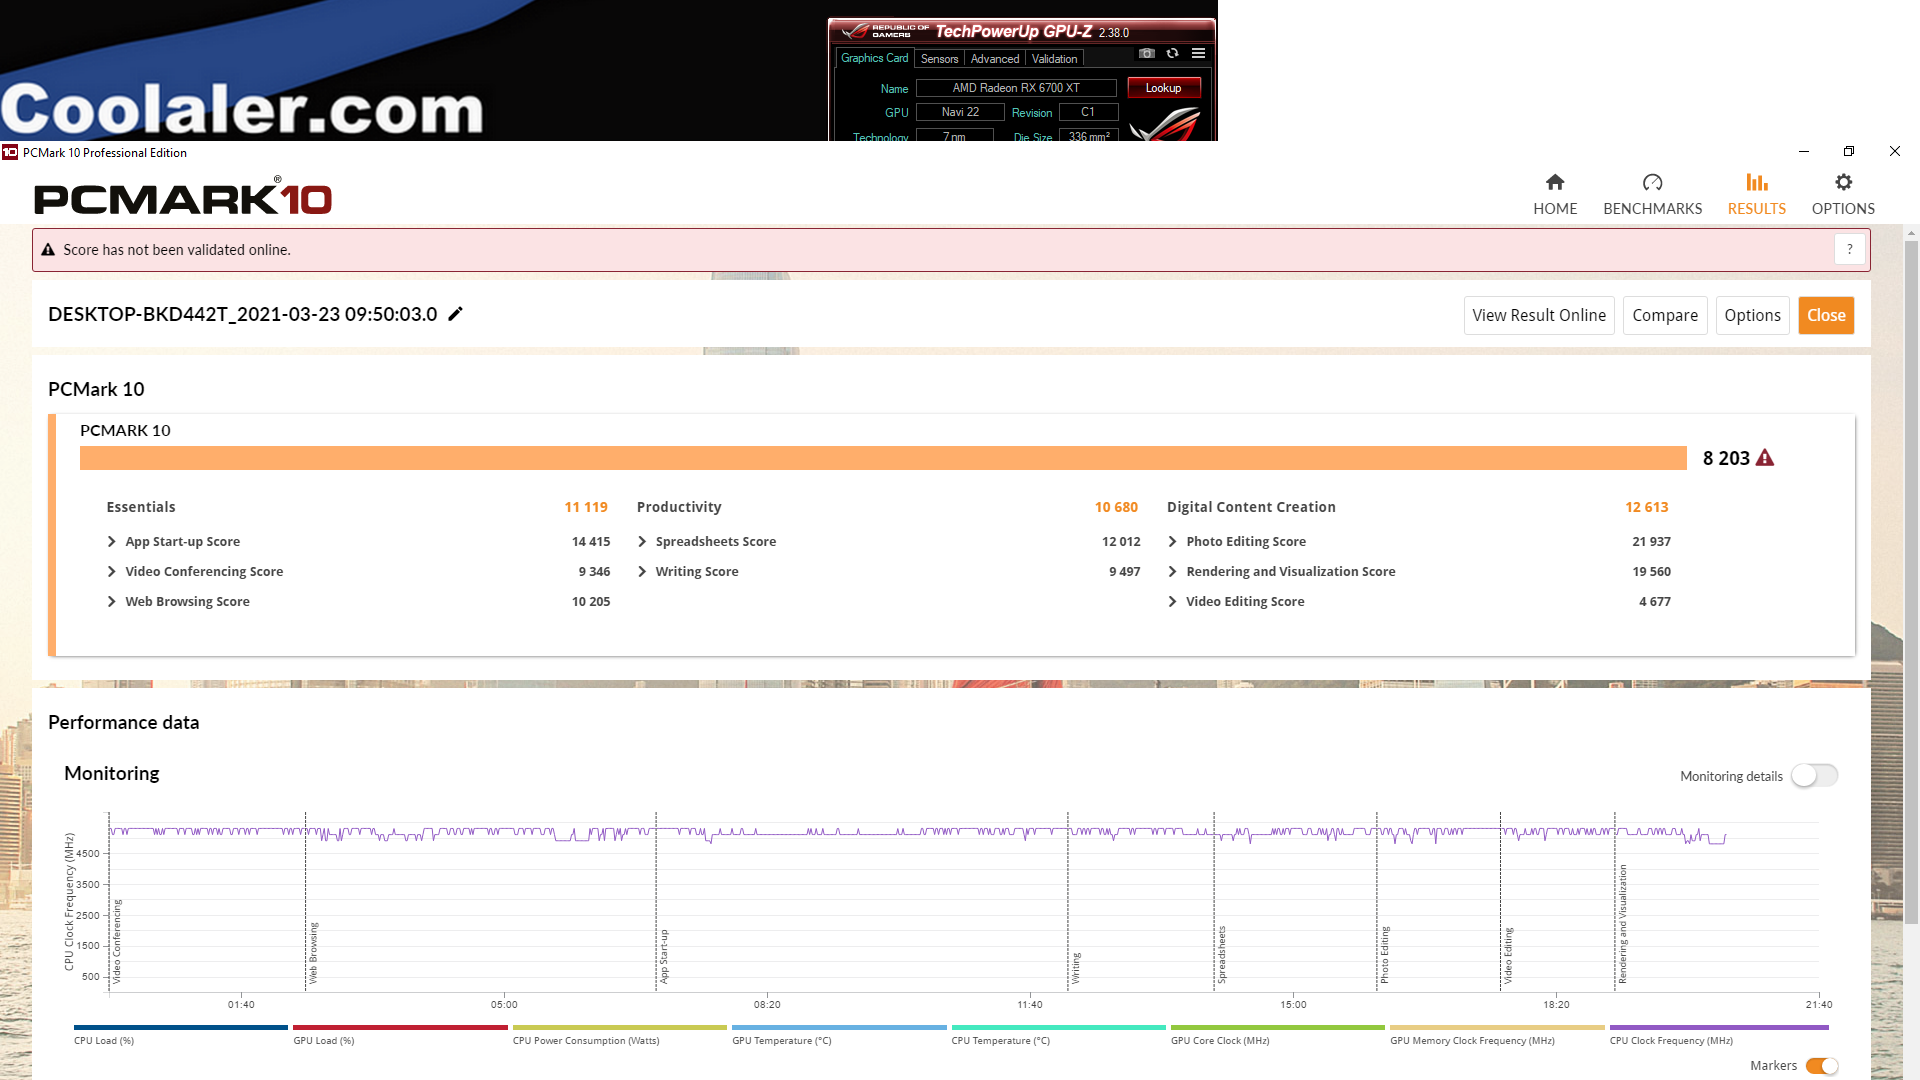
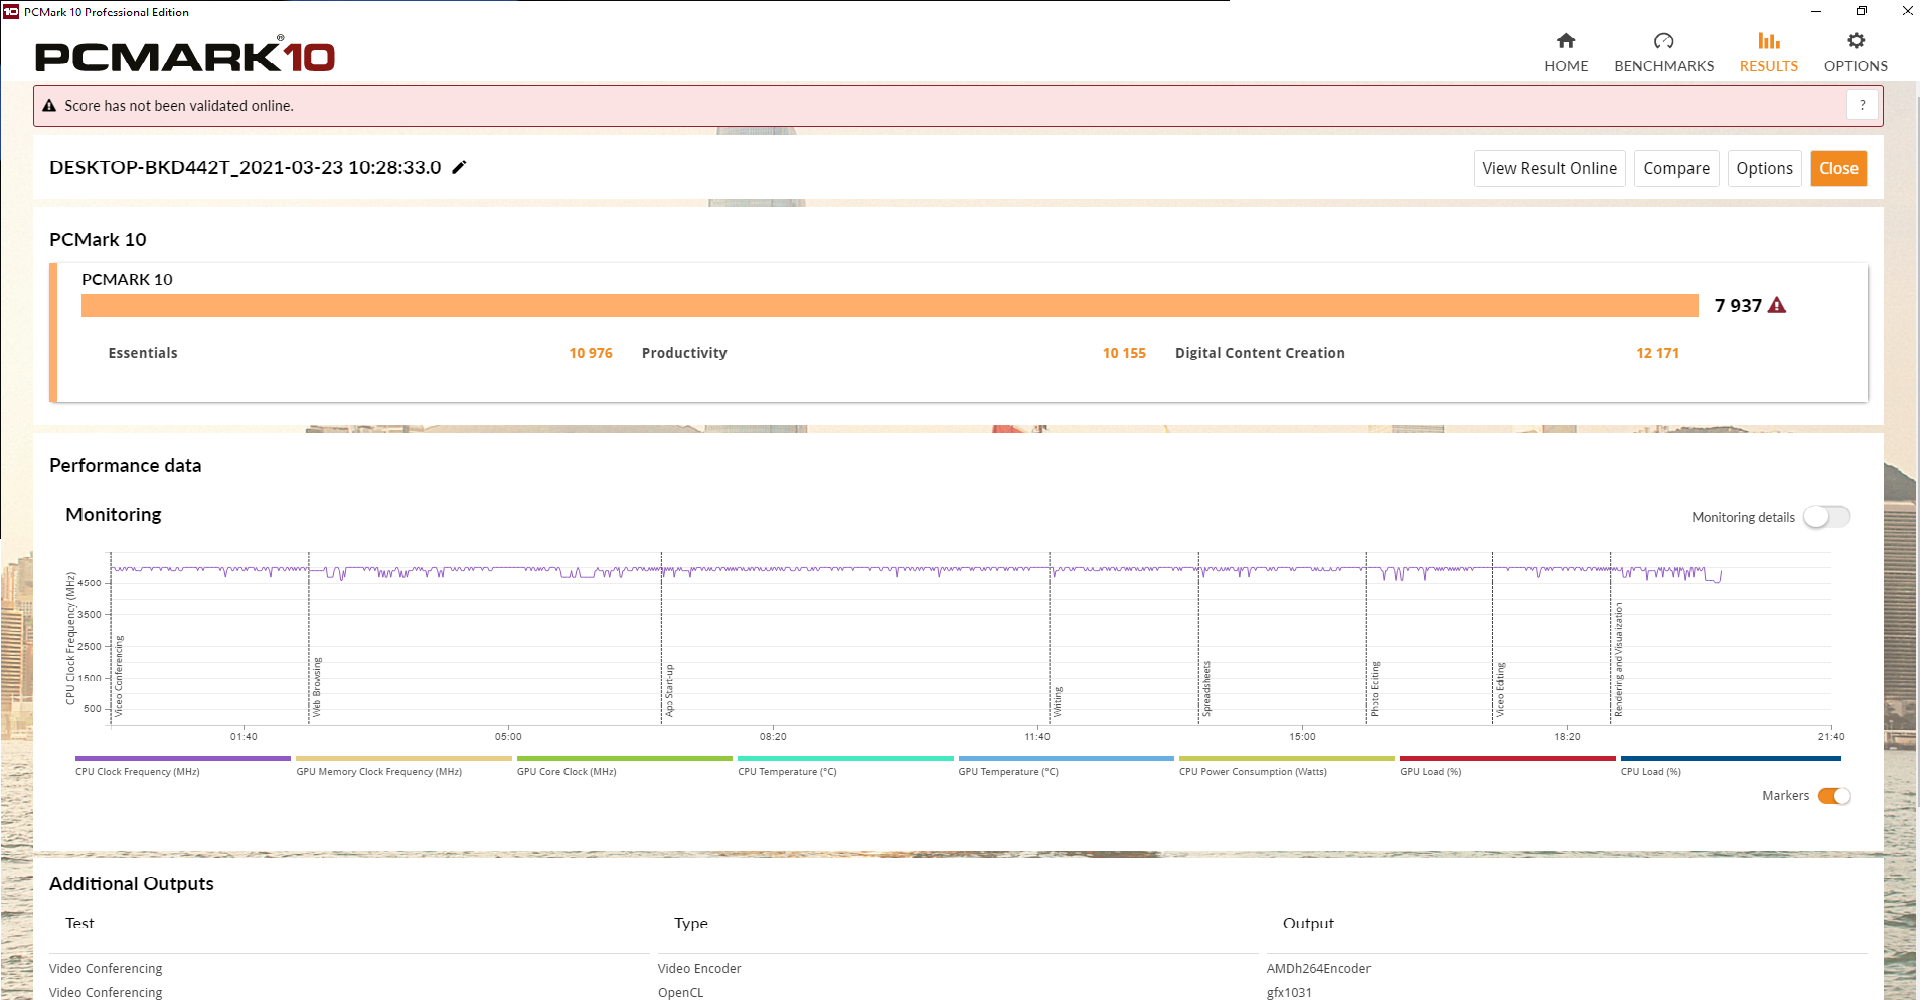
D.PCMARK10
PCMark是由 UL開發的計算機基準測試工具用於在系統和組件級別測試 PC的性能,而 PCMark 10是 Windows PC 的系統基準,其測試重點是當今辦公室內常用的各種編輯軟體,它提供了三類的工作負載
1.「Essentials」 包括 Web瀏覽,視頻會議和應用程序啟動時間
2.「Productivity」包括基於電子表格和寫作的測試
3.「Digital Content Creation」包括照片編輯,視頻編輯以及渲染和可視化測試
11900K測試諸元
PCMARK10 Score
11700K測試諸元
PCMARK10 Score
11600K測試諸元
PCMARK10 Score
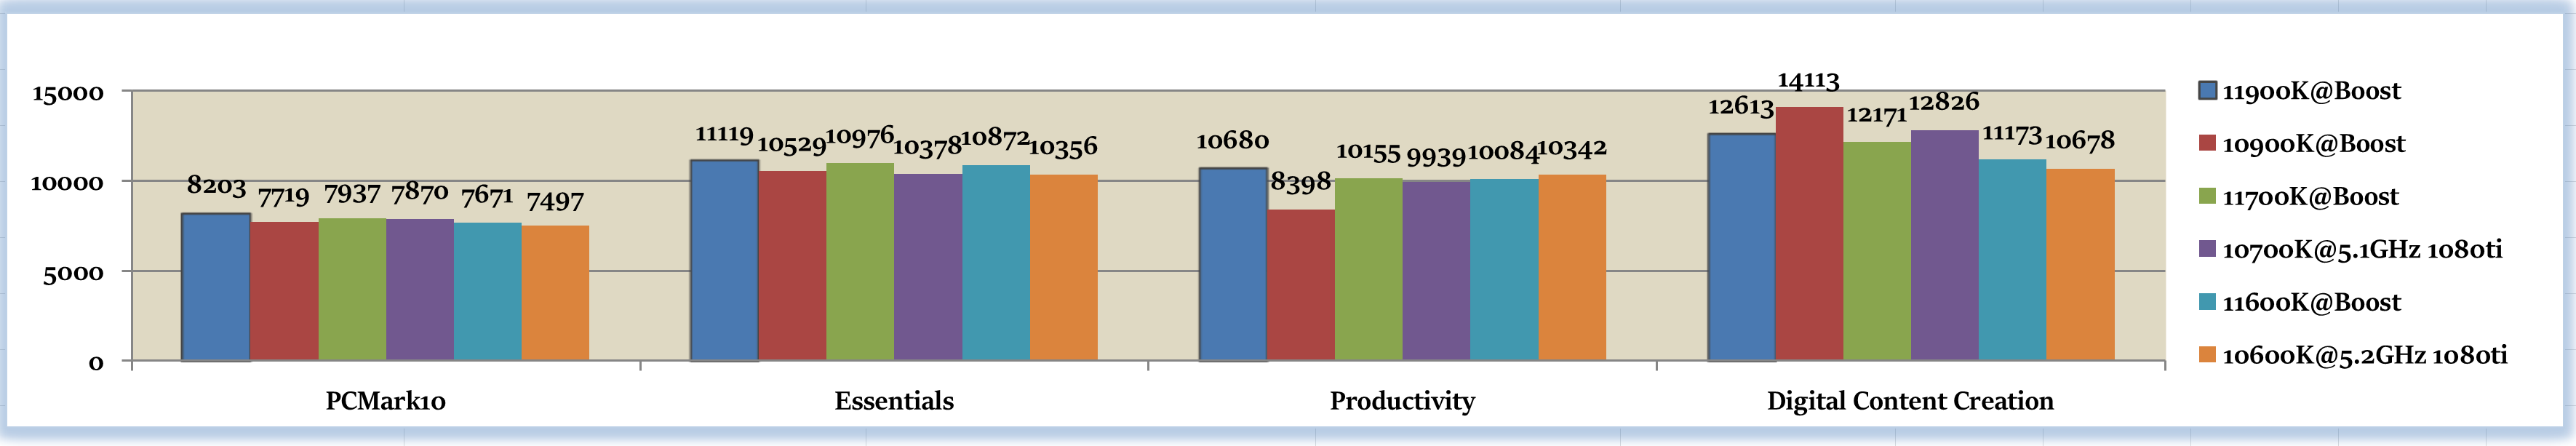
PCMARK10效能測試比較表 單位: Score(數字愈大愈好)
11700K其他測試
小結:
從以上測試結果來看,在預設下的全新 Core i9-11900K (KF) 桌上型處理器效能關鍵仍取決於 ABT之執行率與平台散熱環境,當開啟「Intel Adaptive Boost Technology」ABT之後我們可以從測試中看到,處理器之 All Core頻率高低與否將視程式之 Workload程度而有所不同,在 Cinebench R20測試時,處理器之全核心頻率落在 5.0GHz (屬於中度 Workload),而在 wPrime 2.10測試時則可見到全核心頻率維持在 5.1GHz (屬於輕度 Workload),在 CPU FPU Stress TEST測試時則見到處理器頻率大幅滑落到 4.5~ 4.8GHz之間 (屬於極重度 Workload)
這意味著在輕度負載時 Core i9-11900K (KF) 還是能在預設時達成 All Core 5.1GHz,這對提升預設時的效能大有幫助
以下列出Core i9-11900K (KF) 之亮點
Core i9-11900K@Boost Idle時頻率為 5.3GHz而記憶體使用 DDR4 5333 C22 XMP
HWiNFO64
CPUMark99時亦同
在執行 CPU-Z Bench測試時仍能見到某些核心在 5.3GHz運作
在 wPrime 2.10測試則可見到在 ABT運作下之全核心頻率 5.1GHz
Core i9-11900K@Boost 執行CPU-Z Bench成績 Single Thread 702.8 Multi Thread 6597.4
Intel Core i9-11900K與上一代 Intel Core i9-10900K相同的是其 Boost頻率均為 5.3GHz (Intel Thermal Velocity) ,同時也是專為遊戲打造的桌上型處理器,不同的則是 Core i9- 11900K之核心數比 Core i9-10900K少了 2顆,雖然如此但其在遊戲效能上仍不讓 Intel Core i9-10900K與 Ryzen 5 5800X專美於前,在使用 ASUS ROG STRIX RTX 3090 O24G GAMING做 Gaming測試時 Core i9- 11900K@5.2GHz vs Ryzen 7 5800X@4.725GHz全勝,唯在對上老大哥 Core i9- 10900K 實則因為少了 2顆核心數則敗下陣來,而在以 RX 6900 XT在 GIGABYTE Z590 AORUS XTREME做比較時 Core i9- 11900K vs Ryzen 7 5800X則是勝多負少,以下以 FarCry5為例看 Core i9- 11900K vs Ryzen 7 5800X在 RX 6900 XT的比較表,仍是 11900K勝出
Far Cry 5 1080P比較表 單位 : fps(數字愈大愈好)
Assassin's Creed Origins Benchmark 1080P比較表 單位 : Score(數字愈大愈好)
在內顯方面 UHD 750效能大幅超越 UHD 630 35%~+60%不等
內顯測試效能比較表 單位: Score & fps(數字愈大愈好)
而身為 Cypress Cove架構,內建 Xe GPU並擁有 PCIe 4.0通道 20 Lanes,其中 PCIe 4.0 x4支援 M.2 NVMe SSD,PCIe 4.0 x16則分配給顯示卡也給 11900K大大的加分,而在搭配 GIGABYTE AORUS NVMe GEN4 SSD 1TB時效能更是亮麗
11900K@PCIe 4.0X4 CrystalDiskMark
GIGABYTE AORUS NVMe GEN4 SSD 1TB PCIe 4.0 M.2 SSD CrystalDiskMark測試比較表 單位:MB/S(數字愈大愈好)
在記憶體超頻方面, GIGABYTE的表現令人寡目相看,可以 DDR4 5333 XMP直開
AIDA64 Cache & Memory Benchmark比較表 單位:MB/S (數字愈大愈好)
以救援之姿上場的末代 14nm處理器「Rocket Lake-S」在單線程的表現上還是能與友商 Ryzen 5000系列處理器相抗衡的,期待第 12代的 Intel Alder Lake能夠再次華麗轉身在多線程上也超越對手
本篇完,請繼續關注「Rocket Lake-S」相關評測,謝謝收看
Intel Core i9-11900K Boost 5.3GHz ABT探討及 DDR4 5333、PCI-E Gen4、UHD750測試,華碩篇
Intel Core i5-11600K 5.2GHz DDR4 5333超頻測試並與 Core i9-10900K 5.2GHz AMD Ryzen 5 5800X 4.725GHz遊戲比較
全新第 11代 Intel® Core™系列桌上型處理器 「Rocket Lake-S」 已於今日效能解禁,有關處理器開箱以及主機板介紹的部分已經在先前發表,這裡就不再贅述
「Rocket Lake-S」為全新 「Cypress Cove」微架構重新封裝,並加入 AVX-512指令集,這也是 AVX-512指令集第一次出現在桌上型處理器上
「Rocket Lake-S」擁有 PCIe 4.0 20 Lanes,其中 PCIe 4.0 x4分配給 M.2 NVMe SSD,PCIe 4.0 x16則分配給顯示卡,內顯為最新 Xe GPU GT1 (UHD 750),擁有 32個 EU,Intel表示,全新「Cypress Cove」架構的「Rocket Lake-S」在 IPC方面比「Comet Lake-S」有不少的性能提升,至於實際狀況如何則有待本篇測試分曉
身為「Rocket Lake-S」之旗艦型處理器的 Core i9-11900K (KF)在超頻及散熱的表現不亞於 Intel Core i9-10900K (KF),但因為兩者之核心數不同,因此在多線程的效能上自然會有差別,唯 Core i9-11900K (KF)的表現仍然值得期待
11代處理器與 10代處理器的不同點
在 500 Series Chip方面的更新比較
建議使用 B560以上的晶片組主機板效能較完善
「Rocket Lake-S」產品線規格及建議售價
Core i9-11900K建議售價 $539美元
Core i7-11700K建議售價 $399美元
Core i9-11900K (KF)之核心數為 8C/16T,基礎頻率 3.9GHz,Turbo Boost (TB3) 5.3GHz,開啟「Intel Adaptive Boost Technology」在符合散熱需求時可 All Core 5.1GHz ,「Intel Adaptive Boost Technology」目前僅支援 Core i9-11900K (KF)處理器,Core i9-11900K (KF)之 L2 Cache 4MB,L3 Cache 16MB
Intel Core i9-11900K (KF) 與上一代 Intel Core i9-10900K (KF)相同的是兩者之 Boost (TB3)頻率均為 5.3GHz,不同的是 Intel在 Core i9-11900K (KF) 身上新增了 「Intel Adaptive Boost Technology」 (ABT),以及核心數量則較 Core i9-10900K (KF) 之 10C/20T少了 2顆
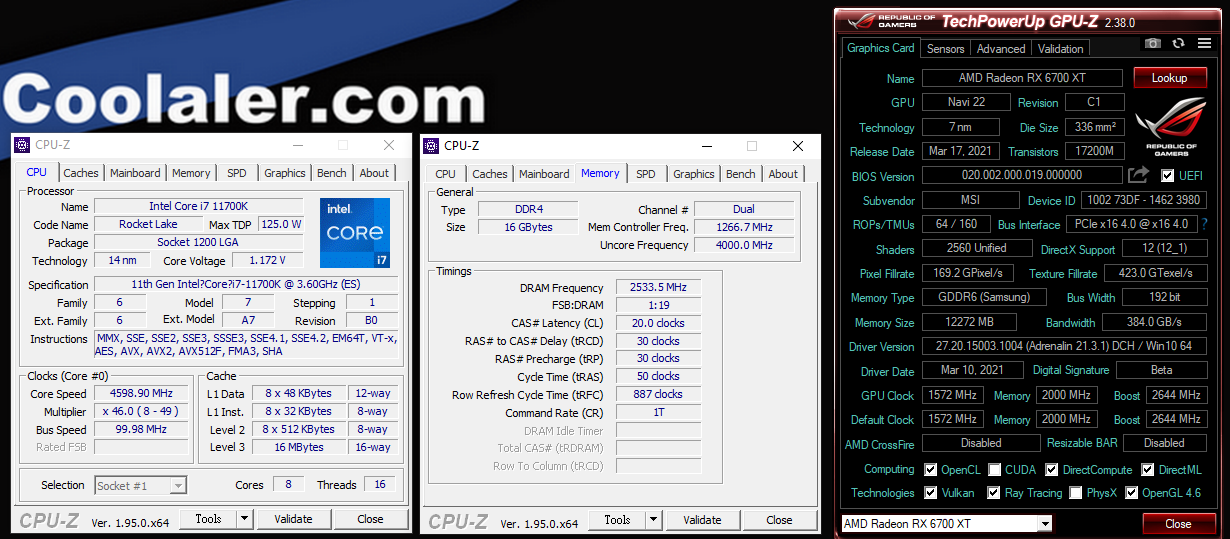
Core i7-11700K之核心數為 8C/16T,基礎頻率 3.8GHz,Turbo Boost (TB3) 5.0GHz L2 Cache 4MB,L3 Cache 16MB
Core i7-11700K之核心數則與上一代 Intel Core i7-10700K相同均為 8C/16T,但 11700K 之 Boost (TB3) 頻率為 5.0GHz
Core i5-11600K建議售價 $262美元
Core i5-11600K建議售價 $262美元
Core i5-11600K之核心數為 6C/12T,基礎頻率 4.1GHz,Turbo Boost (TB3) 4.9GHz L2 Cache 3MB,L3 Cache 12MB
Intel Core i5-11600K與 Intel Core i5-11600K相比,Intel Core i5-11600K Boost頻率為 4.9GHz (Intel Thermal Velocity) ,而Intel Core i5-110600K Boost頻率為 4.8GHz,兩者均是專為遊戲打造的桌上型處理器
i3 & Pentium Gold $64~$154美元
Core i9-11900K與 Core i5-11600K SPEC比較表
Intel「Rocket Lake-S」處理器預設頻率模式介紹
「Rocket Lake-S」在預設時有以下幾種預設頻率,尤其是新增的「Intel Adaptive Boost Technology (ABT)值得關注
1.「基礎頻率」
處理器在在預設下運行的最低頻率即為基礎頻率,其功耗將不高於處理器的 TDP額定值
2 .「Turbo Boost 2.0」(TB2)
Turbo Boost 2.0會讓處理器運行在比基礎頻率更高的頻率上運作,頻率增加之幅度將視使用的核心數目而異
3.「Turbo Boost 3.0」(TB3)
Turbo Boost 3.0 (TB3)會讓最佳核心能提供比其他核心更高的 Turbo boost能力,對於核心數量較多的處理器而言,各個核心之間會存在些許體質差異,以 Core i9-11900K (KF)為例,在 Turbo Boost 3.0模式下,Turbo Boost 3.0會讓處理器中的 1~2個核心運行在 5.3GHz以獲得最佳效能
4.「Thermally Velocity Boost」(TVB)
「Intel Thermal Velocity Boost」會根據處理器在極限溫度以下運行時間的長短,以及 Turbo Boost加速功耗限制是否還有剩餘,在單核心、多核心 Turbo Boost的基礎之上,適時、自動地繼續提升單個核心的頻率,具體提頻幅度、時間取決於工作負載、處理器規格、散熱條件,當「Thermal Velocity Boost」 (TVB) 運作時,如果處理器上檢測到的峰值熱溫度低於設定值 (桌機為 70ºC)則處理器將會在比基礎頻率高 100MHz的頻率上運作
5.「Intel Adaptive Boost Technology」(ABT)
「Intel Adaptive Boost Technology」為第 11代 Core i9-11900K (KF)處理器之獨有新功能,當在 BIOS中開啟「Intel Adaptive Boost Technology」(ABT) 時,如果 Core i9-11900K (KF)之散熱符合需求,則 Core i9-11900K (KF)處理器將能運行在 All Core 5.1GHz (但能需視程式之 Workload多寡而定)
如果散熱符合需求,憑著「Intel Adaptive Boost Technology」將可使 Core i9-11900K (KF) 兩款 K級處理器除了在預設時有 2個核心達到 5.3GHz之外,而其餘的 6個核心則會在 5.1GHz運作,這意味著 Core i9-11900K (KF) 在預設時即可在 All Core 5.1GHz下運作,但是否能通過所有的負載測試則有待測試驗證
BIOS開啟 Intel ABT方式
Intel Core i9-11900K與上一代 Intel Core i9-10900K相同的是其 Boost頻率均為 5.3GHz (Intel Thermal Velocity) ,同時也是專為遊戲打造的桌上型處理器,不同的是 Core i9- 11900K之核心數為 8C/16T,較 Core i9-10900K之 10C/20T少了 2顆
Core i7-11700K與上一代 Intel Core i9-10700K的核心數均為 8C/16T,11700K Boost頻率為 5.0GHz (Intel Thermal Velocity) ,均是專為遊戲打造的桌上型處理器
身為「Rocket Lake-S」旗艦型處理器 Core i9-11900K同樣因為增加了 IHS厚度並降低 CPU die的關係,使其在超頻及散熱的表現仍不遜於 Intel Core i9-10900K
本次測試的主機板與處理器寫真
Intel Core i9-11900K
Intel Core i5-11600K
Intel Core i9-11900K開箱照
正式版 Intel Core i9-11900K
正式版 Intel Core i9-10900K
測試項目
A.「Intel Adaptive Boost Technology」ABT測試
在預設下對 Core i9-11900K做 idle、Single core loading、Full loading等測試,以了解 Core i9-11900K在各項測試中的 ABT頻率、電壓、溫度、功耗、效能表現
1.AIDA64 Cache & Memory Benchmark
2.Superpi 32M
3.Cinebench R15 & R20 CPU Test
4.CPU-Z Bench
5.CPUMark99
6.GIGABYTE AORUS 電競 NVMe Gen4 M.2 SSD 1TB固態硬碟測試
7.Gaming Benchmark (GIGABYTE RX 6900XT GAMING OC 16G)
a.Far Cry 5 Benchmark
b.Rise of the Tomb Raider Benchmark
c.Assassin's Creed Origins Benchmark
d.UNIGINE Superposition Benchmark
e.3DMark Time Spy
f.3DMark Time Spy Extreme
g.Final Fantasy XV Benchmark
h.Middle-earth: Shadow of War Benchmark
B.Overclocking All Core 5.2GHz
在 All Core 5.2GHz下對 Core i9-11900K做超頻後的遊戲效能測試
1.Gaming Benchmark (ASUS ROG STRIX RTX 3090 O24G GAMING)
a.Far Cry 5 Benchmark《極地戰嚎5》
b.Rise of the Tomb Raider Benchmark《古墓奇兵:崛起》
c.Assassin's Creed Origins Benchmark《刺客教條:起源》
d.UNIGINE Superposition Benchmark
e.3DMark Time Spy
f.3DMark Time Spy Extreme
g.3DMark Port Royal
h.Final Fantasy XV Benchmark 《中土世界:戰爭之影》
i.Middle-earth: Shadow of War Benchmark
C.UHD 750內顯測試
a.Final Fantasy XV Lite mode 1080P
b.Final Fantasy XIV Lite mode 1080P
c.UNIGINE Superposition Benchmark 720P Low
d.FarCry5 Benchmark 720P
D.PCMARK10
Default測試平台
CPU:Intel Core i9-11900K
CPU:Intel Core i9-11900KF
CPU:Intel Core i7-11700K
CPU:Intel Core i5-11600K
CPU Cooler:GSKILL ENKI 360
10900K CPU Cooler:Thermalright Silver Arrow Extreme IB-E+Delta AFC1212DE X2 Fan
RAM:GSKILL Trident Z DDR4 4000 8GB X2 C18
MB:GIGABYTE Z590 AORUS TACHYON
MB:GIGABYTE Z590 AORUS XTREME
10900K MB:ASUS ROG MAXIMUS XII HERO WiFi
VGA:GIGABYTE RX 6900 XT GAMING OC 16G
SSD:GIGABYTE AORUS NVMe GEN4 SSD 1TB
PSU:ASUS ROG Thor 1200W
OS:Windows 10 64bit 20H2
GIGABYTE Z590 AORUS TACHYON上機照
Overclocking測試平台
CPU:Intel Core i9-11900K
11900K CPU Cooler:GSKILL ENKI 360
10900K CPU Cooler:Thermalright Silver Arrow Extreme IB-E+Delta AFC1212DE X2 Fan
RAM:GSKILL Trident Z DDR4 4000 8GB X2 C18
MB:GIGABYTE Z590 AORUS XTREME
10900K MB:ASUS ROG MAXIMUS XII HERO WiFi
VGA:GIGABYTE RX 6900 XT GAMING OC 16G
SSD:GIGABYTE AORUS NVMe GEN4 SSD 1TB
PSU:CORSAIR AX 1500i
OS:Windows 10 64bit 20H2
GIGABYTE Z590 AORUS XTREME上機照
A.「Intel Adaptive Boost Technology」ABT測試
CPU-Z資訊
Core i9-11900K@Boost Idle時頻率為 5.3GHz而記憶體使用 DDR4 5333 C22 XMP
HWiNFO64 info
CPUMark99
在執行 CPU-Z Bench測試時仍能見到 2個核心在 5.3GHz運作
Core i9-11900K@Boost 執行單線程 Superpi32M時
「Intel Adaptive Boost Technology」ABT測試
在 Cinebench R20測試剛開始時全核心頻率還在 5.1GHz
但在溫度迅速爆升之後全核心頻率落在 5.0GHz
在 wPrime 2.10測試則可見到全核心頻率 5.1GHz,比在 R20的測試高了 100MHz All Core,這可視為因為兩者 Workload大小不同而有所差別
在 CPU FPU Stress TEST測試時則因為 Workoad之全速運作,而使 All core頻率大幅滑落到 4..5~ 4.8GHz之間,最大功耗 203W
從以上「Intel Adaptive Boost Technology」ABT之測試比較中我們可以看到,處理器之 All Core頻率高低與否將視程式之 Workload程度,以及散熱環境是否符合需求而有所不同,在 Cinebench R20測試時,處理器之全核心頻率落在 5.0GHz (屬於中度 Workload),而在 wPrime 2.10測試時則可見到全核心頻率維持在 5.1GHz (屬於輕度 Workload),在 CPU FPU Stress TEST測試時則見到處理器頻率大幅滑落到 4.5~ 4.8GHz之間 (屬於極重度 Workload)
1.AIDA64 Cache & Memory Benchmark
AIDA64 Cache & Memory Benchmark可測量 CPU高速緩存和系統內存的帶寬和延遲。通過雙擊窗口中的任何矩形,列或行,我們可以單獨啟動基準測試或基準測試類型。例如,如果我們雙擊 “Memory”,則只會運行系統內存讀取,寫入,複製和延遲基準測試,即只執行給定行中的操作。同樣,如果我們雙擊 “Read”,則只會對所有內存類型運行讀取基準測試,即只執行給定列中的操作。如果我們雙擊任何矩形,則只會運行選定的單個基準
右鍵單擊 “Start Benchmark”按鈕將打開一個上下文菜單,我們可以在其中選擇運行所有基準測試或僅運行內存或緩存基準測試
以 11900K為例 Core i9-11900K@Boost DDR4 5333 C22頻寬
Read.76,522MB/s
Write.76,504B/s
Copy.62,764MB/s
Latency. 52.2ns
以 11700K為例 Core i7-11700K@Boost DDR4 5333 C22頻寬
Read.74,062MB/s
Write.76,004B/s
Copy.62,444MB/s
Latency. 52.6ns
對照組 10900K@Boost & DDR4 4000C18 AIDA64 Cache & Memory Benchmark
Read.53,769MB/s
Write.56,311MB/s
Copy.49,299MB/s
Latency 49.9ns
Ryzen 7 5800X DDR4 3600C14 AIDA64 Cache & Memory Benchmark
Read. 62,422MB/s
Write. 28,799MB/s
Copy. 52,768MB/s
Latency. 58.9ns
AIDA64 Cache & Memory Benchmark 比較表 單位:MB/S (數字愈大愈好)
Core i9-11900K@Boost 執行單線程 Superpi32M時亦見 5.1GHz
2.Superpi 32M
SuperPi 32m是一個計算圓周率的浮點運算程式,最大精確到小數點以後的 3200萬位數,該程式採用高斯-勒讓德演算法,並且於 1995年被日本電腦科學家金田康正使用 Windows環境下計算出精確到 232次方的圓周率,是一款在檢測單工效能時常用的程式,但在需要多工測試時亦可同時開啟多個程式同時運算
Core i9-11900K@Boost 單線程 Superpi32M成績 5m25.682s
對照組
Core i9-10900K@Boost 單線程 Superpi32M成績 7m13.458s
Ryzen 7 5800X@Boost SuperPi 32m Results 為 6m05s.837
SuperPi 32m比較表 單位 :分秒 (數字愈小愈好)
3.Cinebench R15 & R20 CPU Test
Cinebench是一個真實的跨平台測試套件,用於評估計算機的硬件功能,現有最新版本已至 R20版本,由於它是 以 Cinema 4D動畫製作軟體為基礎進行測試,所以能夠反應出多線程處理器與顯示卡面對實際應用軟體所能發揮的效能,且能在短時間內得知測試結果,是一個能快速得知是否能 All Core 5GHz的測試軟體
Cinebench Release 20的改進反映了近年來 CPU和渲染技術的整體進步,為 Cinema 4D利用多個 CPU核心和普通用戶可用的現代處理器功能提供了更準確的測量,最重要的是它是免費的
Core i9-11900K@Boost 執行多線程 Cinebench R15時為 All Core 4.7GHz 意即 Core i9-11900K預設不超頻時就能在 All Core 4.7GHz全核心運行
Core i9-11900K@Boost 執行單線程 Cinebench R15 1T時亦見 2 Core 5.1GHz
Core i9-11900K@Boost Cinebench R15單線程及多線程成績 1T 260b nT 2432cb
對照組 Core i9-10900K@Boost Cinebench R15單線程及多線程成績 1T 210cb nT 2647cb
Ryzen 7 5800X@Boost Cinebench R15 CPU test 2557cb Single Core 266cb
Cinebench R15 CPU test 1T比較表 單位:cb(數字愈大愈好)
Core i9-11900K@Boost 執行多線程 Cinebench R20時同樣為 All Core 4.7GHz 再次證實 Core i9-11900K預設不超頻時就能在 All Core 4.7GHz全核心運行
Cinebench R20 CPU test Results
Core i9-11900K@Boost 執行 Cinebench R20單線程及多線程成績 1T 642pts nT 6016pts
對照組 Core i9-10900K@Boost Cinebench R20單線程及多線程成績 1T 501pts nT 6378pts
Ryzen 7 5800X@Boost Cinebench R20 CPU test 6057pts Single Core 623pts
Cinebench R20 CPU test 1T比較表 單位 : pts(數字愈大愈好)
4.CPU-Z Bench
CPU-Z為一個中央處理器、記憶體及主機板資訊的 Windows軟體,在近年新增了 Bench item,提供處理器的快速簡單測試
Core i9-11900K@Boost 執行CPU-Z Bench成績 Single Thread 702.8 Multi Thread 6597.4
對照組 10900K@Boost CPU-Z Bench Single Thread 543.0Multi Thread 7457.5
Ryzen 7 5800X@Boost CPU-Z Bench Single Thread 671.0 Multi Thread 6640.3
CPU-Z Bench比較表 單位 : Score(數字愈大愈好)
5.CPUMark99
Core i9-11900K@Boost執行 CPUMark99測試時 3 Core為 5.1GHz
CPUMark99是專門用于 Windows的一款運算測試軟體,測試過程簡短且只支援單工
Core i9-11900K@Boost執行 CPUMark99成績 997分
對照組 Core i9-10900K@Boost執行 CPUMark99成績 879分
對照組 Ryzen 7 5800X@Boost 之 CPUMark99 為 870分
CPUMark99比較表 單位 : Score(數字愈大愈好)
6.GIGABYTE AORUS電競 NVMe Gen4 M.2 SSD 1TB固態硬碟測試
「Rocket Lake-S」另一個重大升級就是正式支援 PCIe 4.0,基於新的 500系列晶片組包括 Z590、B560、H510 等主機板,因此在搭配 500系列主機板的情況下,CPU部份可最多分出 20條 PCIe 4.0 Lanes,可滿足一張顯示卡及 x4 NVMe SSD的基本需求,同時原生支援 USB 3.2 Gen 2×2 ( 20G ),與 PCH相連的 DMI總線亦由 PCIe 3.0 x4速度升級到 PCIe 3.0 x8速度,而本項測試就是針對 11900K+Z590之 PCIe 4.0 M.2 NVMe SSD做測試比較
GIGABYTE AORUS NVMe GEN4 SSD 1TB
全球首款 PCIe 4.0×4控制晶片,Phison PS5016-E16控制晶片,採用 28nm製造技術製造。 先進的製造工藝確保PS5016-E16搭配最新的 3D TLC NAND快閃記憶體時具有足夠的 ECC容錯處理能力。PS5016-E16還具有 8個 NAND通道及 32個 CE targets,並可支援 DDR4 DRAM快取和 PCIe 4.0 x4介面。 而在其他功能部分,這顆全新控制器支援 NVMe 1.3協議、LDPC糾錯、損耗平均技術及超額配置技術,以提高固態硬碟的可靠性和耐用性
TOSHIBA BiCS4 NAND快閃記憶體顆粒透過增加層數至96層,來進行電路和架構最佳化,進而達到每單位面積更高的儲存空間。 AORUS NVMe Gen4 SSD固態硬碟的800MT / s吞吐量遠遠超過PCIe 3.0 x4設備,具有出色的儲存效能。憑藉新的PCIe 4.0介面控制晶片,AORUS NVMe Gen4 SSD固態硬碟可提供高達 5000 MB/秒的循序讀取速度和高達4400 MB/秒的循序寫入速度。PCIe 4.0 固態硬碟的順序讀取性能比PCIe 3.0 固態硬碟快40%。可提供更快、更順暢的遊戲串流和圖形密集渲染體驗,讓玩家為下一代的電腦運算做好準備
全包覆式純銅散熱片同時為配置在固態硬碟正反面的控制晶片和 NAND記憶顆粒等關鍵組件的進行散熱。與鋁製散熱器相比,純銅散熱片具有傳熱能力提高 69%,讓 AORUS NVMe Gen4 SSD固態硬碟獲得最佳的讀/寫散熱性能。相較於一般小型 M.2散熱片,AORUS NVMe Gen4 SSD固態硬碟採用的新型高效純銅散熱片,搭配正面的 27道剖溝,大幅增加了散熱表面積,讓固態硬碟在高速運作下產生的廢熱可以有效傳輸到散熱片,進而更快地獲得更好的熱平衡。此外,最佳化的剖溝角度設計,讓散熱片可以與不同方向的系統風流方向進行大量且快速的熱交換。 這兩種獨特的設計確保了PCIe 4.0 固態硬碟的關鍵零件能夠在超高傳輸速率下保持最佳的工作溫度
全新的 SSD Toolbox應用程式,可以讓使用者監控和管理包括型號、韌體版本、運作狀況等技嘉固態硬碟的各項數據,讓玩家可以隨時掌握固態硬碟的使用狀態及相關安全係數或使用安全抹除功能清除所有資料。 您可以從支持頁面下載 SSD Tool Box使用
11900K@GIGABYTE AORUS NVMe GEN4 SSD 1TB CrystalDiskMarkinfo PCIe 4.0X4 Benchmark
11900K@PCIe 4.0X4 CrystalDiskMark
對照組 10900K@GIGABYTE AORUS NVMe GEN4 SSD 1TB CrystalDiskMarkinfo PCIe 3.0X4 Benchmark
5800X@GIGABYTE AORUS NVMe GEN4 SSD 1TB CrystalDiskMarkinfo PCIe 4.0X4 Benchmark
5800X CrystalDiskMark PCIe 4.0X4
GIGABYTE AORUS NVMe GEN4 SSD 1TB PCIe 4.0 M.2 SSD CrystalDiskMark測試比較表 單位:MB/S(數字愈大愈好)
7.Gaming Benchmark
測試諸元:
Core i9-11900K@Boost
對照組
Core i9-10900K@Boost
Ryzen 7 5800X@Boost
a.Far Cry 5 Benchmark
Far Cry 5 Benchmark《極地戰嚎5》
Far Cry 5《極地戰嚎5》是一個自帶 Benchmark的新遊戲,是由育碧蒙特婁、育碧多倫多開發和育碧軟體發行的開放世界第一人稱動作冒險遊戲
1080P Far Cry 5 Benchmark Ave Results
Core i9-11900K@Boost 1080P Far Cry 5 1080P Benchmark Ave 158fps
對照組
Core i9-10900K@Boost 1080P Far Cry 5 1080P Benchmark Ave 155fps
Ryzen 7 5800X@Boost
1080P Far Cry 5 1080P Benchmark Ave 151fps
Far Cry 5 1080P比較表 單位 : fps(數字愈大愈好)
Far Cry 5 Benchmark 4K Ave Results
Core i9-11900K@Boost 4K Far Cry 5 Benchmark Ave 113ps
Core i9-10900K@Boost 4K Far Cry 5 Benchmark Ave 113ps
Ryzen 7 5800X@Boost
4K Far Cry 5 Benchmark Ave 114ps
Far Cry 5 4K比較表 單位 : fps(數字愈大愈好)
b.Rise of the Tomb Raider Benchmark
Rise of the Tomb Raider Benchmark《古墓奇兵:崛起》
Rise of the Tomb Raider《古墓奇兵:崛起》,是一款由晶體動力開發,微軟工作室和史克威爾艾尼克斯合作發行的動作冒險遊戲,同樣自帶測試軟體,本作是 2013年《古墓奇兵》的續作
Rise of the Tomb Raider Benchmark 1080P Overall fps Results
Core i9-11900K@Boost 1080P Rise of the Tomb Raider Benchmark Overall:228.52FPS
對照組 Core i9-10900K@Boost 1080P Rise of the Tomb Raider Benchmark Overall:243.34FPS
Ryzen 7 5800X@Boost
1080P Rise of the Tomb Raider Benchmark Overall:236.7FPS
Rise of the Tomb Raider Benchmark 1080P比較表 單位 : fps(數字愈大愈好)
Rise of the Tomb Raider Benchmark 4K Overall fps Results
Core i9-11900K@Boost 4K Rise of the Tomb Raider Benchmark Overall:110.76FPS
對照組
Core i9-10900K@Boost 4K Rise of the Tomb Raider Benchmark Overall:141.47FPS
Ryzen 7 5800X@Boost
4K Rise of the Tomb Raider Benchmark Overall:112.97FPS
Rise of the Tomb Raider Benchmark 4K比較表 單位 : fps(數字愈大愈好)
c.Assassin's Creed Origins Benchmark
Assassin's Creed Origins《刺客教條:起源》中國大陸譯作「刺客信條:起源」)是一部由育碧蒙特婁開發由育碧公司發行的動作冒險遊戲
本作是刺客教條主系列的第十部作品,也是系列首次把時間線推前到刺客教條初代以前,同樣也自帶有測試軟體,遊戲的舞台是在托勒密王朝埃及豔后統治下的埃及,玩家所操控的角色是一位隸屬於法老的護衛,稱為守護者(Medjai),來自錫瓦(Siwa)名為巴耶克(Bayek)的埃及刺客
Assassin's Creed Origins Benchmark 1080P Results
Core i9-11900K@Boost 1080P Assassin's Creed Origins Benchmark :10205分
對照組 Core i9-10900K@Boost 1080P Assassin's Creed Origins Benchmark :9832分
Ryzen 7 5800X@Boost
1080P Assassin's Creed Origins Benchmark :9427分
Assassin's Creed Origins Benchmark 1080P比較表 單位 : Score(數字愈大愈好)
Assassin's Creed Origins Benchmark 4K Results
Core i9-11900K@Boost 4K Assassin's Creed Origins Benchmark:9485分
對照組 Core i9-10900K@Boost 4K Assassin's Creed Origins Benchmark:9240分
Ryzen 7 5800X@Boost
4K Assassin's Creed Origins Benchmark:8914分
Assassin's Creed Origins Benchmark 4K比較表 單位 : Score(數字愈大愈好)
d.UNIGINE Superposition Benchmark
UNIGINE是一款專有的跨平台遊戲引擎,由俄羅斯軟件公司 UNIGINE Corp開發。除了用作遊戲引擎外,它還用於虛擬現實系統,嚴肅遊戲和可視化
UNIGINE最強大的功能是它的高級渲染器,支持 OpenGL 4.0和 DirectX 11,Superposition則為 2017版本,包含極端性能和穩定性測試:視頻卡,電源,冷卻系統,檢查預設和超頻模式與真實負載及在環境中的互動體驗
UNIGINE Superposition Benchmark 1080P Extreme Results
Core i9-11900K@Boost 1080P UNIGINE Superposition Benchmark Extreme:10833分
對照組 Core i9-10900K@Boost 1080P UNIGINE Superposition Benchmark Extreme:10945分
Ryzen 7 5800X@Boost 1080P UNIGINE Superposition Benchmark Extreme:11056分
UNIGINE Superposition Benchmark 1080P Extreme比較表 單位 : Score(數字愈大愈好)
UNIGINE Superposition Benchmark 4K Optimazed Results
Core i9-11900K@Boost 4K UNIGINE Superposition Benchmark:15060分
對照組 Core i9-10900K@Boost 4K UNIGINE Superposition Benchmark:15265分
Ryzen 7 5800X@Boost 4K UNIGINE Superposition Benchmark:15455分
UNIGINE Superposition Benchmark 4K Optimazed比較表 單位 : Score(數字愈大愈好)
e.3DMark Time Spy & Extreme
3DMark Time Spy用來測試處理器及顯示卡之 3D圖形表現和工作負載,現由 UL擁有,主要是針對 DirectX 12的效能,測試有三個部分,第一個為顆粒陰影、曲面細分等效果,第二個則是光線追蹤的體積光照明技術,最後則是 CPU效能測試,在前兩個測試中,包含了數千萬個頂點跟多邊形,上百萬個曲面細分,這些都是 FireStrike的幾十倍,而 3DMark Time Spy Extreme是 3DMark Time Spy的 4K版本,所有圖形都是 4K規格
3DMark Time Spy Benchmark Results Core i9-11900K@Boost 3DMark Time Spy:16692分
對照組 3DMark Time Spy Benchmark Results Core i9-10900K@Boost 3DMark Time Spy:17585分
Ryzen 7 5800X@Boost 3DMark Time Spy:16900分
3DMark Time Spy Benchmark CPU Score比較表 單位 : Score(數字愈大愈好)
f.3DMark Time Spy Extreme
3DMark Time Spy Extreme Benchmark Results Core i9-11900K@Boost 3DMark Time Spy Extreme:8196分
對照組 3DMark Time Spy Extreme Benchmark Results Core i9-10900K@Boost 3DMark Time Spy Extreme:8495分
Ryzen 7 5800X@Boost 3DMark Time Spy Extreme:8186分
3DMark Time Spy Extreme Benchmark CPU Score比較表 單位 : Score(數字愈大愈好)
g.Final Fantasy XV Benchmark
Final Fantasy XV《太空戰士 15》的 Benchmark,是一款由史克威爾艾尼克斯在 2016年 11月推出的動作角色扮演遊戲《Final Fantasy系列》的第 15部,依照傳統,太空戰士都有 Benchmark的項目
Final Fantasy XV Benchmark 1080P Results Core i9-11900K@Boost 1080P Final Fantasy XV Benchmark:15271分
對照組 Final Fantasy XV Benchmark 1080P Results Core i9-10900K@Boost 1080P Final Fantasy XV Benchmark:15736分
Ryzen 7 5800X@Boost 1080P Final Fantasy XV Benchmark:15505分
Final Fantasy XV Benchmark 1080P比較表 單位 : Score(數字愈大愈好)
Final Fantasy XV Benchmark 4K Results
Core i9-11900K@Boost 4K Final Fantasy XV Benchmark:7406分
對照組 Core i9-10900K@Boost 4K Final Fantasy XV Benchmark:7383分
Ryzen 7 5800X@Boost 4K Final Fantasy XV Benchmark:7355分
Final Fantasy XV Benchmark 4K比較表 單位 : Score(數字愈大愈好)
h.Middle-earth: Shadow of War Benchmark《中土世界:戰爭之影》
Middle-earth: Shadow of War《中土世界:戰爭之影》亦為一自帶 Benchmark的角色扮演遊戲,是由 Monolith Productions開發並由華納兄弟互動娛樂發行並於 2017年 10月 10日在全球發布
Middle-earth: Shadow of War Benchmark 1080P Results Core i9-11900K@Boost 1080P Middle-earth: Shadow of War Benchmark:187fps
對照組 Middle-earth: Shadow of War Benchmark 1080P Results Core i9-10900K@Boost 1080P Middle-earth: Shadow of War Benchmark:194fps
Ryzen 7 5800X@Boost 1080P Middle-earth: Shadow of War Benchmark:210fps
Middle-earth: Shadow of War Benchmark 1080P比較表 單位 : Score(數字愈大愈好)
Middle-earth: Shadow of War Benchmark 4K Results
Core i9-11900K@Boost 4K Middle-earth: Shadow of War Benchmark:98fps
對照組 Core i9-10900K@Boost 4K Middle-earth: Shadow of War Benchmark:103fps
Ryzen 7 5800X@Boost 4K Middle-earth: Shadow of War Benchmark:105fps
Middle-earth: Shadow of War Benchmark 1080P比較表 單位 : Score(數字愈大愈好)
B.Overclocking All Core 5.2GHz
1.Gaming Benchmark
測試諸元:
Core i9-11900K@All Core 5.2GHz
對照組
Ryzen 7 5800X@All Core 4.725GHz
Ryzen 5 5600X@All Core 4.7GHz
a.Far Cry 5 Benchmark
Far Cry 5 Benchmark《極地戰嚎5》
Far Cry 5《極地戰嚎5》是一個自帶 Benchmark的新遊戲,是由育碧蒙特婁、育碧多倫多開發和育碧軟體發行的開放世界第一人稱動作冒險遊戲
1080P Far Cry 5 Benchmark Ave Results
Core i9-11900K@All Core 5.2GHz 1080P Far Cry 5 1080P Benchmark Ave 168fps
對照組 Core i9-10900K@All Core 5GHz 1080P Far Cry 5 1080P Benchmark Ave 165fps
Ryzen 7 5800X@All Core 4.725GHz
1080P Far Cry 5 1080P Benchmark Ave 156fps
Far Cry 5 1080P比較表 單位 : fps(數字愈大愈好)
Far Cry 5 Benchmark 4K Ave Results
Core i9-11900K@All Core 5.2GHz 4K Far Cry 5 Benchmark Ave 112ps
對照組 Core i9-10900K@All Core 5GHz 4K Far Cry 5 Benchmark Ave 113ps
Ryzen 7 5800X@All Core 4.725GHz
4K Far Cry 5 Benchmark Ave 114ps
Far Cry 5 4K比較表 單位 : fps(數字愈大愈好)
b.Rise of the Tomb Raider Benchmark
Rise of the Tomb Raider Benchmark《古墓奇兵:崛起》
Rise of the Tomb Raider《古墓奇兵:崛起》,是一款由晶體動力開發,微軟工作室和史克威爾艾尼克斯合作發行的動作冒險遊戲,同樣自帶測試軟體,本作是 2013年《古墓奇兵》的續作
Rise of the Tomb Raider Benchmark 1080P Overall fps Results
Core i9-11900K@All Core 5.2GHz 1080P Rise of the Tomb Raider Benchmark Overall:237.57fps
對照組 Core i9-10900K@All Core 5GHz 1080P Rise of the Tomb Raider Benchmark Overall:247.32fps
Ryzen 7 5800X@All Core 4.725GHz
1080P Rise of the Tomb Raider Benchmark Overall:258.56fps
Rise of the Tomb Raider Benchmark 1080P比較表 單位 : fps(數字愈大愈好)
Rise of the Tomb Raider Benchmark 4K Overall fps Results
Core i9-11900K@All Core 5.2GHz 4K Rise of the Tomb Raider Benchmark Overall:110.33fps
對照組 Core i9-10900K@All Core 5GHz 4K Rise of the Tomb Raider Benchmark Overall:113.04fps
Ryzen 7 5800X@All Core 4.725GHz
4K Rise of the Tomb Raider Benchmark Overall:112.17fps
Rise of the Tomb Raider Benchmark 4K比較表 單位 : fps (數字愈大愈好)
c.Assassin's Creed Origins Benchmark
Assassin's Creed Origins《刺客教條:起源》中國大陸譯作「刺客信條:起源」)是一部由育碧蒙特婁開發由育碧公司發行的動作冒險遊戲
本作是刺客教條主系列的第十部作品,也是系列首次把時間線推前到刺客教條初代以前,同樣也自帶有測試軟體,遊戲的舞台是在托勒密王朝埃及豔后統治下的埃及,玩家所操控的角色是一位隸屬於法老的護衛,稱為守護者(Medjai),來自錫瓦(Siwa)名為巴耶克(Bayek)的埃及刺客
Assassin's Creed Origins Benchmark 1080P Results
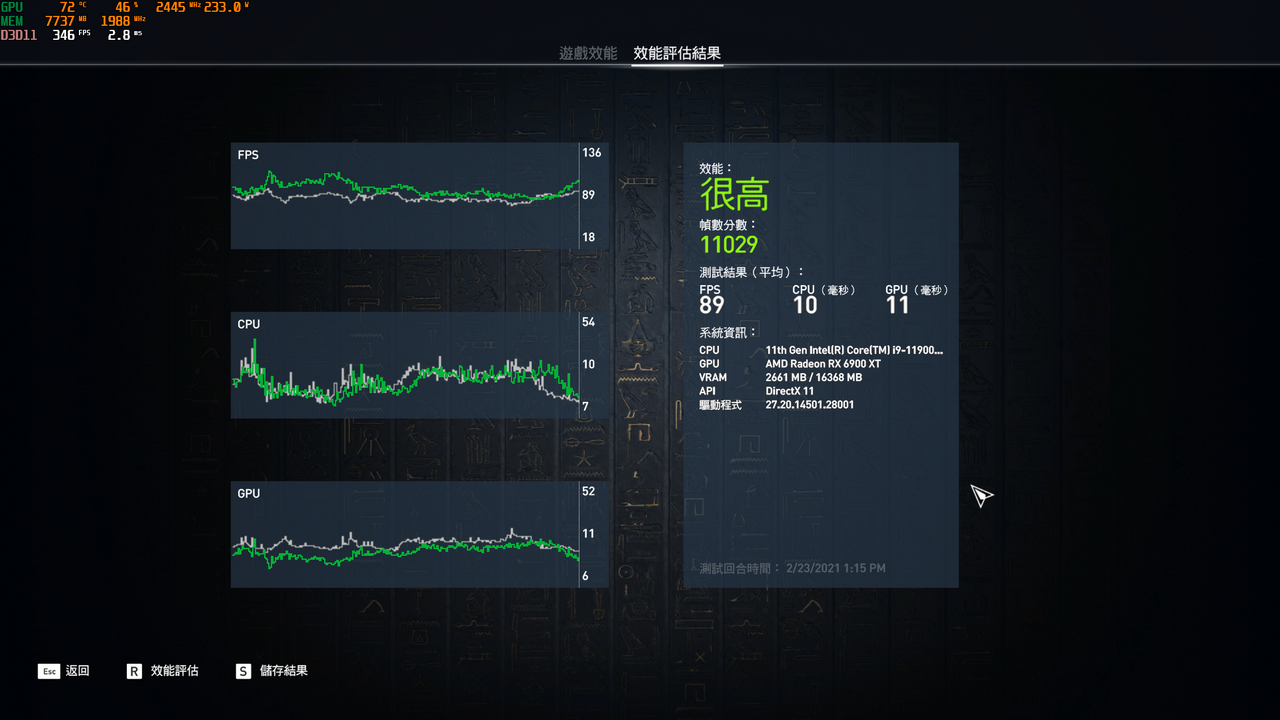
Core i9-11900K@All Core 5.2GHz1080P Assassin's Creed Origins Benchmark :11029分
對照組 Core i9-10900K@All Core 5GHz1080P Assassin's Creed Origins Benchmark :10733分
Ryzen 7 5800X@All Core 4.725GHz
1080P Assassin's Creed Origins Benchmark :10127分
Assassin's Creed Origins Benchmark 1080P比較表 單位 : Score(數字愈大愈好)
Assassin's Creed Origins Benchmark 4K Results
Core i9-11900K@All Core 5.2GHz 4K Assassin's Creed Origins Benchmark:9809分
對照組 Core i9-10900K@All Core 5GHz 4K Assassin's Creed Origins Benchmark:9693分
Ryzen 7 5800X@All Core 4.725GHz
4K Assassin's Creed Origins Benchmark:9449分
Assassin's Creed Origins Benchmark 4K比較表 單位 : Score (數字愈大愈好)
d.UNIGINE Superposition Benchmark
UNIGINE是一款專有的跨平台遊戲引擎,由俄羅斯軟件公司 UNIGINE Corp開發。除了用作遊戲引擎外,它還用於虛擬現實系統,嚴肅遊戲和可視化
UNIGINE最強大的功能是它的高級渲染器,支持 OpenGL 4.0和 DirectX 11,Superposition則為 2017版本,包含極端性能和穩定性測試:視頻卡,電源,冷卻系統,檢查預設和超頻模式與真實負載及在環境中的互動體驗
UNIGINE Superposition Benchmark 1080P Extreme Results
Core i9-11900K@All Core 5.2GHz 1080P UNIGINE Superposition Benchmark Extreme:10833分
對照組 Core i9-10900K@All Core 5GHz 1080P UNIGINE Superposition Benchmark Extreme:10993分
Ryzen 7 5800X@All Core 4.725GHz
1080P UNIGINE Superposition Benchmark Extreme:11065分
UNIGINE Superposition Benchmark 1080P Extreme比較表 單位 : Score(數字愈大愈好)
UNIGINE Superposition Benchmark 4K Optimazed Results
Core i9-11900K@All Core 5.2GHz 4K UNIGINE Superposition Benchmark:15060分
對照組 Core i9-10900K@All Core 5GHz 4K UNIGINE Superposition Benchmark:15386分
Ryzen 7 5800X@All Core 4.725GHz
4K UNIGINE Superposition Benchmark:15481分
UNIGINE Superposition Benchmark 4K Optimazed比較表 單位 : Score(數字愈大愈好)
e.3DMark Time Spy & Extreme
3DMark Time Spy用來測試處理器及顯示卡之 3D圖形表現和工作負載,現由 UL擁有,主要是針對 DirectX 12的效能,測試有三個部分,第一個為顆粒陰影、曲面細分等效果,第二個則是光線追蹤的體積光照明技術,最後則是 CPU效能測試,在前兩個測試中,包含了數千萬個頂點跟多邊形,上百萬個曲面細分,這些都是 FireStrike的幾十倍,而 3DMark Time Spy Extreme是 3DMark Time Spy的 4K版本,所有圖形都是 4K規格
3DMark Time Spy Benchmark Results
Core i9-11900K@All Core 5.2GHz 3DMark Time Spy:16939分
對照組 Core i9-10900K@All Core 5GHz 3DMark Time Spy:17890分
Ryzen 7 5800X@All Core 4.725GHz
3DMark Time Spy:17333分
3DMark Time Spy Benchmark CPU Score比較表 單位 : Score(數字愈大愈好)
f.3DMark Time Spy Extreme
3DMark Time Spy Extreme Benchmark Results
Core i9-11900K@All Core 5.2GHz 3DMark Time Spy Extreme:8249分
對照組 Core i9-10900K@All Core 5GHz 3DMark Time Spy Extreme:8621分
Ryzen 7 5800X@All Core 4.725GHz
3DMark Time Spy Extreme:8375分
3DMark Time Spy Extreme Benchmark CPU Score比較表 單位 : Score(數字愈大愈好)
g.3DMark Port Royal
3DMark 之 Port Royal加入 DirectX 12 的 DXR(DirectX Raytracing)選用 API 集,能夠於當代遊戲大量使用的光柵化成像,加入即時光影追蹤效果,以便達成視區外物件反射、即時陰影等光柵化無法達成的畫面效果
3DMark Port Royal Benchmark Results
Core i9-11900K@All Core 5.2GHz 3DMark Port Royal:9856分
對照組 Core i9-10900K@All Core 5GHz 3DMark Port Royal:9875分
Ryzen 7 5800X@All Core 4.725GHz
3DMark Port Royal:9836分
3DMark Port Royal比較表 單位 : Score (數字愈大愈好)
h.Final Fantasy XV Benchmark
Final Fantasy XV《太空戰士 15》的 Benchmark,是一款由史克威爾艾尼克斯在 2016年 11月推出的動作角色扮演遊戲《Final Fantasy系列》的第 15部,依照傳統,太空戰士都有 Benchmark的項目
Final Fantasy XV Benchmark 1080P Results
Core i9-11900K@All Core 5.2GHz 1080P Final Fantasy XV Benchmark:15690分
對照組 Core i9-10900K@All Core 5GHz 1080P Final Fantasy XV Benchmark:15985分
Ryzen 7 5800X@All Core 4.725GHz
1080P Final Fantasy XV Benchmark:15759分
Final Fantasy XV Benchmark 1080P比較表 單位 : Score(數字愈大愈好)
Final Fantasy XV Benchmark 4K Results
Core i9-11900K@All Core 5.2GHz 4K Final Fantasy XV Benchmark:7364分
對照組 Core i9-10900K@All Core 5GHz 4K Final Fantasy XV Benchmark:7386分
Ryzen 7 5800X@All Core 4.725GHz
4K Final Fantasy XV Benchmark:7254分
Final Fantasy XV Benchmark 4K比較表 單位 : Score(數字愈大愈好)
i.Middle-earth: Shadow of War Benchmark《中土世界:戰爭之影》
Middle-earth: Shadow of War《中土世界:戰爭之影》亦為一自帶 Benchmark的角色扮演遊戲,是由 Monolith Productions開發並由華納兄弟互動娛樂發行並於 2017年 10月 10日在全球發布
Middle-earth: Shadow of War Benchmark 1080P Results
Core i9-11900K@All Core 5.2GHz 1080P Middle-earth: Shadow of War Benchmark:190fps
對照組 Core i9-10900K@All Core 5.2GHz 1080P Middle-earth: Shadow of War Benchmark:200fps
Ryzen 7 5800X@All Core 4.725GHz
1080P Middle-earth: Shadow of War Benchmark:218fps
Middle-earth: Shadow of War Benchmark 1080P比較表 單位 : Score(數字愈大愈好)
Middle-earth: Shadow of War Benchmark 4K Results
Core i9-11900K@All Core 5.2GHz 4K Middle-earth: Shadow of War Benchmark:98fps
對照組 Core i9-10900K@All Core 5GHz 4K Middle-earth: Shadow of War Benchmark:77fps
Ryzen 7 5800X@All Core 4.725GHz
4K Middle-earth: Shadow of War Benchmark:105fps
Middle-earth: Shadow of War Benchmark 4K比較表 單位 : Score(數字愈大愈好)
C.內顯測試
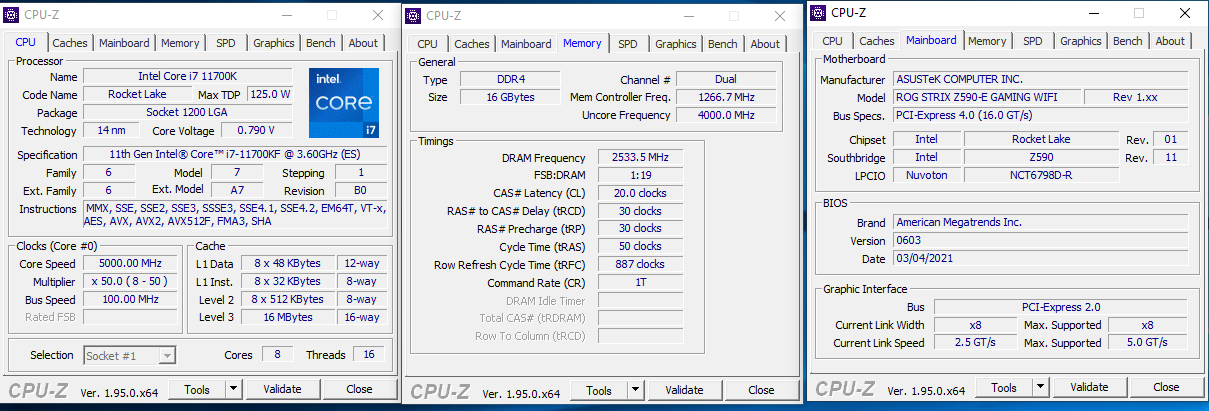
11700K@Xe Benchmark (11700K內顯為 Xe架構 GT1,代號 UHD 750 (擁有 32個 EU)
使用 GIGABYTE Z590 AORUS TACHYON
測試諸元
對照組
10900K@UHD 630 Benchmark
測試諸元
Core i7-11700K UHD 750
Final Fantasy XV Lite mode 1080P 1000分
對照組
Core i9-10900K UHD 630
Final Fantasy XV Lite mode 1080P 1000分
Core i7-11700K UHD 750
Final Fantasy XIV Lite mode 1080P 2373分
對照組
10900K UHD 630
Final Fantasy XIV Lite mode 1080P 1758分
Core i7-11700K UHD 750
UNIGINE Superposition Benchmark 720P Low:4095分
對照組 UHD 630
Core i9-10900K UNIGINE Superposition Benchmark 720P Low:3153分
Core i9-11700K UHD 750 FarCry5 Benchmark 720P :24fps
對照組
Core i9-10900K UHD 630 FarCry5 Benchmark 720P :15fps
內顯測試效能比較表 單位:Score & fps(數字愈大愈好)
D.PCMARK10
PCMark是由 UL開發的計算機基準測試工具用於在系統和組件級別測試 PC的性能,而 PCMark 10是 Windows PC 的系統基準,其測試重點是當今辦公室內常用的各種編輯軟體,它提供了三類的工作負載
1.「Essentials」 包括 Web瀏覽,視頻會議和應用程序啟動時間
2.「Productivity」包括基於電子表格和寫作的測試
3.「Digital Content Creation」包括照片編輯,視頻編輯以及渲染和可視化測試
11900K測試諸元
PCMARK10 Score
11700K測試諸元
PCMARK10 Score
11600K測試諸元
PCMARK10 Score
PCMARK10效能測試比較表 單位: Score(數字愈大愈好)
11700K其他測試
小結:
從以上測試結果來看,在預設下的全新 Core i9-11900K (KF) 桌上型處理器效能關鍵仍取決於 ABT之執行率與平台散熱環境,當開啟「Intel Adaptive Boost Technology」ABT之後我們可以從測試中看到,處理器之 All Core頻率高低與否將視程式之 Workload程度而有所不同,在 Cinebench R20測試時,處理器之全核心頻率落在 5.0GHz (屬於中度 Workload),而在 wPrime 2.10測試時則可見到全核心頻率維持在 5.1GHz (屬於輕度 Workload),在 CPU FPU Stress TEST測試時則見到處理器頻率大幅滑落到 4.5~ 4.8GHz之間 (屬於極重度 Workload)
這意味著在輕度負載時 Core i9-11900K (KF) 還是能在預設時達成 All Core 5.1GHz,這對提升預設時的效能大有幫助
以下列出Core i9-11900K (KF) 之亮點
Core i9-11900K@Boost Idle時頻率為 5.3GHz而記憶體使用 DDR4 5333 C22 XMP
HWiNFO64
CPUMark99時亦同
在執行 CPU-Z Bench測試時仍能見到某些核心在 5.3GHz運作
在 wPrime 2.10測試則可見到在 ABT運作下之全核心頻率 5.1GHz
Core i9-11900K@Boost 執行CPU-Z Bench成績 Single Thread 702.8 Multi Thread 6597.4
Intel Core i9-11900K與上一代 Intel Core i9-10900K相同的是其 Boost頻率均為 5.3GHz (Intel Thermal Velocity) ,同時也是專為遊戲打造的桌上型處理器,不同的則是 Core i9- 11900K之核心數比 Core i9-10900K少了 2顆,雖然如此但其在遊戲效能上仍不讓 Intel Core i9-10900K與 Ryzen 5 5800X專美於前,在使用 ASUS ROG STRIX RTX 3090 O24G GAMING做 Gaming測試時 Core i9- 11900K@5.2GHz vs Ryzen 7 5800X@4.725GHz全勝,唯在對上老大哥 Core i9- 10900K 實則因為少了 2顆核心數則敗下陣來,而在以 RX 6900 XT在 GIGABYTE Z590 AORUS XTREME做比較時 Core i9- 11900K vs Ryzen 7 5800X則是勝多負少,以下以 FarCry5為例看 Core i9- 11900K vs Ryzen 7 5800X在 RX 6900 XT的比較表,仍是 11900K勝出
Far Cry 5 1080P比較表 單位 : fps(數字愈大愈好)
Assassin's Creed Origins Benchmark 1080P比較表 單位 : Score(數字愈大愈好)
在內顯方面 UHD 750效能大幅超越 UHD 630 35%~+60%不等
內顯測試效能比較表 單位: Score & fps(數字愈大愈好)
而身為 Cypress Cove架構,內建 Xe GPU並擁有 PCIe 4.0通道 20 Lanes,其中 PCIe 4.0 x4支援 M.2 NVMe SSD,PCIe 4.0 x16則分配給顯示卡也給 11900K大大的加分,而在搭配 GIGABYTE AORUS NVMe GEN4 SSD 1TB時效能更是亮麗
11900K@PCIe 4.0X4 CrystalDiskMark
GIGABYTE AORUS NVMe GEN4 SSD 1TB PCIe 4.0 M.2 SSD CrystalDiskMark測試比較表 單位:MB/S(數字愈大愈好)
在記憶體超頻方面, GIGABYTE的表現令人寡目相看,可以 DDR4 5333 XMP直開
AIDA64 Cache & Memory Benchmark比較表 單位:MB/S (數字愈大愈好)
以救援之姿上場的末代 14nm處理器「Rocket Lake-S」在單線程的表現上還是能與友商 Ryzen 5000系列處理器相抗衡的,期待第 12代的 Intel Alder Lake能夠再次華麗轉身在多線程上也超越對手
本篇完,請繼續關注「Rocket Lake-S」相關評測,謝謝收看
Intel Core i9-11900K Boost 5.3GHz ABT探討及 DDR4 5333、PCI-E Gen4、UHD750測試,華碩篇
Intel Core i5-11600K 5.2GHz DDR4 5333超頻測試並與 Core i9-10900K 5.2GHz AMD Ryzen 5 5800X 4.725GHz遊戲比較