Intel 12代處理器採用了新的大小核心架構,配合的作業系統必須升級到 Windows 11 才能發揮淋漓盡致的效能,這也不禁讓人猜測這 Windows 11 就是為了 Intel 大小核而生,畢竟先前微軟信誓旦旦表示 Windows 10 是最後一代系統,之後只會針對更新或改進,推出 Windows 11 之後官方甚至還暗示了 Windows 11 與 10 的生命週期類似,大概就是10年。
不過 Windows 10 在 Intel 12代上面真的無法有效發揮?此篇將針對 Intel 第12代處理器 Core i9-12900K 在 Windows 11 以及 Windows 10 上面進行效能比較。另外還有 Z690 AORUS MASTER 內建的 CPU Upgrade 快速超頻效能測試。
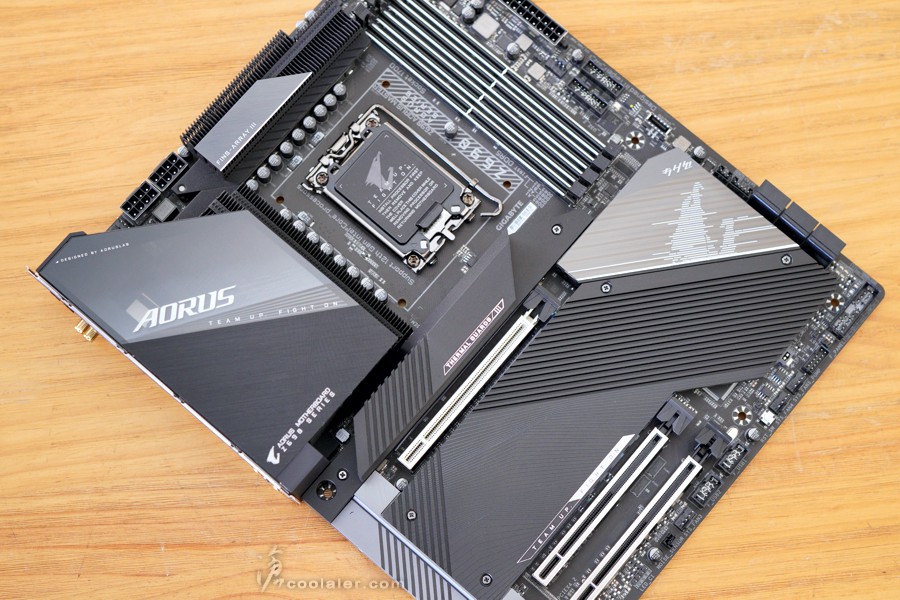
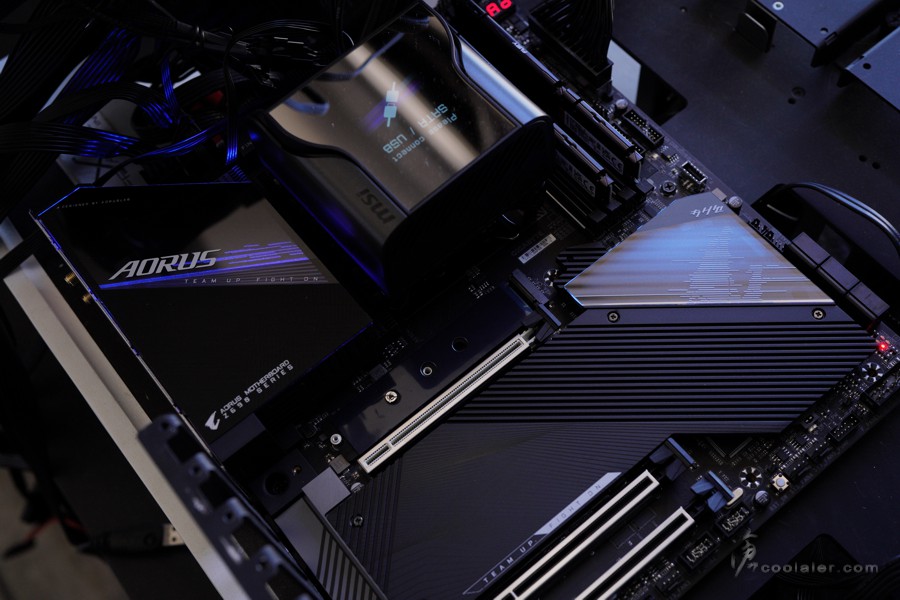
在這之前有針對 GIGABYTE Z690 AORUS MASTER 進行開箱,詳細請參閱連結。
測試之前先來看看 GIGABYTE Z690 AORUS MASTER 的 BIOS 選單。
BIOS 簡介
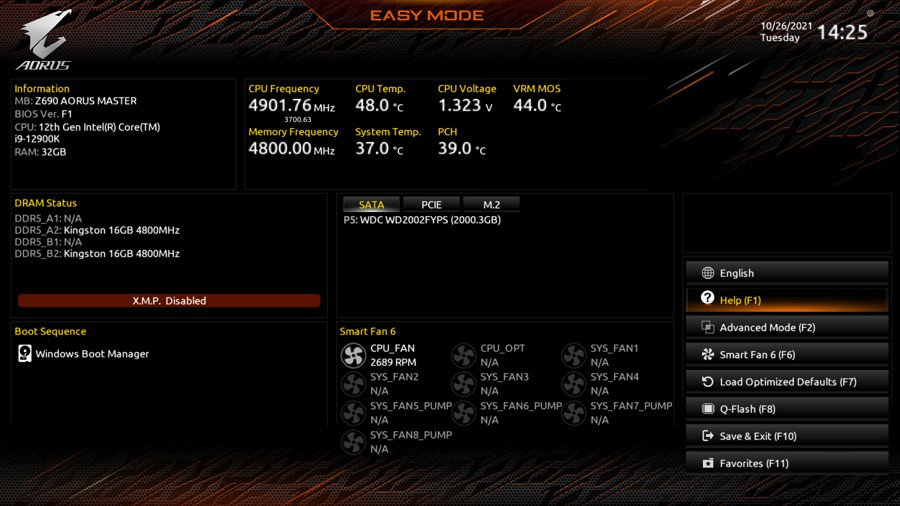
BIOS 介面相較於 Z590 差異並不是太大,以下為簡易模式,主要用於顯示目前系統資訊。
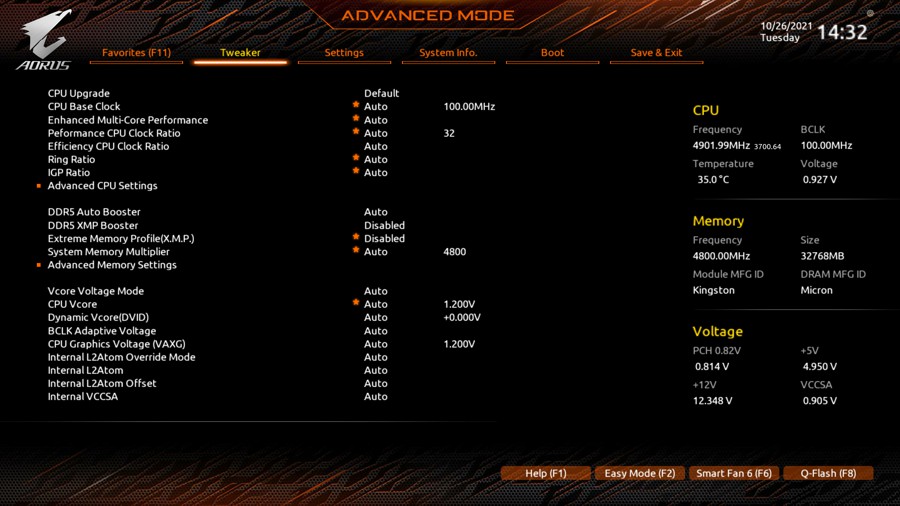
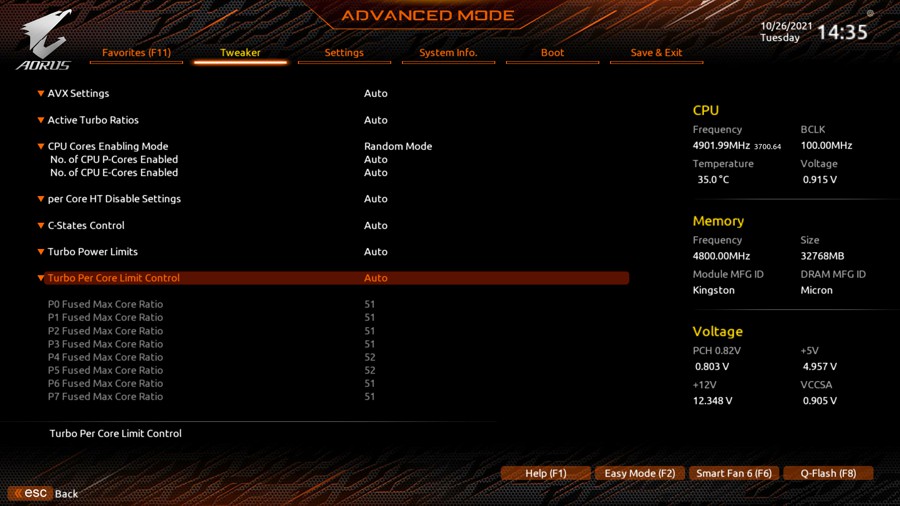
進階模式分有 Favorites、Tweaker、Settings、System Info、Boot、Save & Exit 幾項。Tweaker 裡面主要是針對超頻調校,可以調整 CPU 倍頻、外頻、進階 CPU 選項、記憶體時脈、參數、電壓等。
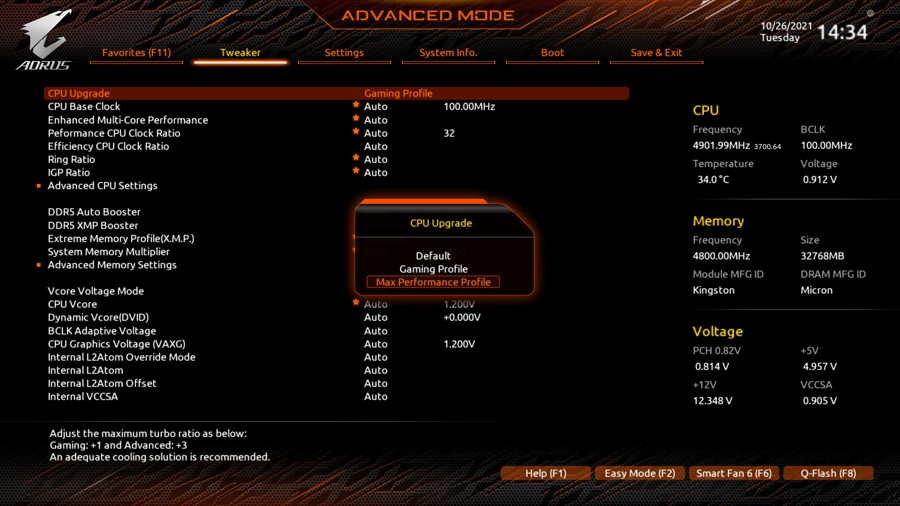
CPU Upgrade 簡單說就是屬於比較保守的超頻,裡面有兩種模式可調用,Gaming Profile、Max Performance Profile,左下角有說明,Gaming 倍頻+1,Max 倍頻+3,建議使用比較好的 CPU 散熱器才進行調整。
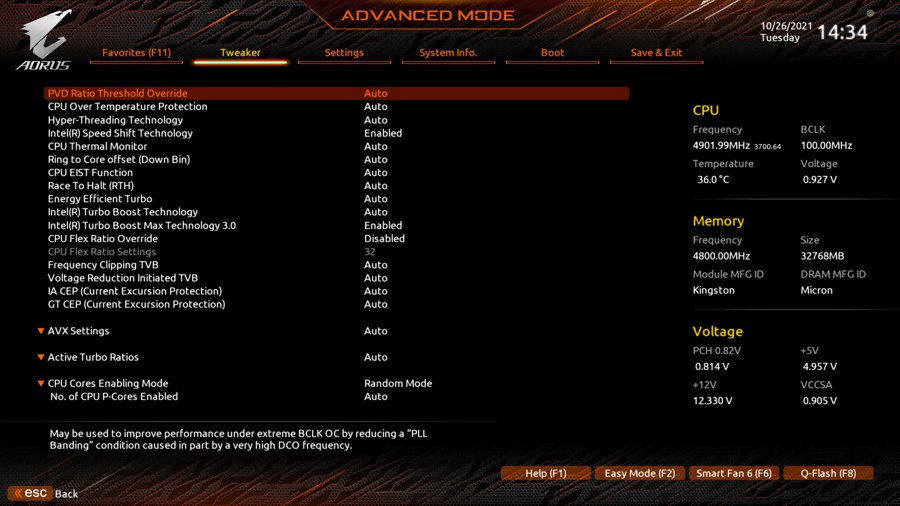
進階 CPU 選項。
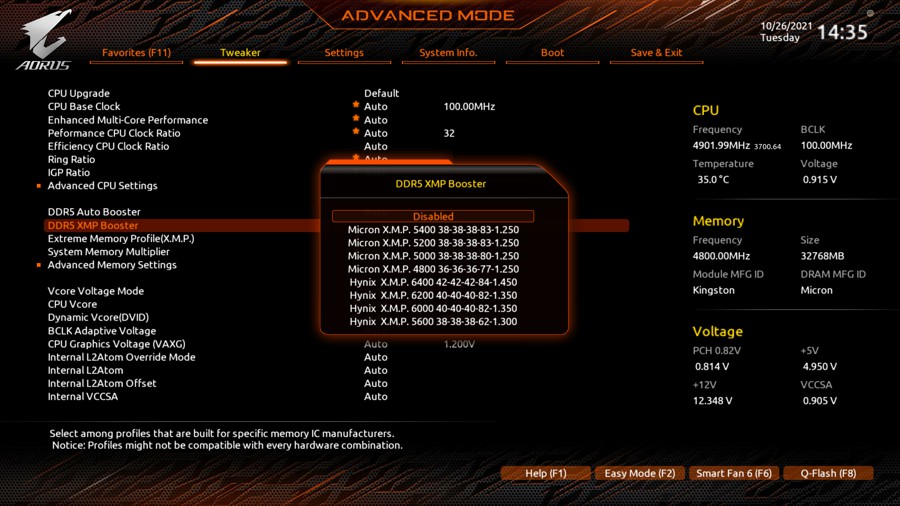
DDR5 XMP Booster,這部分可以針對顆粒不同進行快速調用超頻,在右側邊主機板會判讀所使用的顆粒,如使用的這組為 Kingston FURY DDR5 5200,顯示的是 Micron 顆粒,就可以直接調用 5400 來超頻,當然這不一定保證就能穩定運作,還是得透過燒機來測試,但內建的就是 GIGABYTE 工程師所測試多數可以穩定的時脈、參數、電壓。
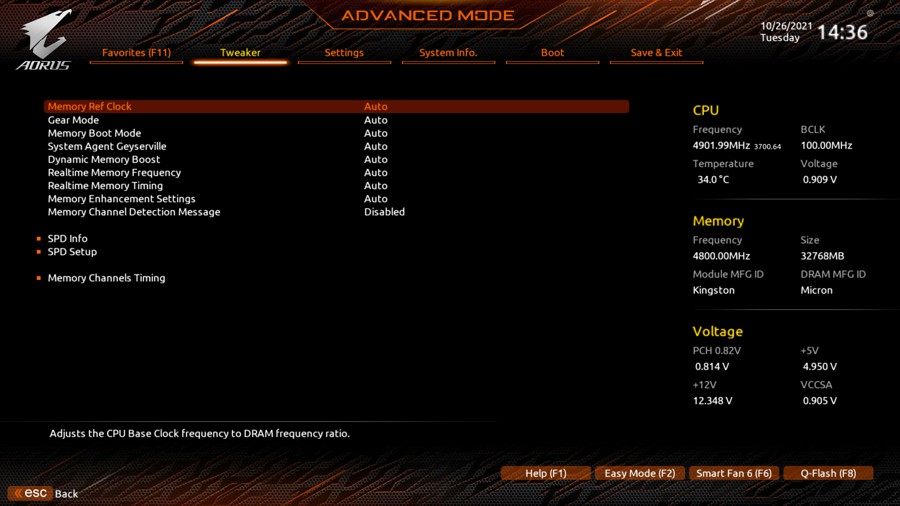
記憶體選項。
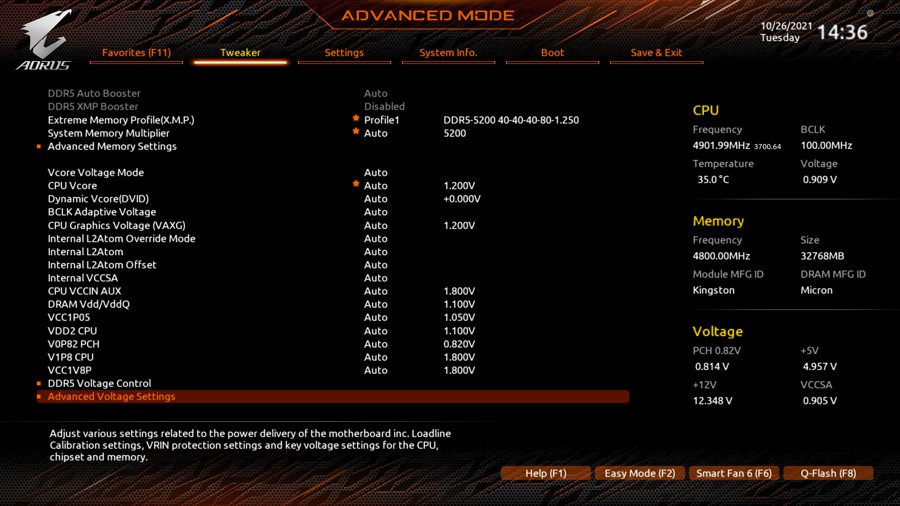
有完整的電壓選項可調。
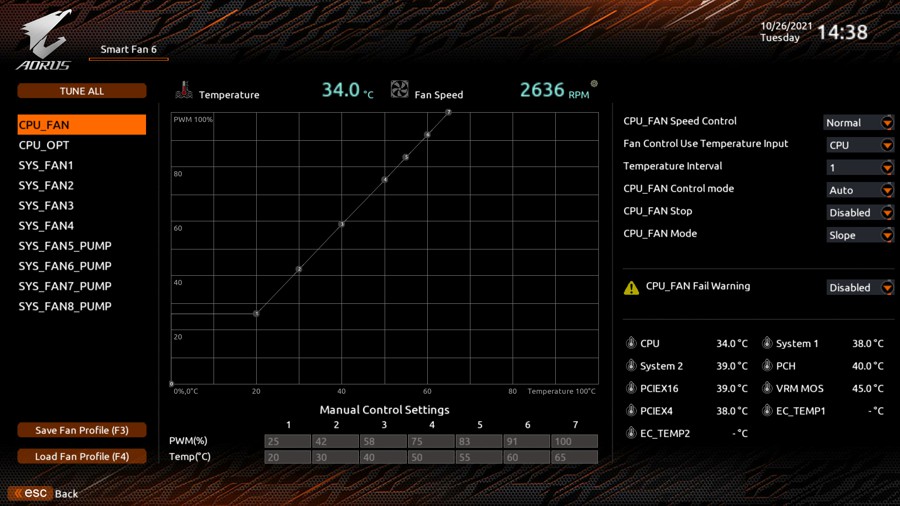
Smart Fan 6,可針對風扇轉速對應溫度進行調整。
測試平台
CPU: Intel Core i9-12900K
CPU Cooler: MSI MEG CORELIQUID S360
RAM: Kingston FURY DDR5 5200MHz 16GBx2
MB: GIGABYTE Z690 AORUS MASTER
VGA: MSI RTX 3070 GAMING X TRIO
SSD: GIGABYTE AORUS NVMe Gen4 SSD 1TB
PSU: IN WIN SI 1065W
OS: Windows 11 & Windows 10
測試針對 Windows 11 以及 Windows 10 個別跑過同樣項目,並比較效能差異,Window 10 已經更新到最新版本。
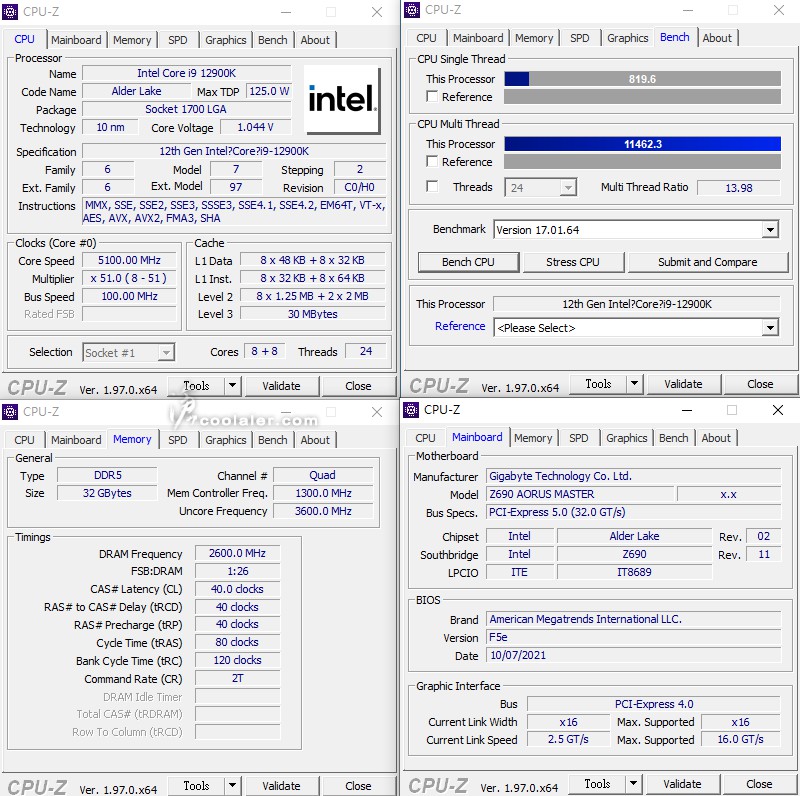
CPU-Z @ Windows 11
CPU Single:815.0
CPU Multi:11365.3
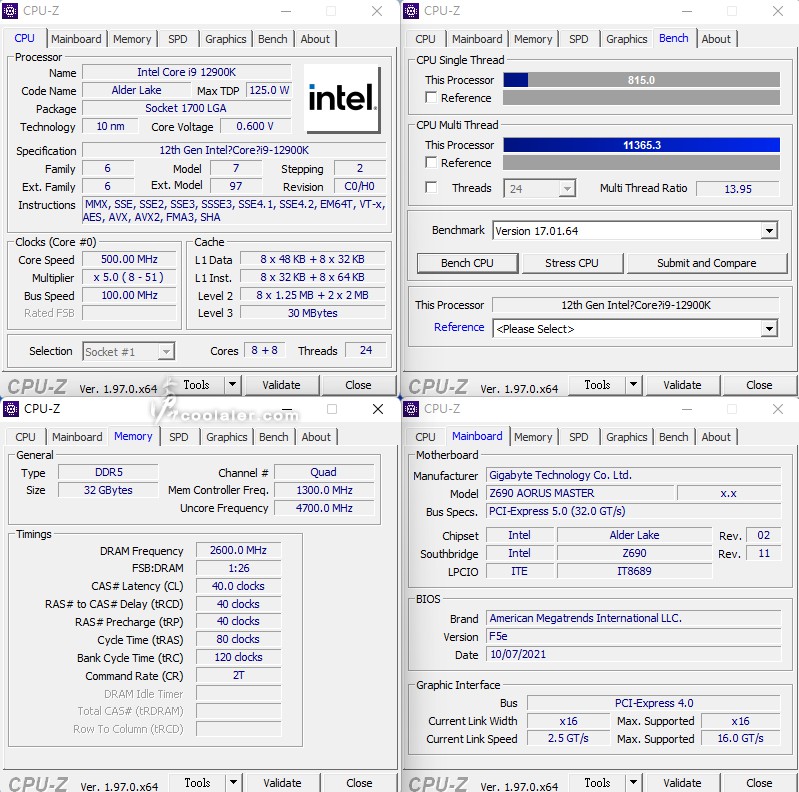
CPU-Z @ Windows 10
CPU Single:819.6
CPU Multi:11462.3
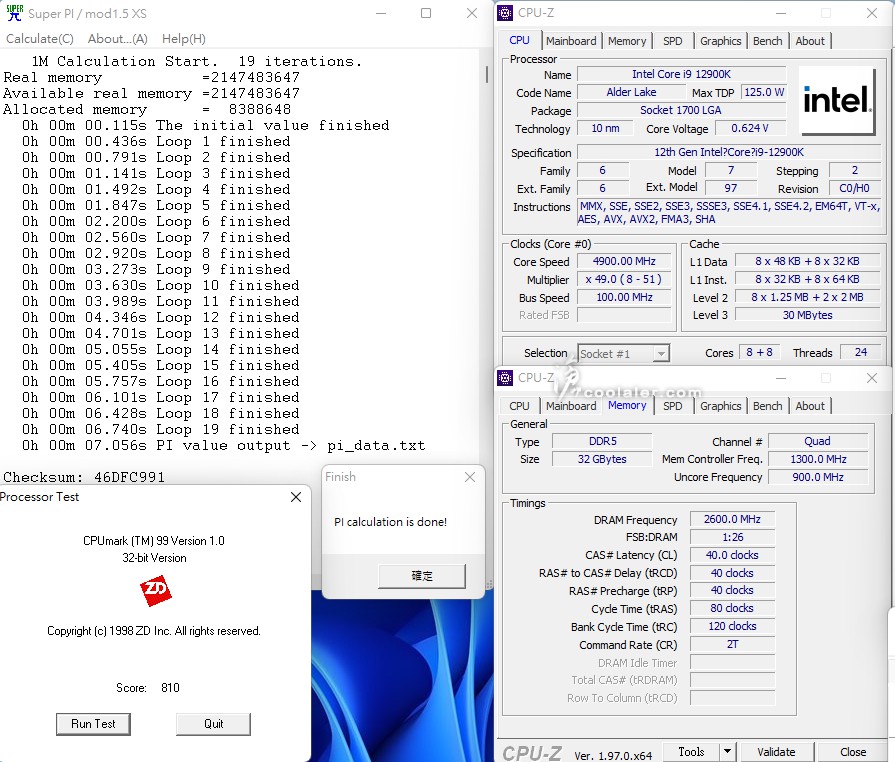
SupertPI 1M & CPUmark99 @ Windows 11
SuperPI 1M:7.056s
CPUmark99:810
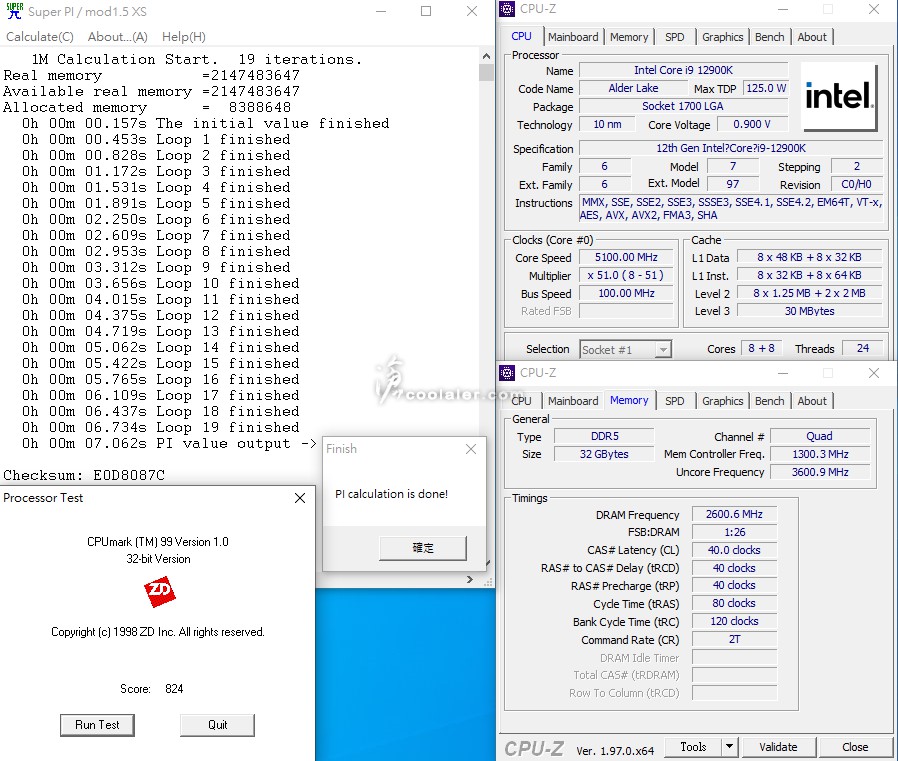
SupertPI 1M & CPUmark99 @ Windows 10
SuperPI 1M:7.062s
CPUmark99:824
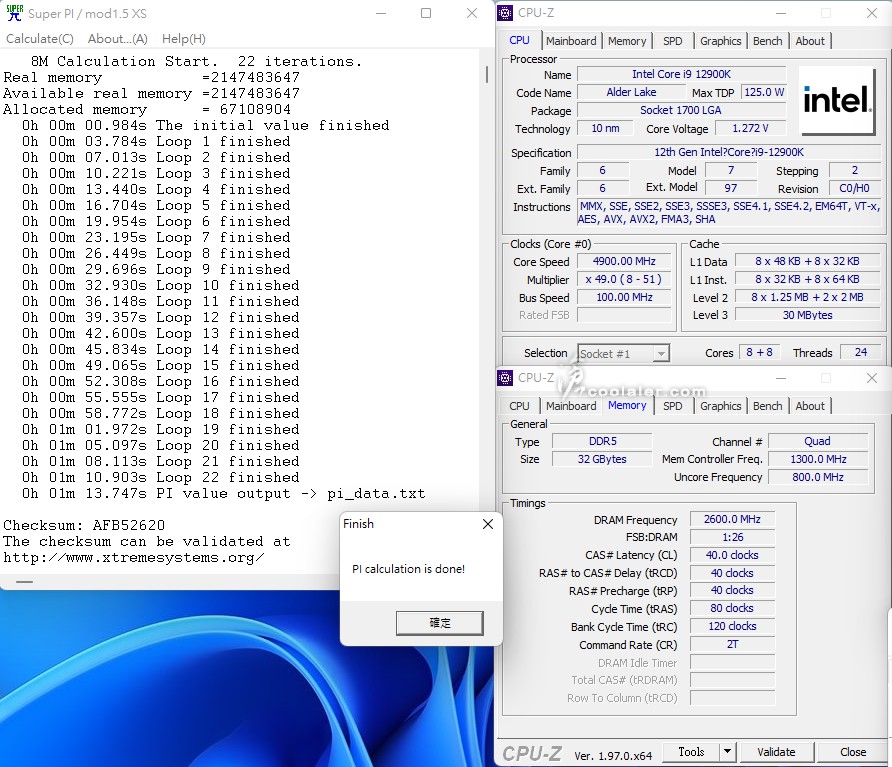
SuperPI 8M @ Windows 11:1m13.747s
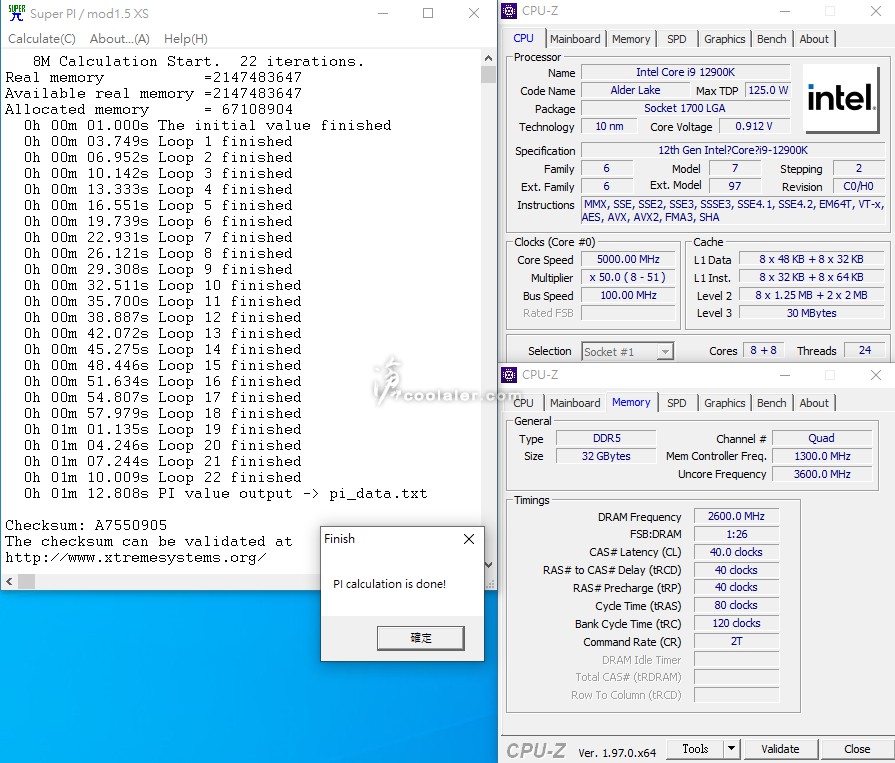
SuperPI 8M @ Windows 10:1m12.808s
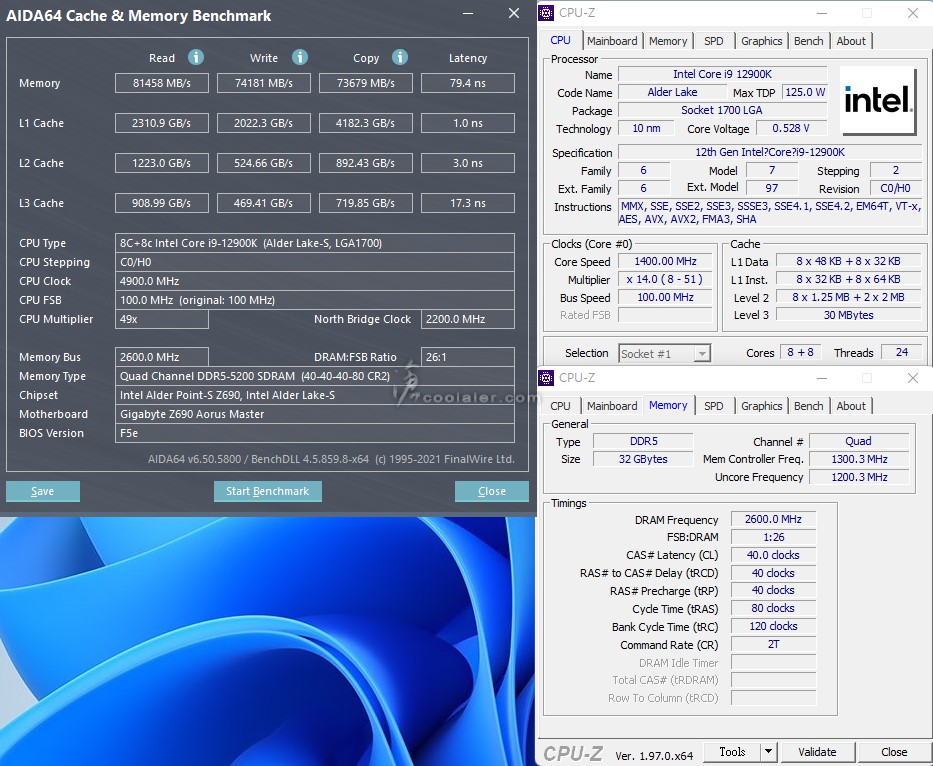
Memory Benchmark @ Windows 11
Read:81458 MB/s
Write:74181 MB/s
Copy:73679 MB/s
Latency:79.4 ns
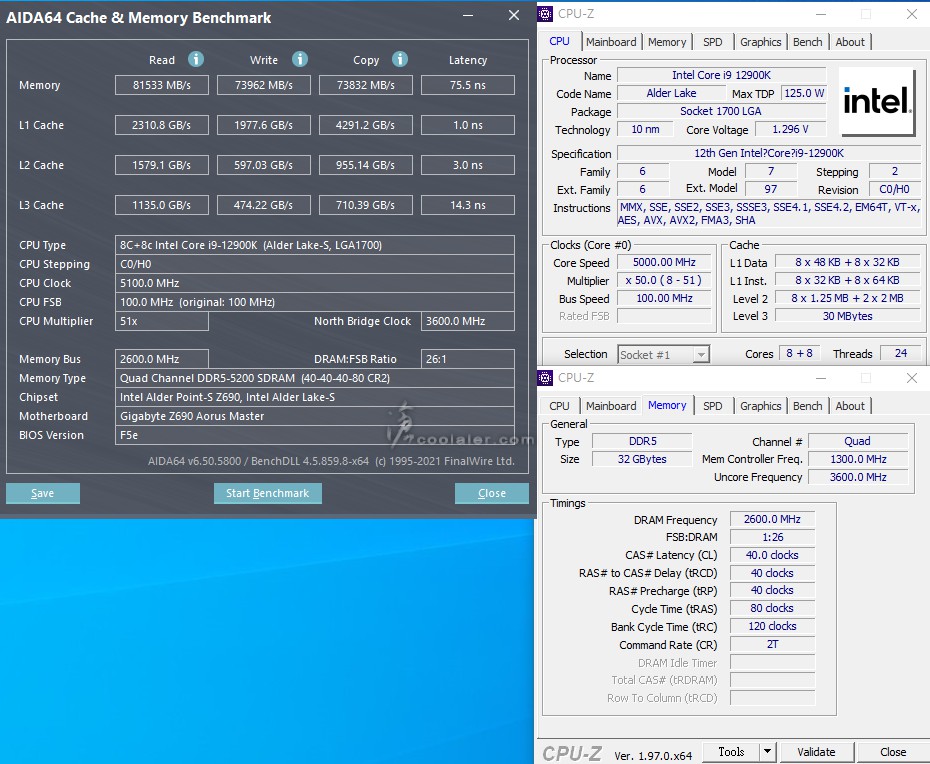
Memory Benchmark @ Windows 10
Read:81533 MB/s
Write:73962 MB/s
Copy:73832 MB/s
Latency:75.5 ns
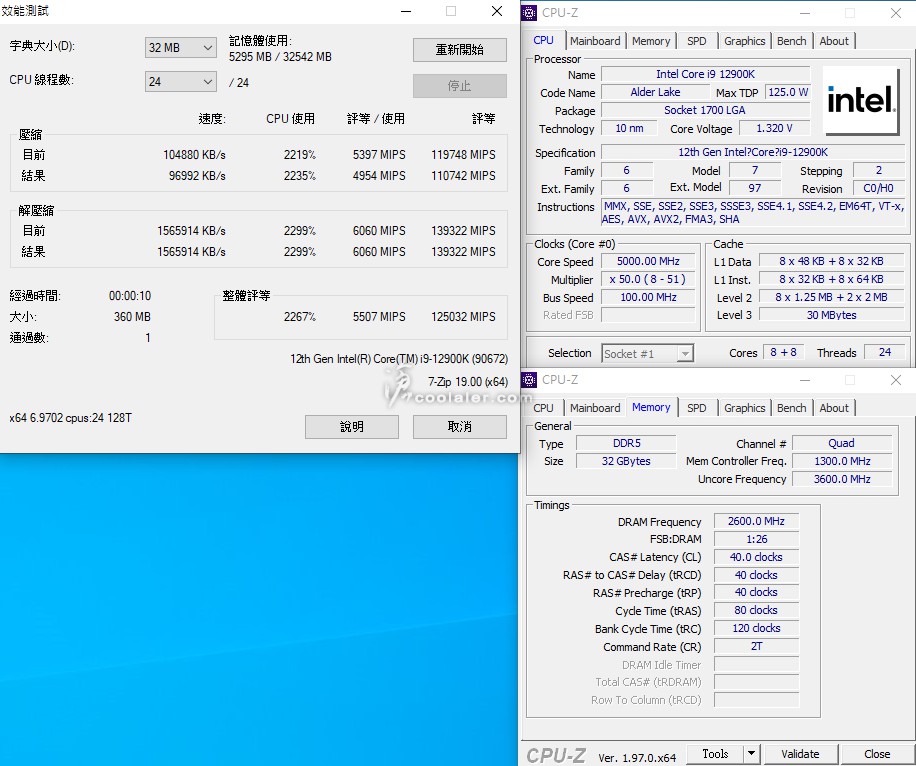
7-Zip 19.00 @ Windows 11
壓縮:111152 MIPS
解壓縮:139322 MIPS
整體評等:125237 MIPS
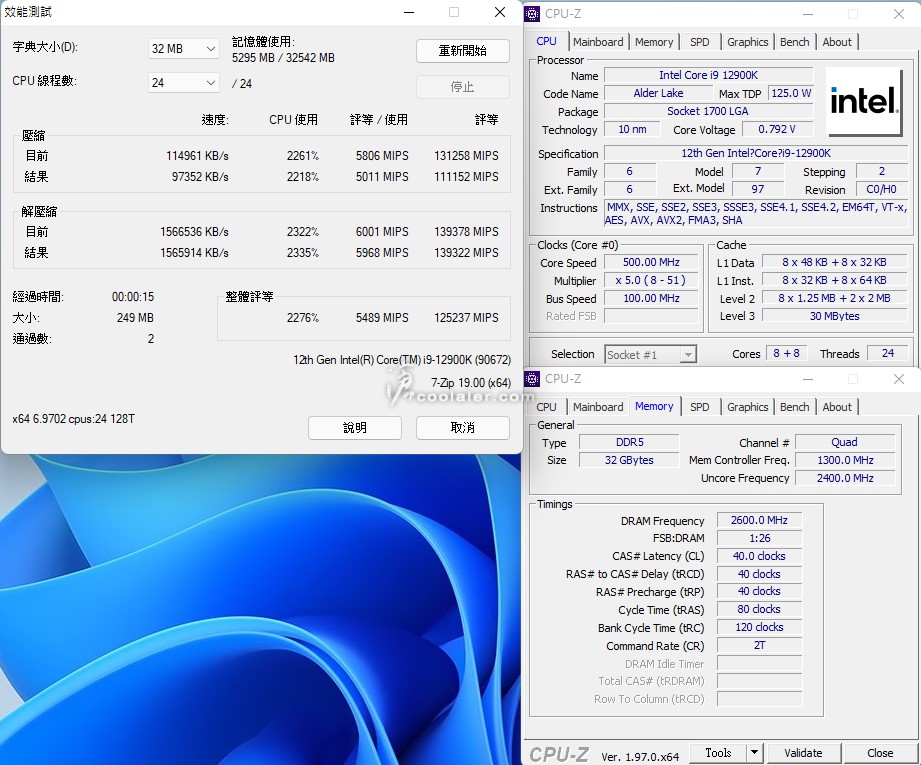
7-Zip 19.00 @ Windows 10
壓縮:110742 MIPS
解壓縮:139322 MIPS
整體評等:125032 MIPS
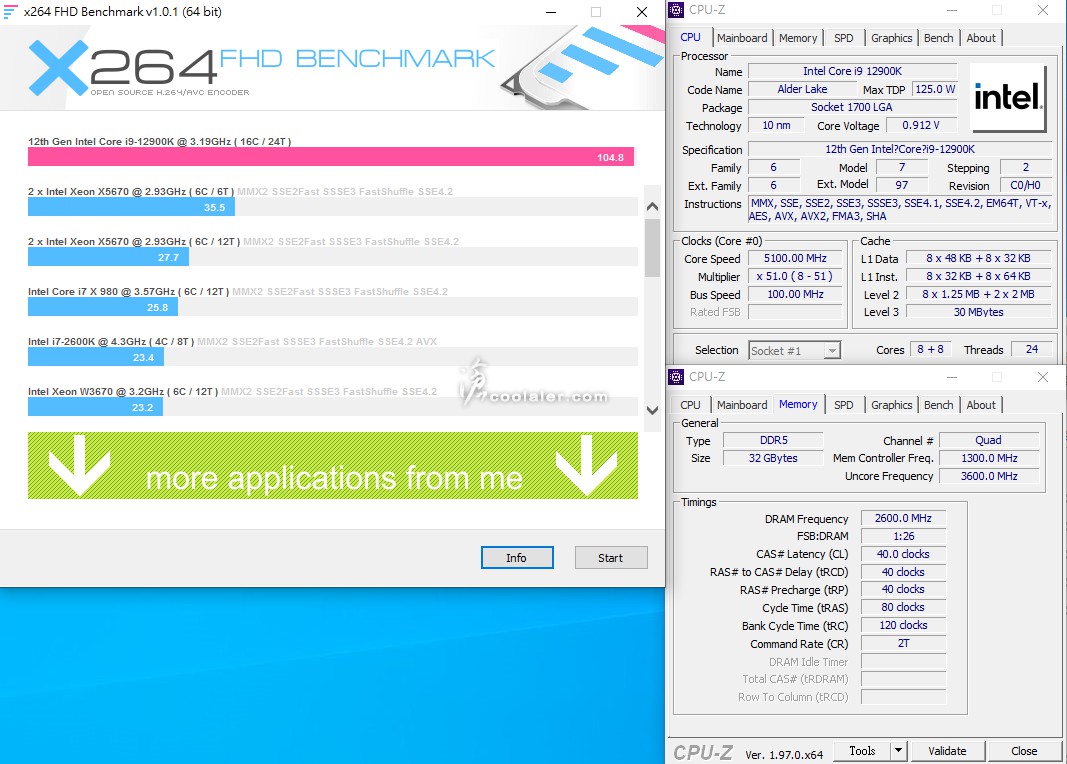
x264 FHD Benchmark @ Windows 11:104.9
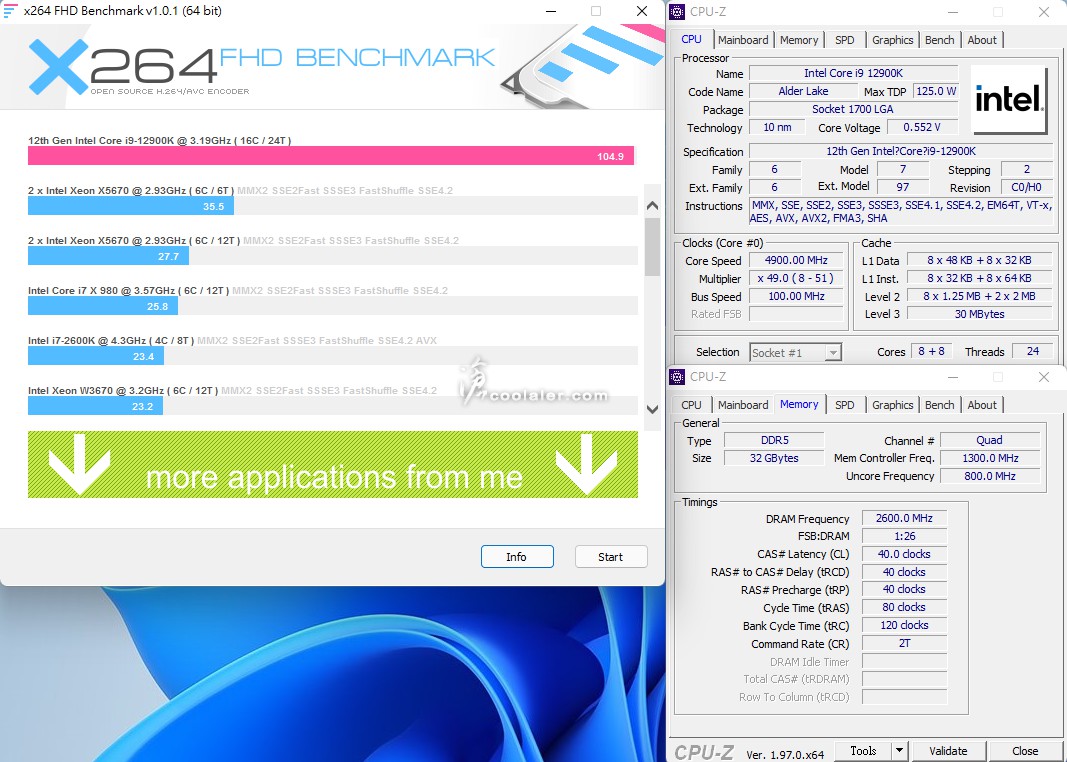
x264 FHD Benchmark @ Windows 10:104.8
POV-Ray @ Windows 11:29.03s
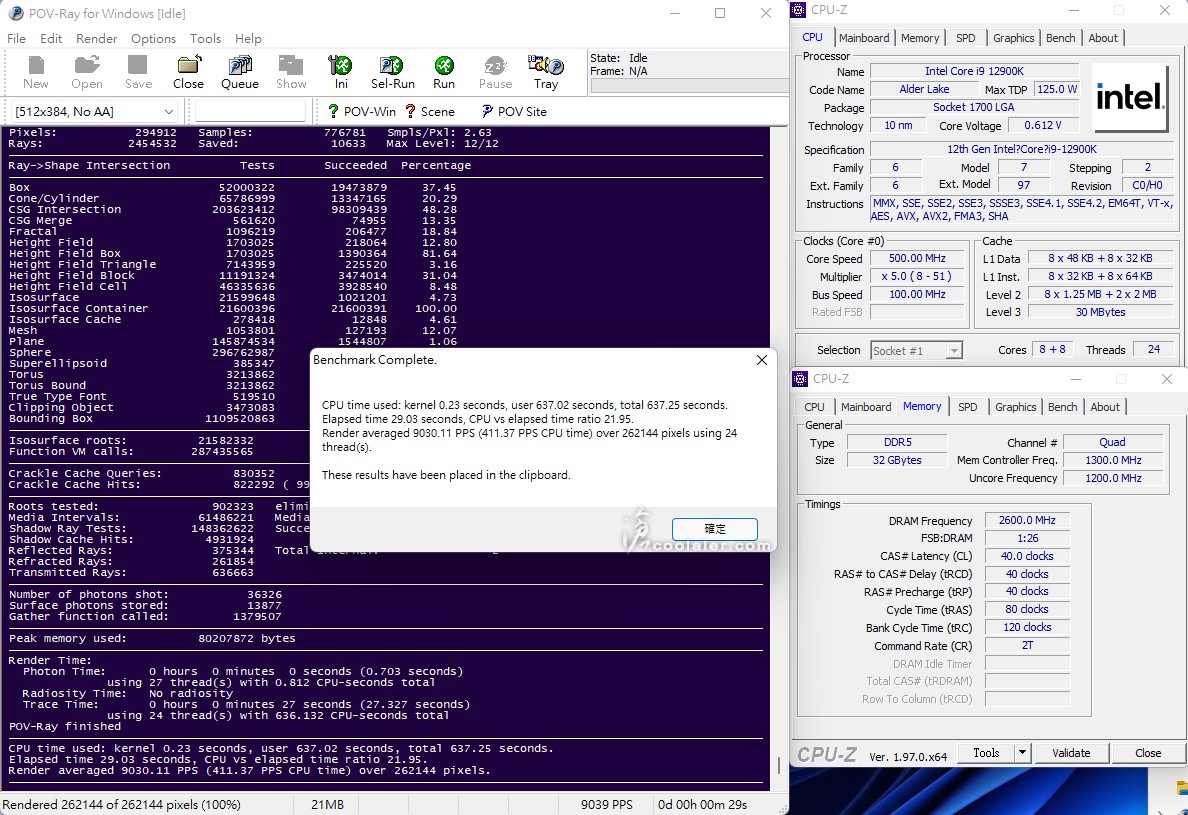
POV-Ray @ Windows 10:59.09s
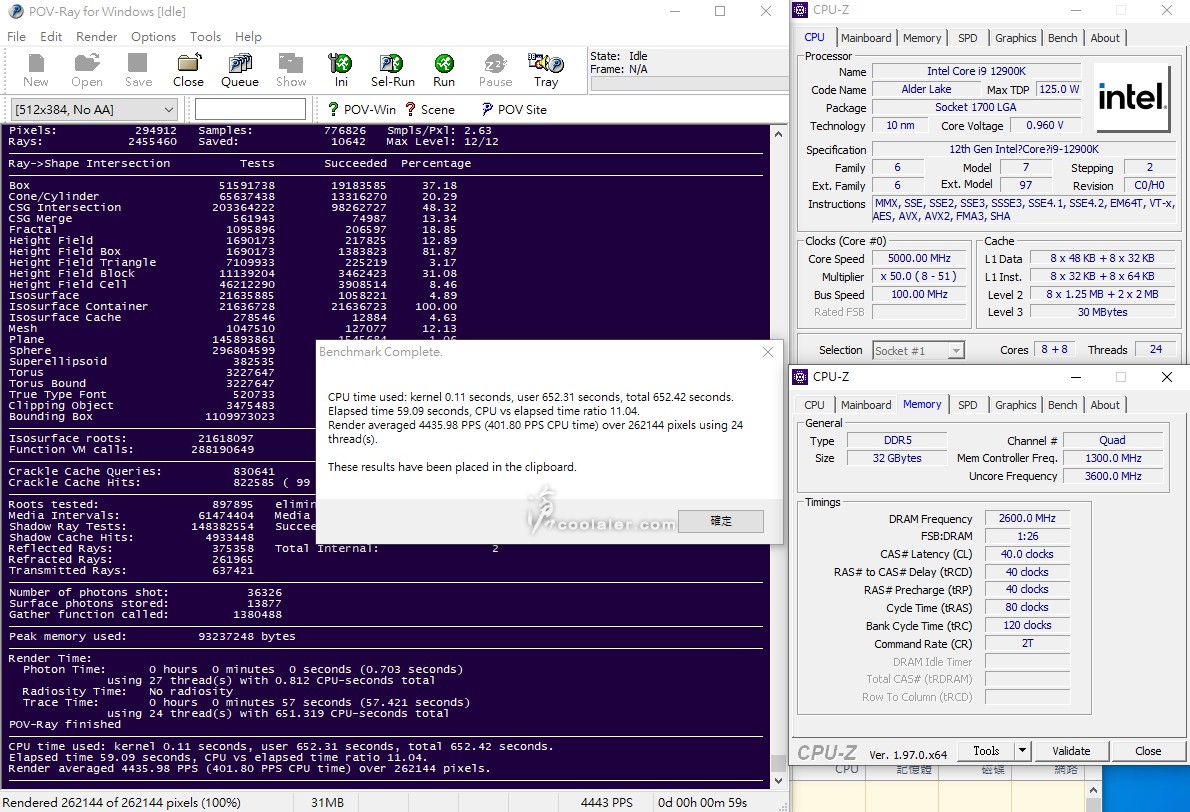
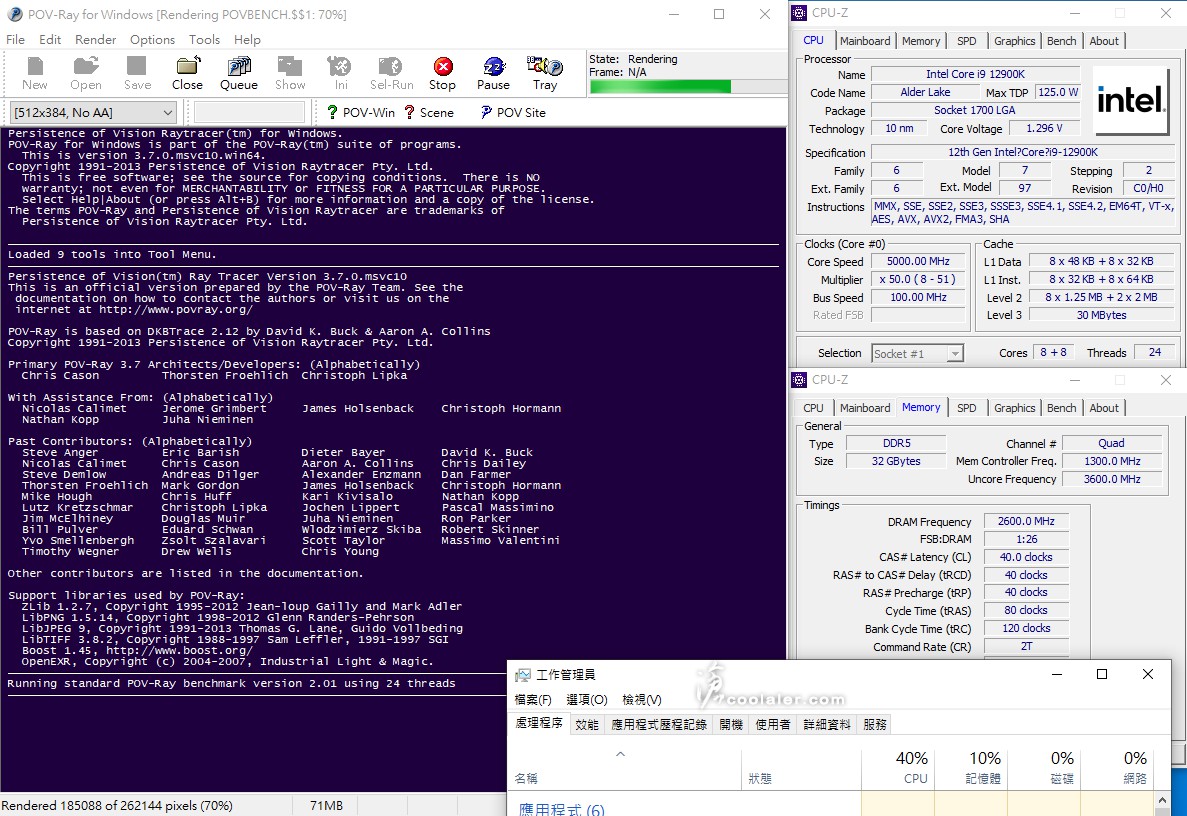
POV-Ray 這部分成績差異較大,可以看到 POV-Ray 在 Windows 10 執行時只有約40%的核心負載,而不是100%。
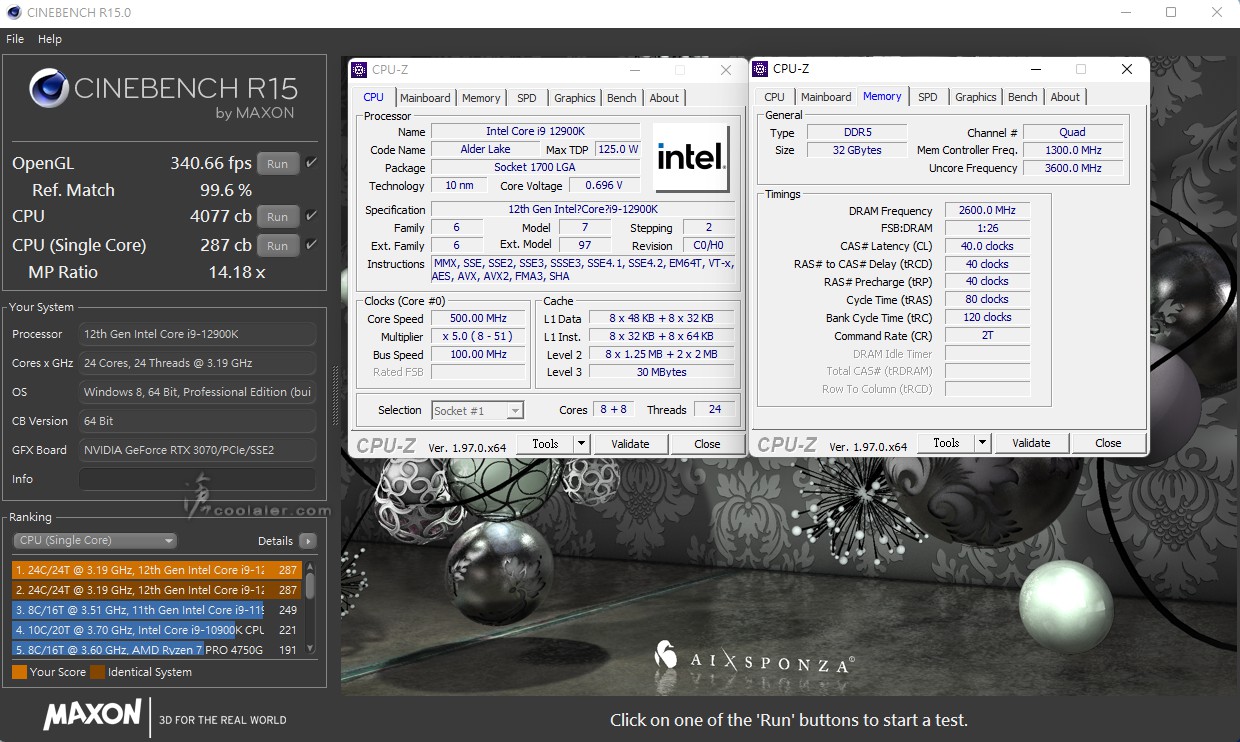
CINEBENCH R15 @ Windows 11
OpenGL:340.66 fps
CPU:4077 cb
CPU 單核心:287 cb
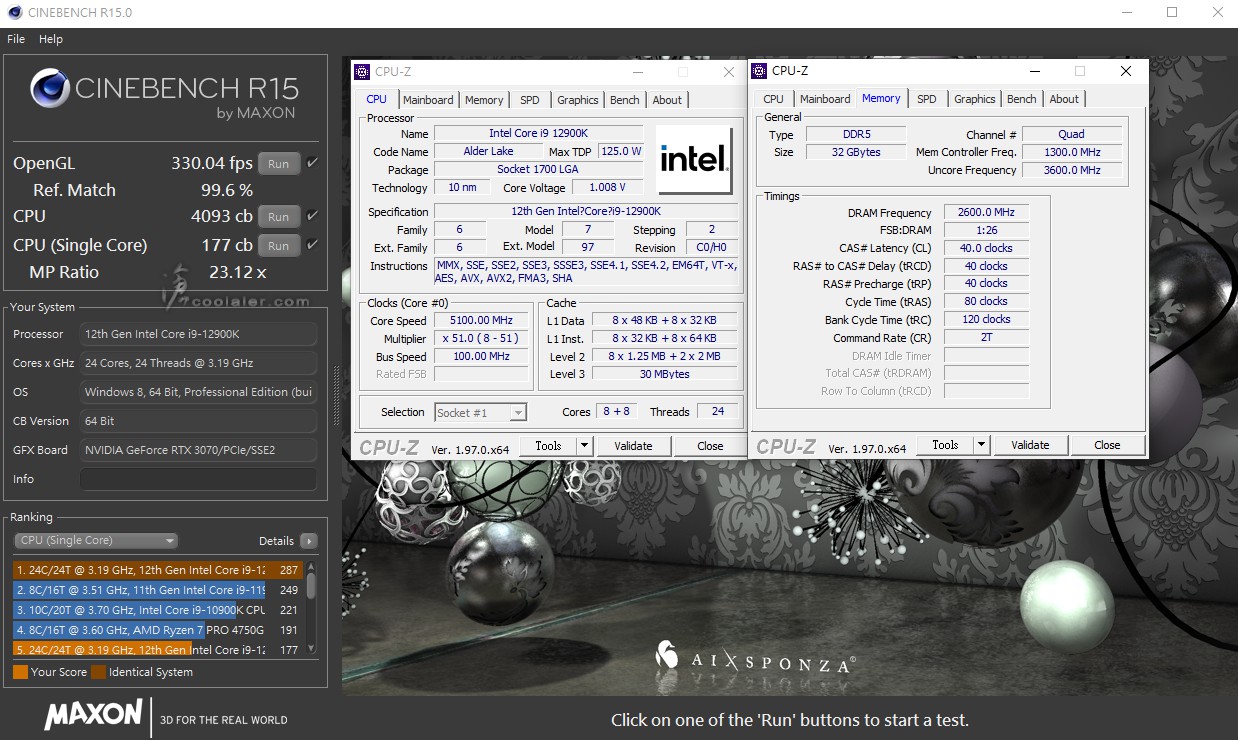
CINEBENCH R15 @ Windows 10
OpenGL:330.04 fps
CPU:4093 cb
CPU 單核心:177 cb
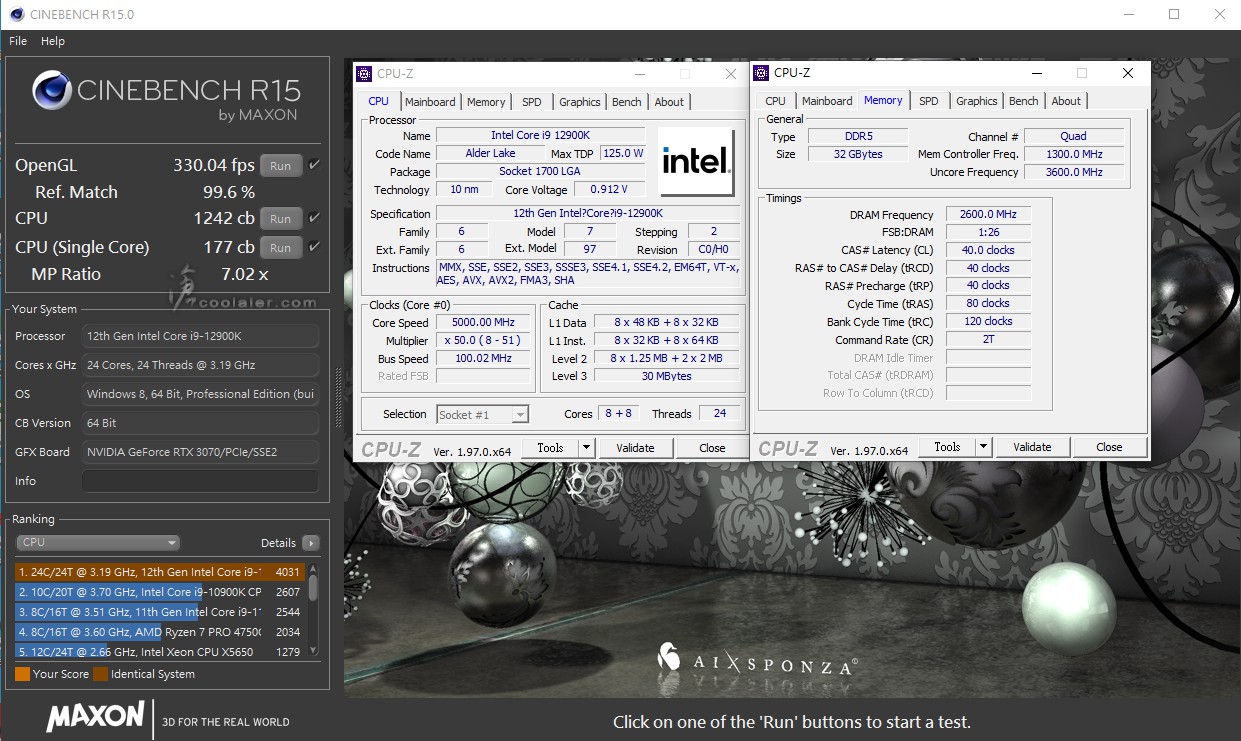
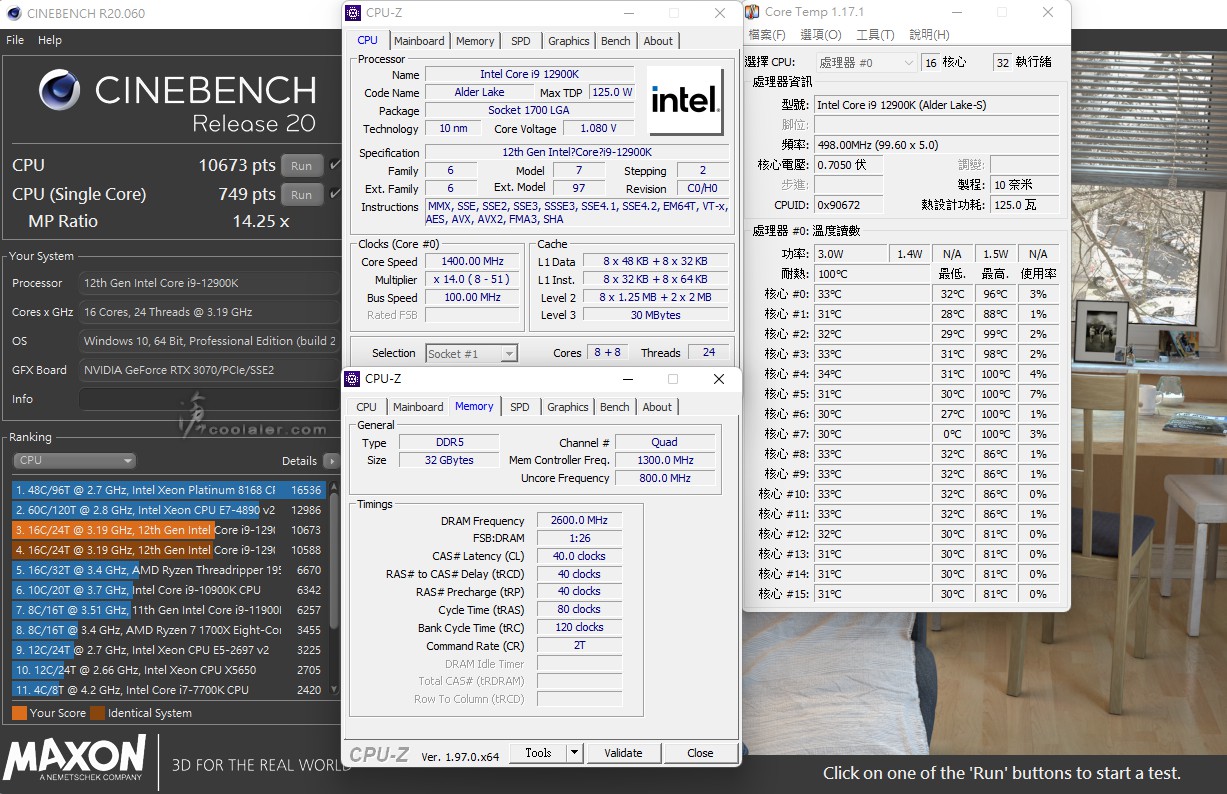
R15上面一樣有 POV-Ray 的問題,可以看下圖,跑第二次多核心成績變成了1242 cb,大幅降低。
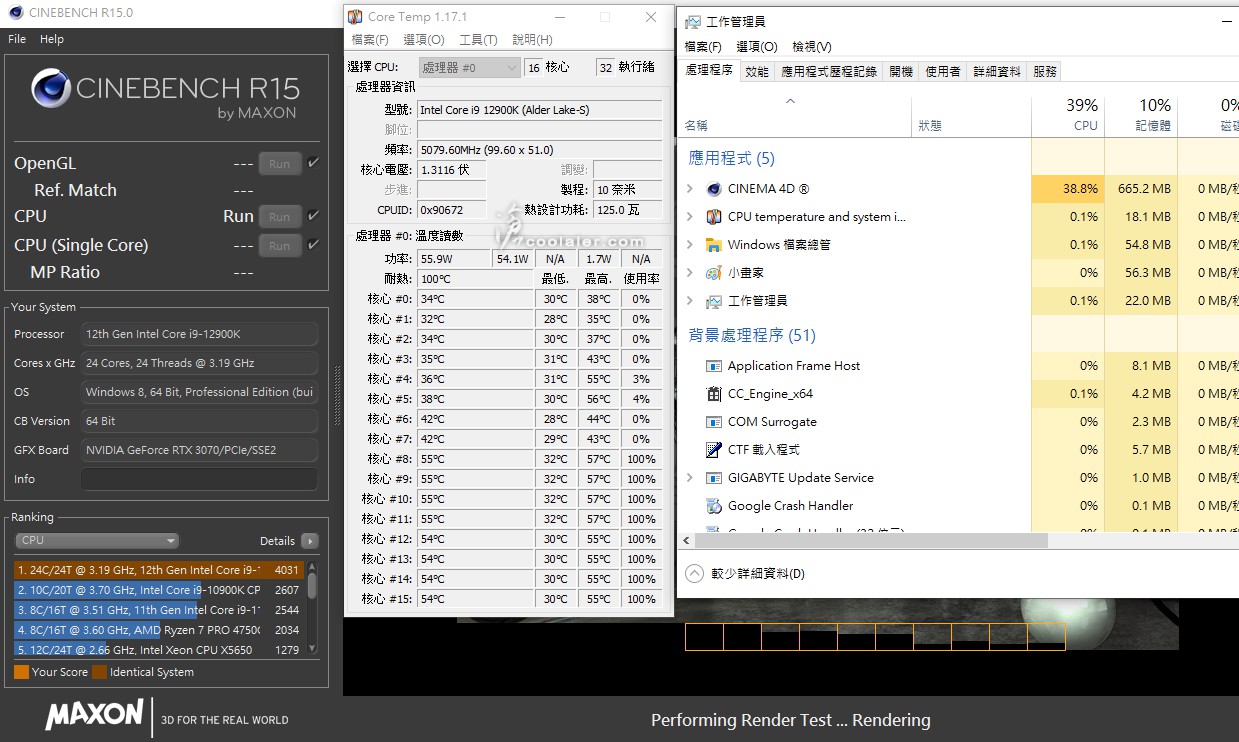
執行時 Core Temp 可以看到只有#8~#15核心是100%,其餘#0~#7是沒有負載,總負載是39~40%,與 POV-Ray 相同,大核心在運算時並沒有啟動執行。
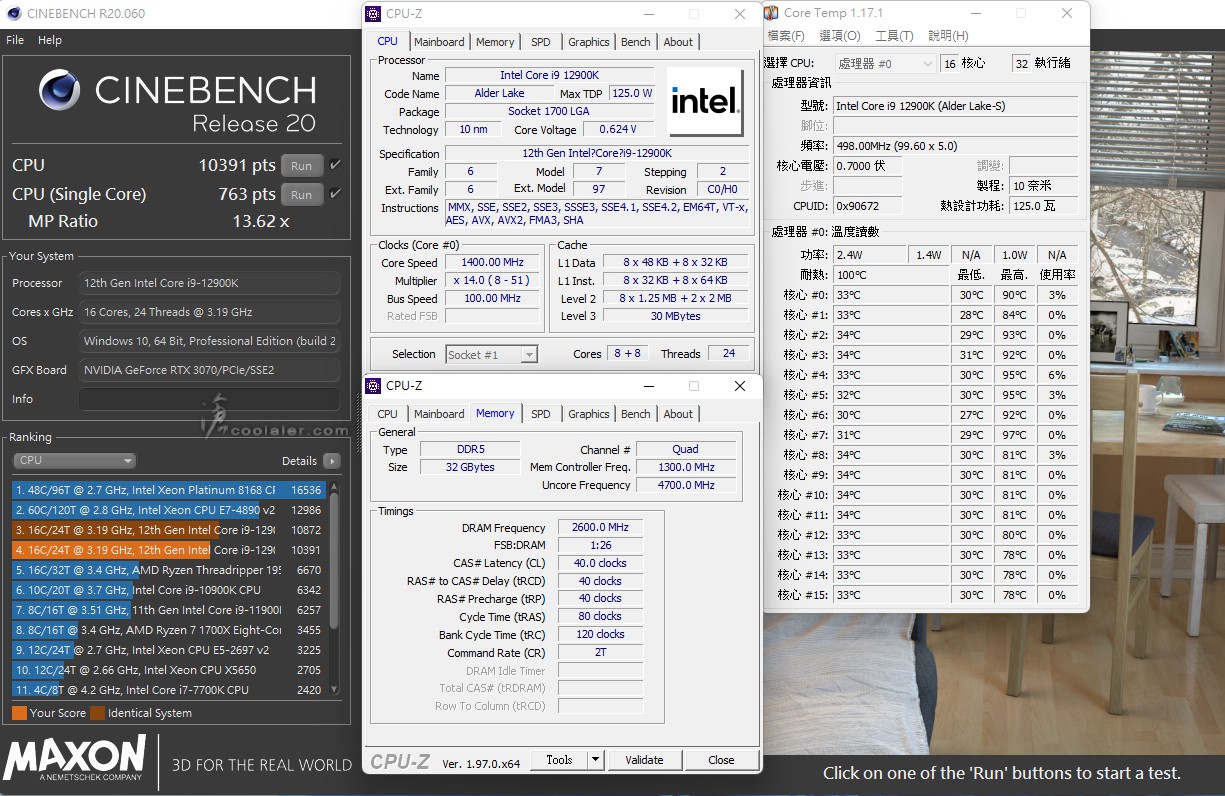
CINEBENCH R20 @ Windows 11
CPU:10391 cb
CPU 單核心:763 cb
這項目順便測試一下溫度功耗,最低31度,最高95度,全機待機功耗77W,R20最高功耗396W。
CINEBENCH R20 @ Windows 10
CPU:10384 cb
CPU 單核心:762 cb
最低31度,最高96度,全機待機功耗77W,R20最高功耗390W。
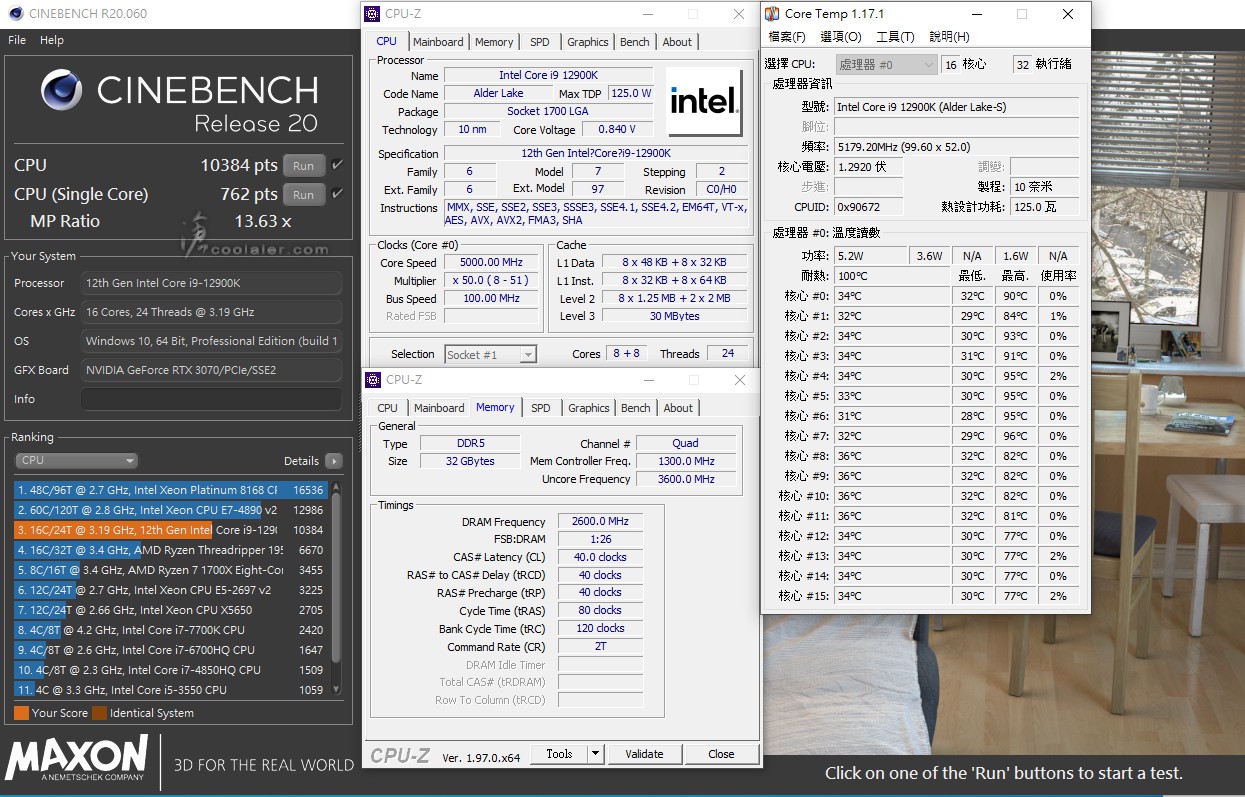
R20 在 Windows 10 正常,沒有如 R15 發生大核心罷工的問題。
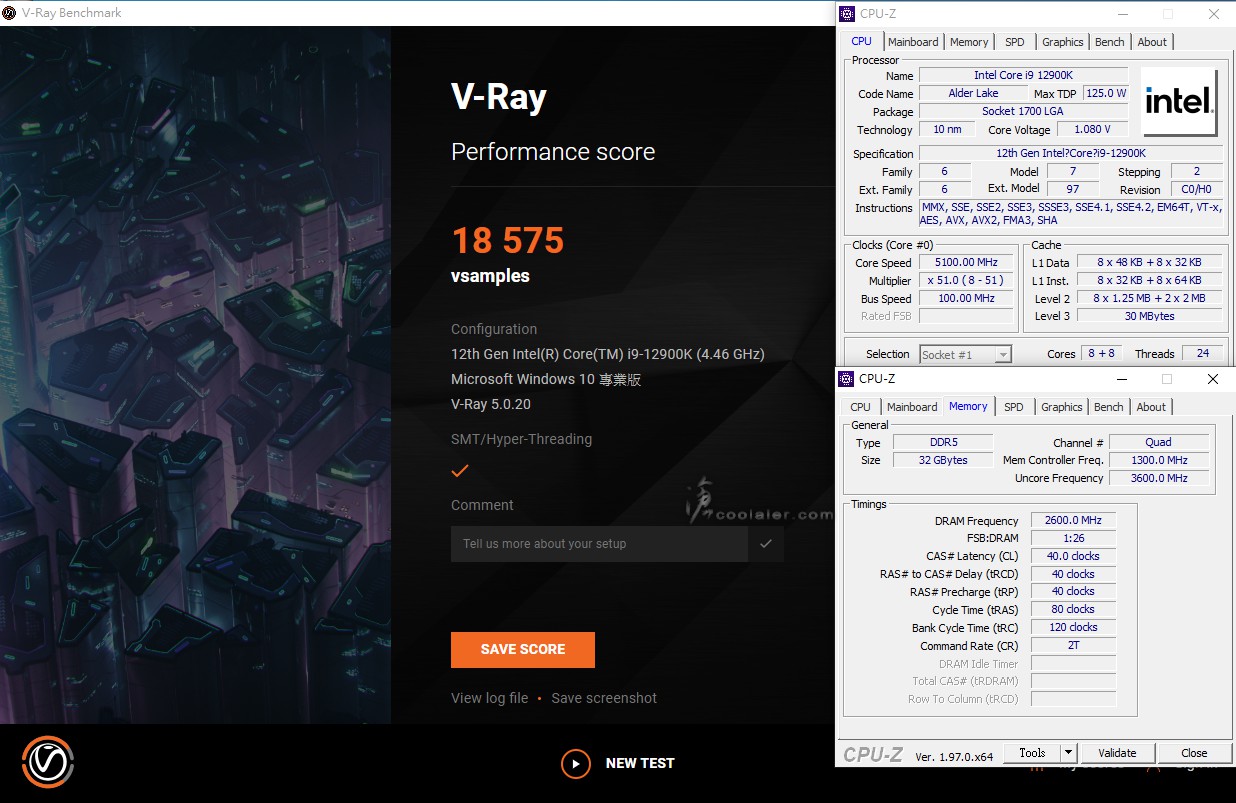
V-Ray @ Windows 11:18440

V-Ray @ Windows 10:18575
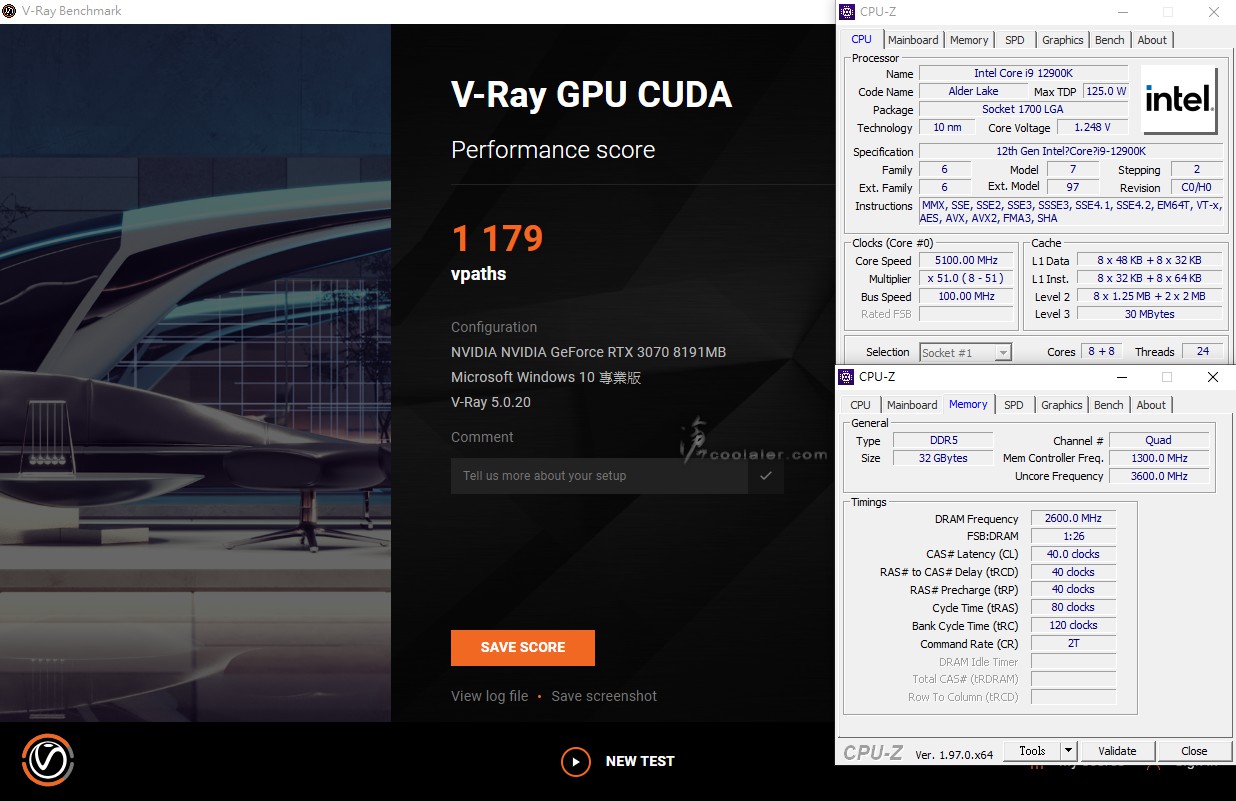
V-Ray GPU CUDA @ Windows 11:1403

V-Ray GPU CUDA @ Windows 10:1179
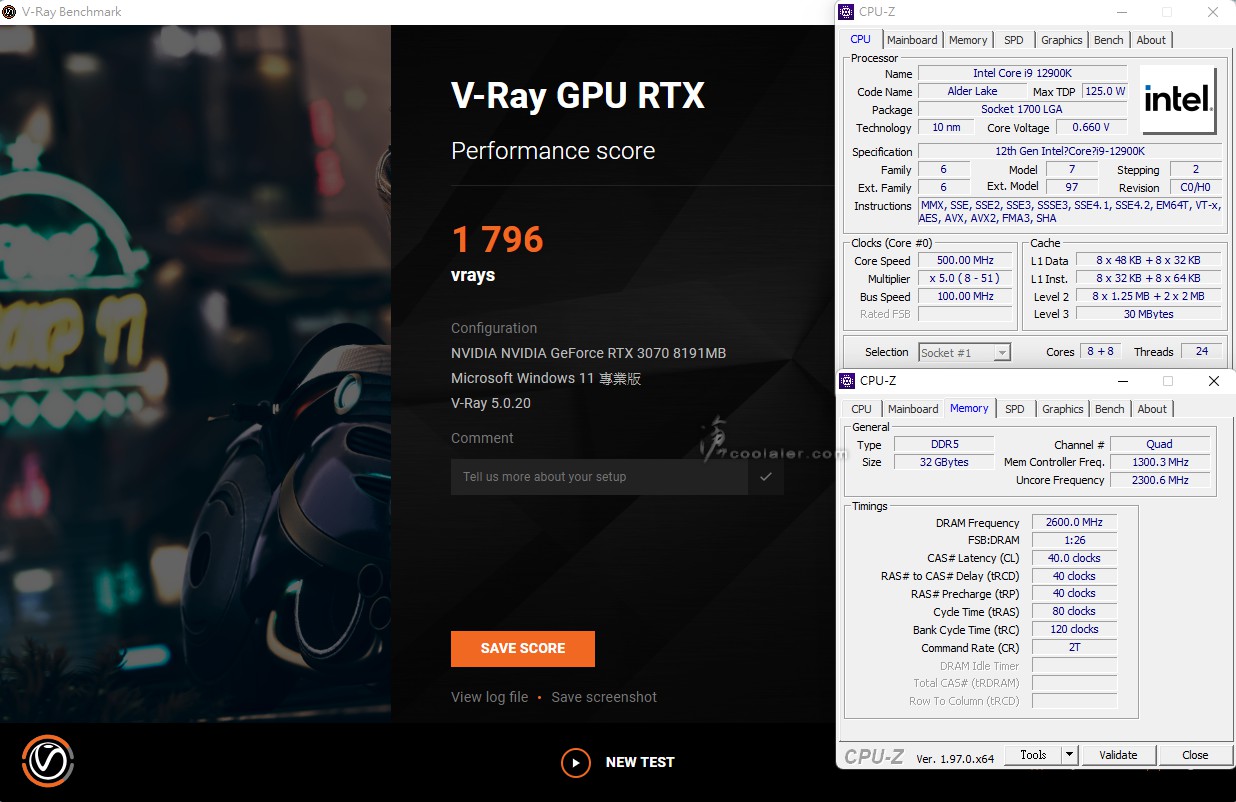
V-Ray GPU RTX @ Windows 11:1796
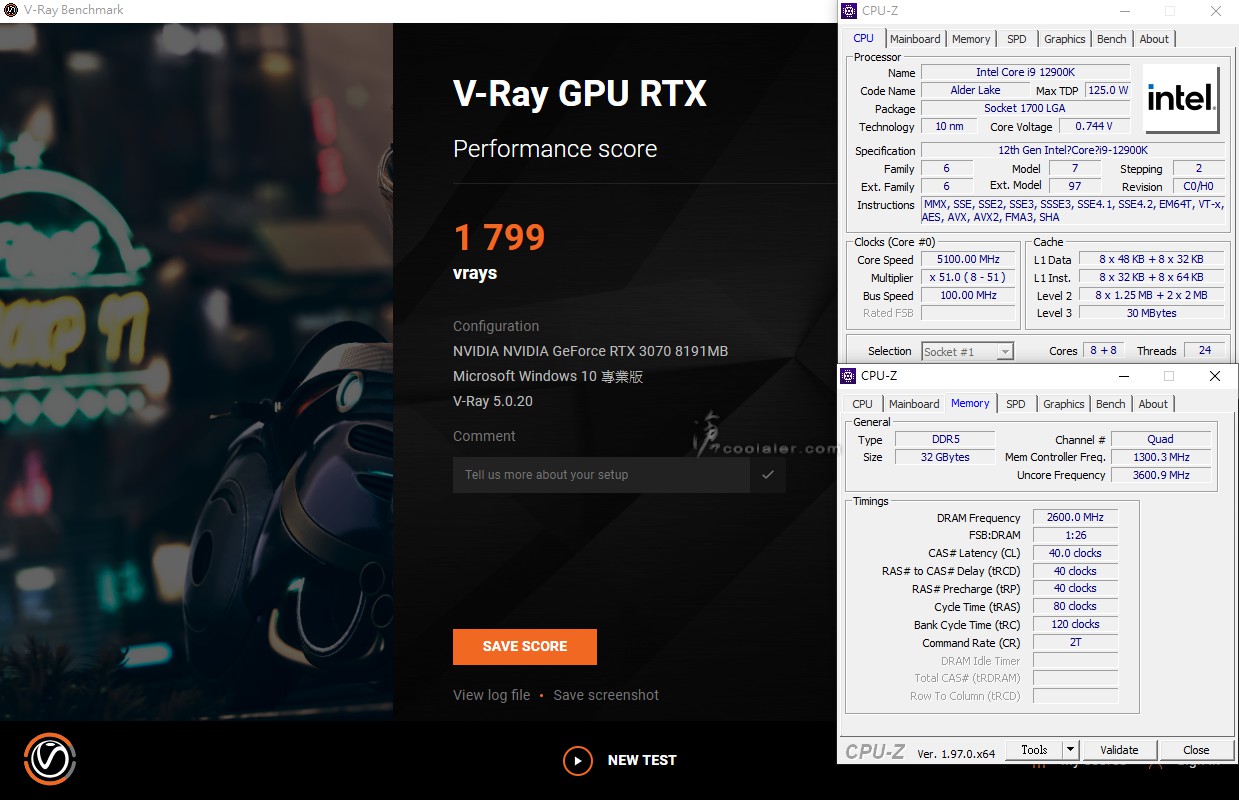
V-Ray GPU RTX @ Windows 10:1799
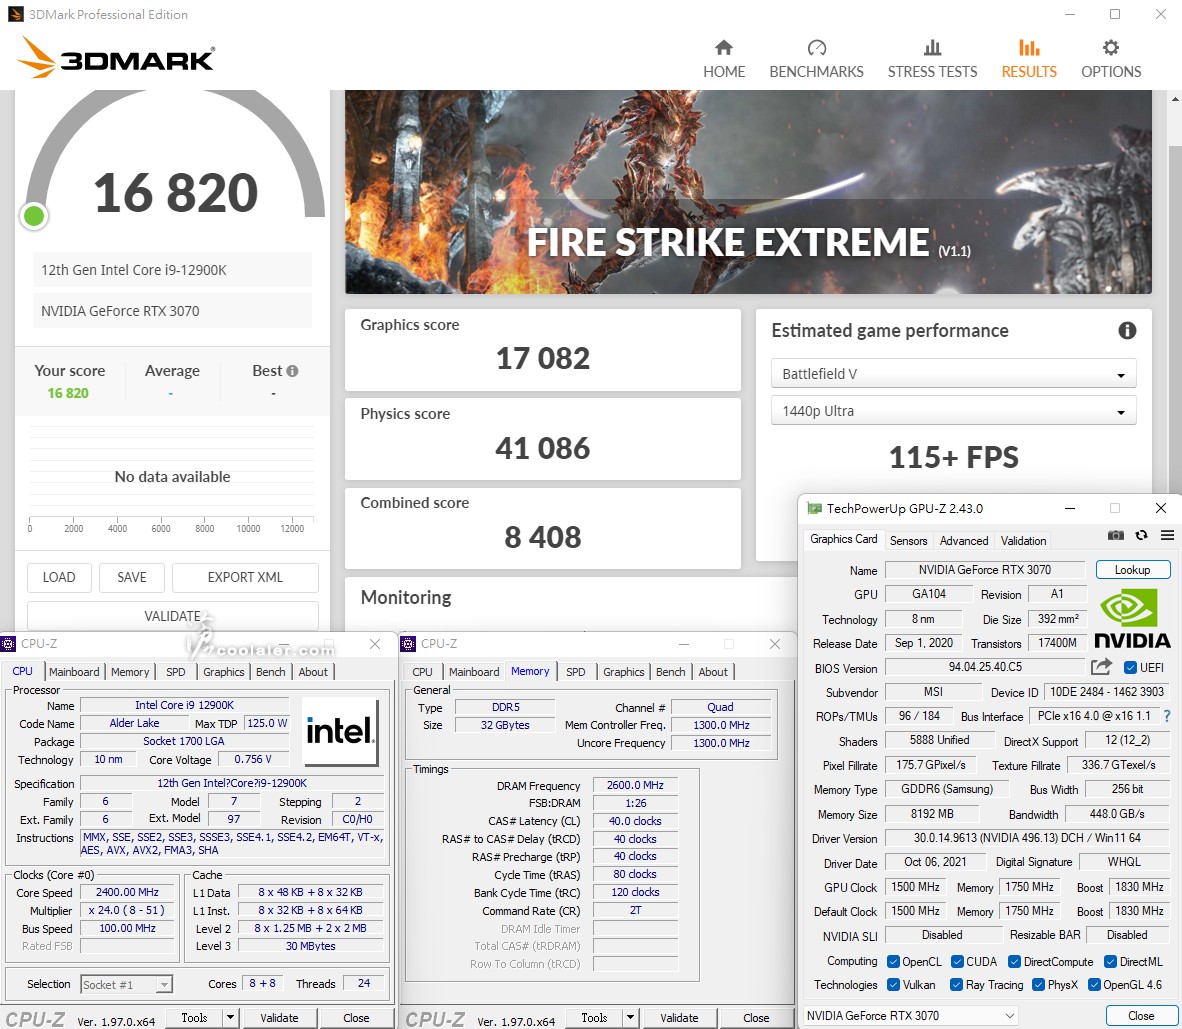
3DMark Fire Strike Extreme @ Windows 11:16820
Graphics score:17082
Physics score:41086
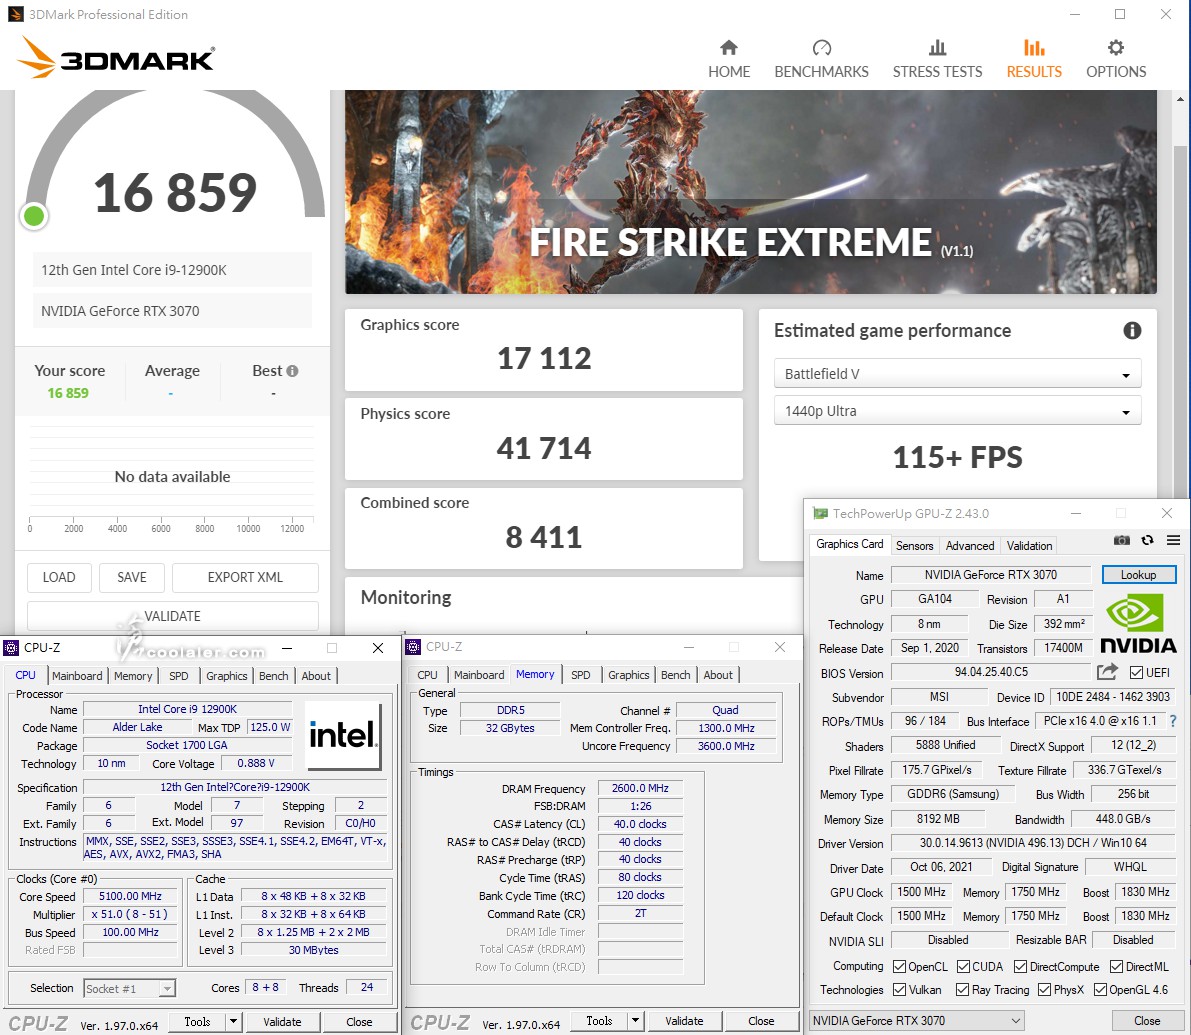
3DMark Fire Strike Extreme @ Windows 10:16859
Graphics score:17112
Physics score:41714
3DMark Fire Strike Ultra @ Windows 11:8900
Graphics score:8662
Physics score:38331

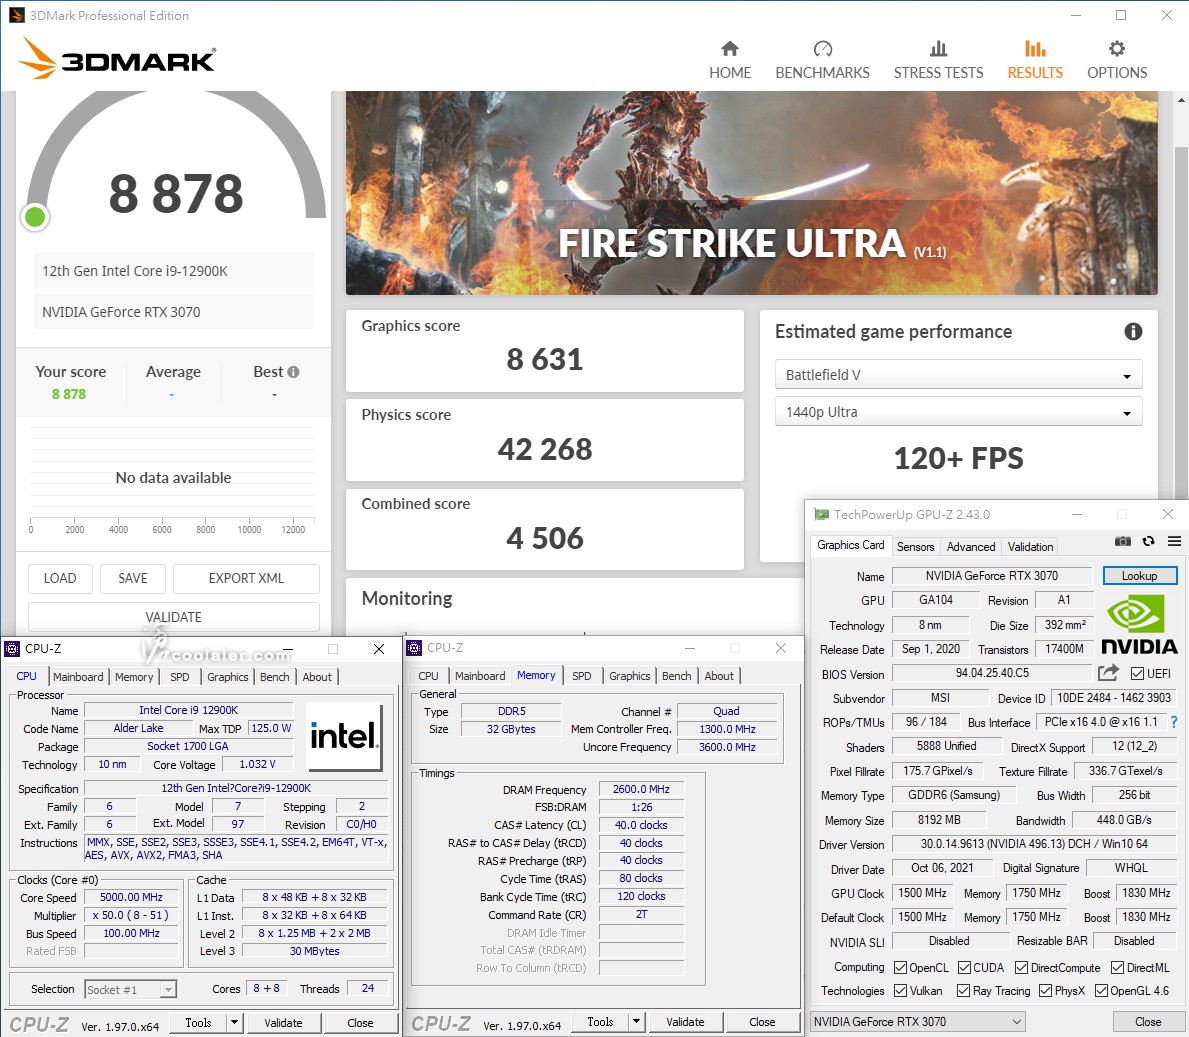
3DMark Fire Strike Ultra @ Windows 10:8878
Graphics score:8631
Physics score:42268
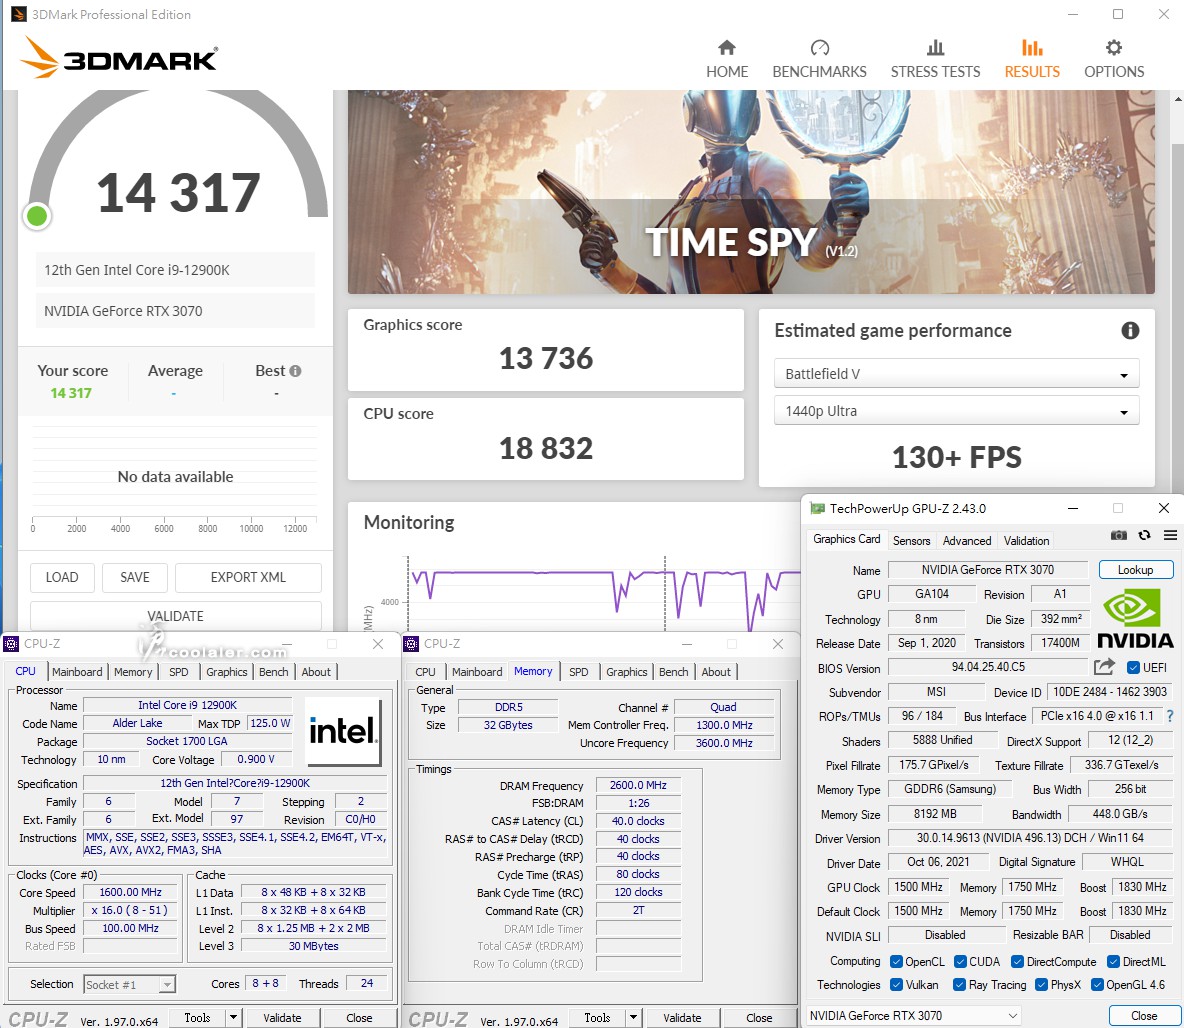
3DMark Time Spy @ Windows 11:14317
Graphics score:13736
CPU score:18832
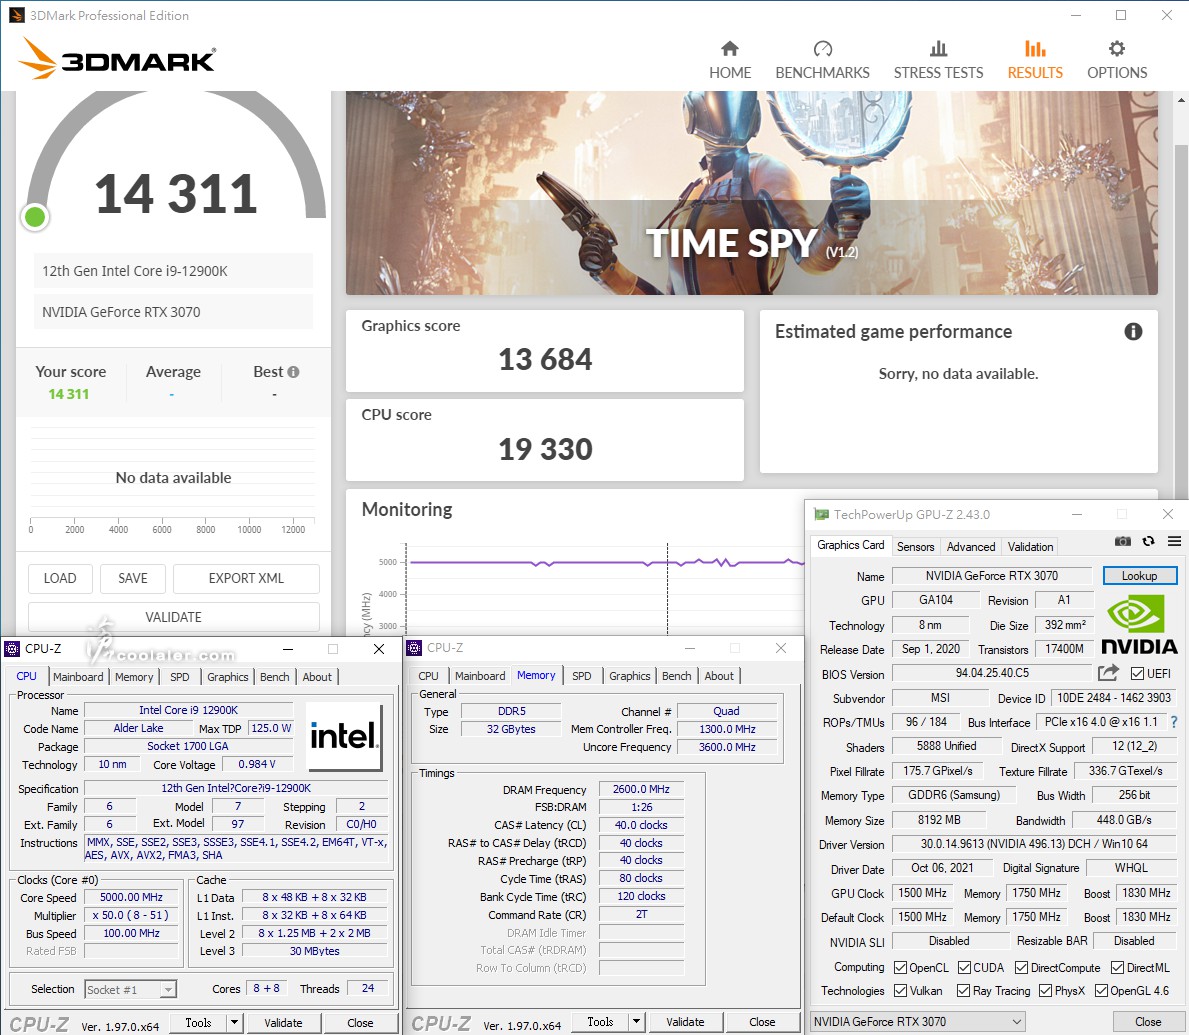
3DMark Time Spy @ Windows 10:14311
Graphics score:13684
CPU score:19330
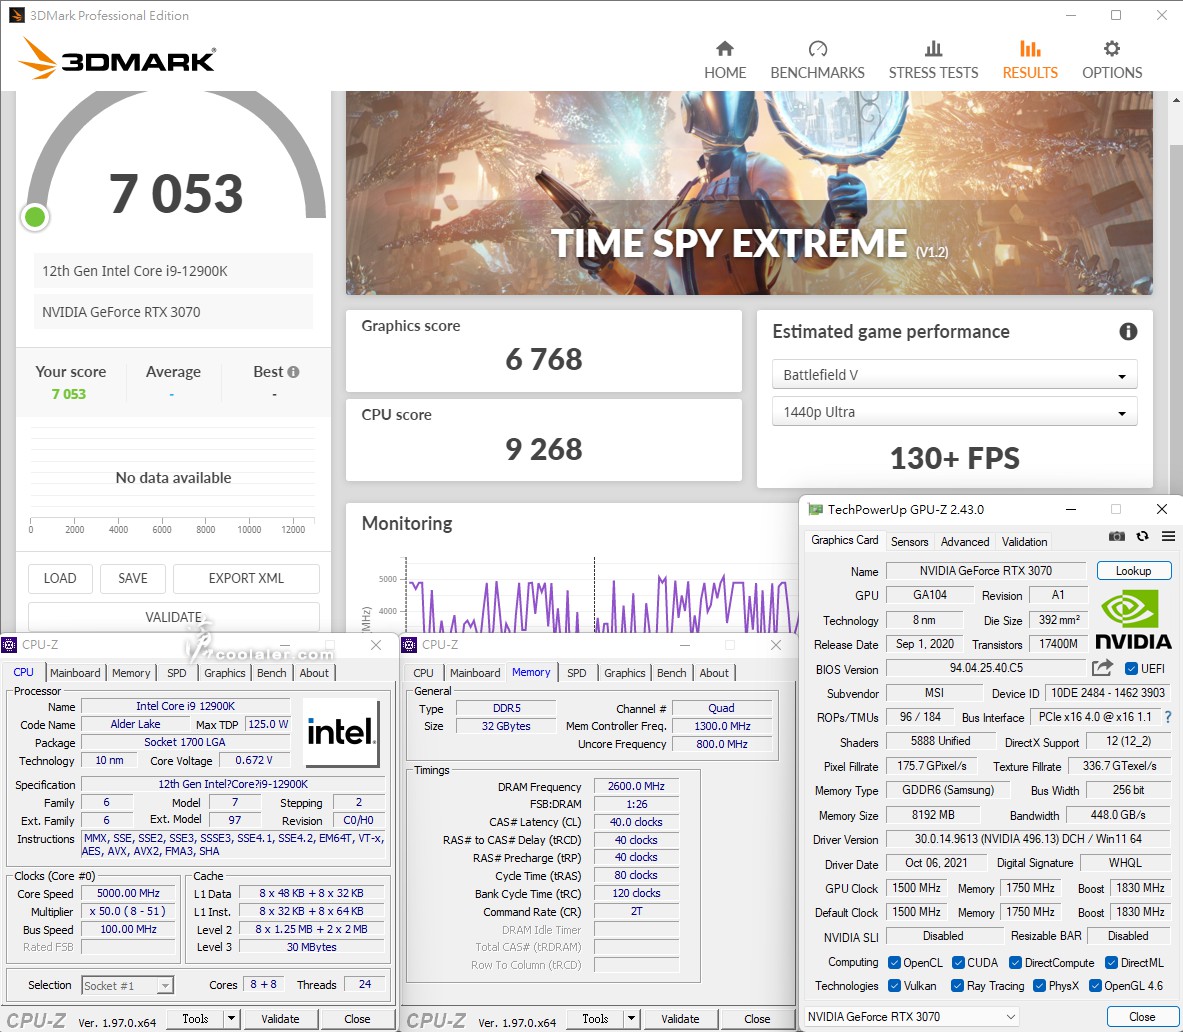
3DMark Time Spy Extreme @ Windows 11:7053
Graphics score:6768
CPU score:9268
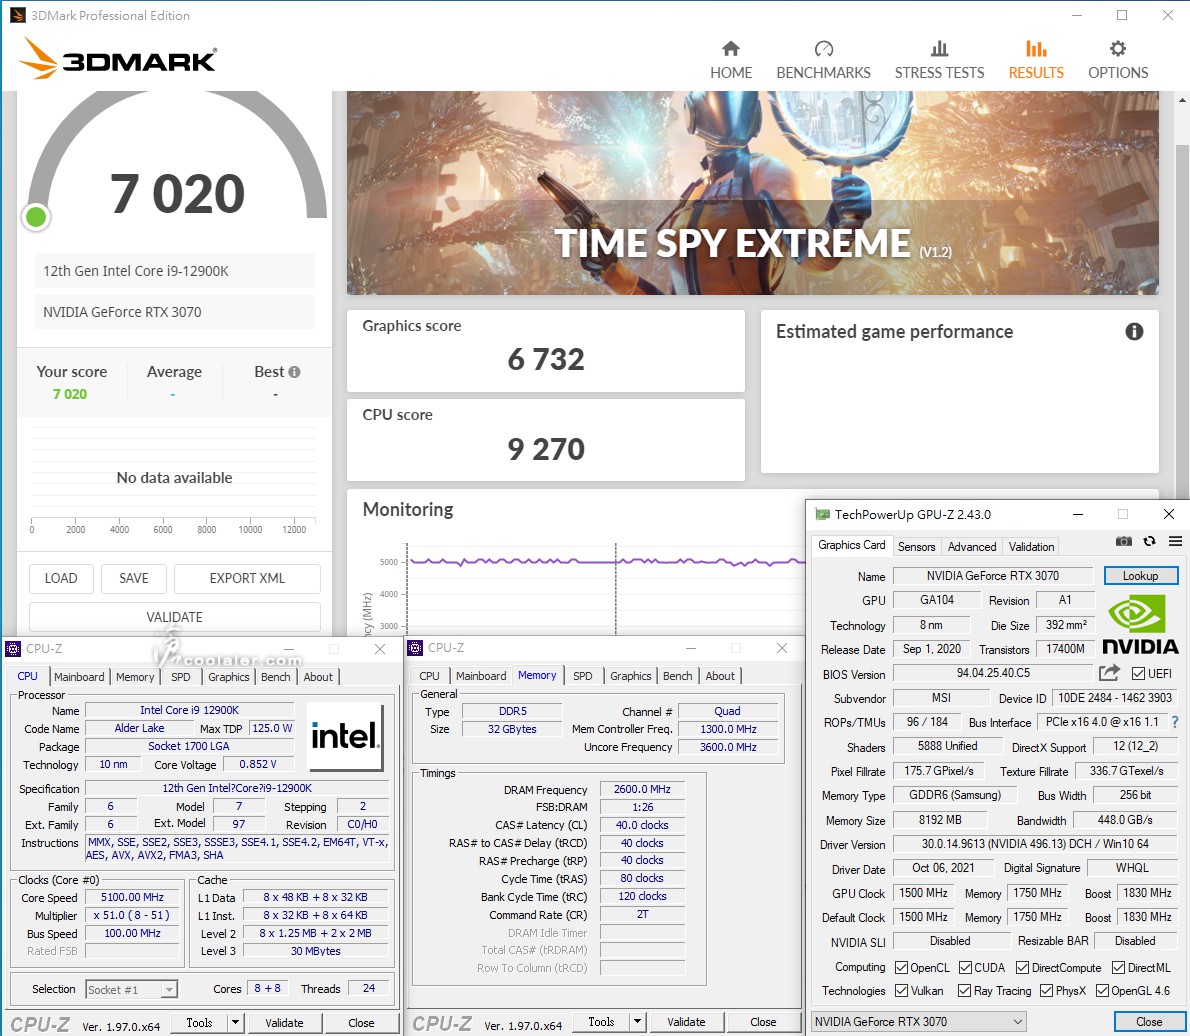
3DMark Time Spy Extreme @ Windows 10:7020
Graphics score:6732
CPU score:9270
3DMark CPU Profile @ Windows 11
1 thread:1098
2 threads:2138
4 threads:4181
8 threads:7915
16 threads:10448
Max threads:11980

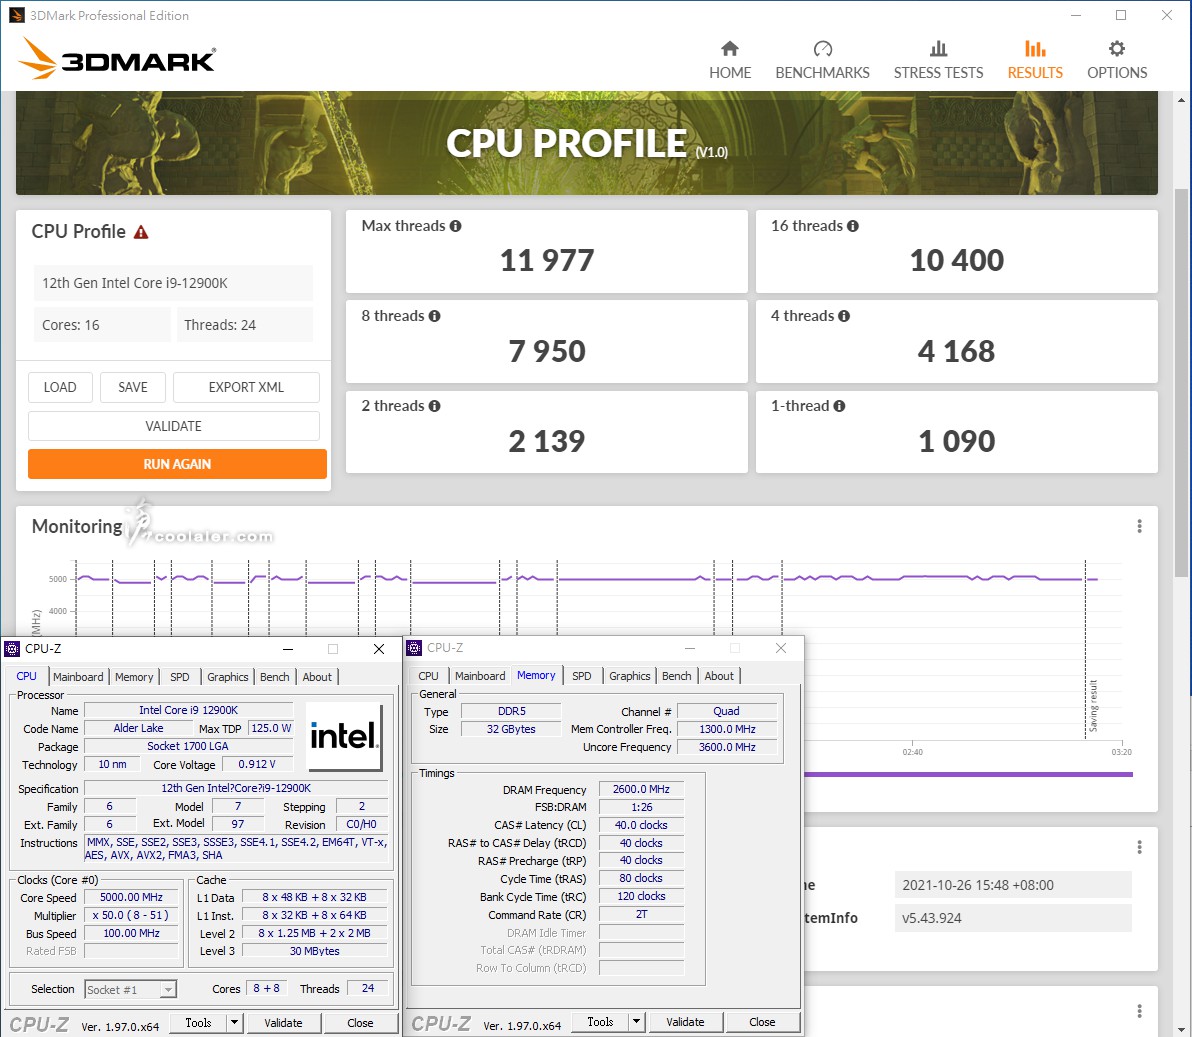
3DMark CPU Profile @ Windows 10
1 thread:1090
2 threads:2139
4 threads:4168
8 threads:7950
16 threads:10400
Max threads:11977
CPU Upgrade 超頻
接著是 Z690 AORUS MASTER 在 BIOS 內 CPU Upgrade 調用 Max Performance Profile 超頻。括弧後面為預設值的成績,最後會有比較表。
CPU-Z
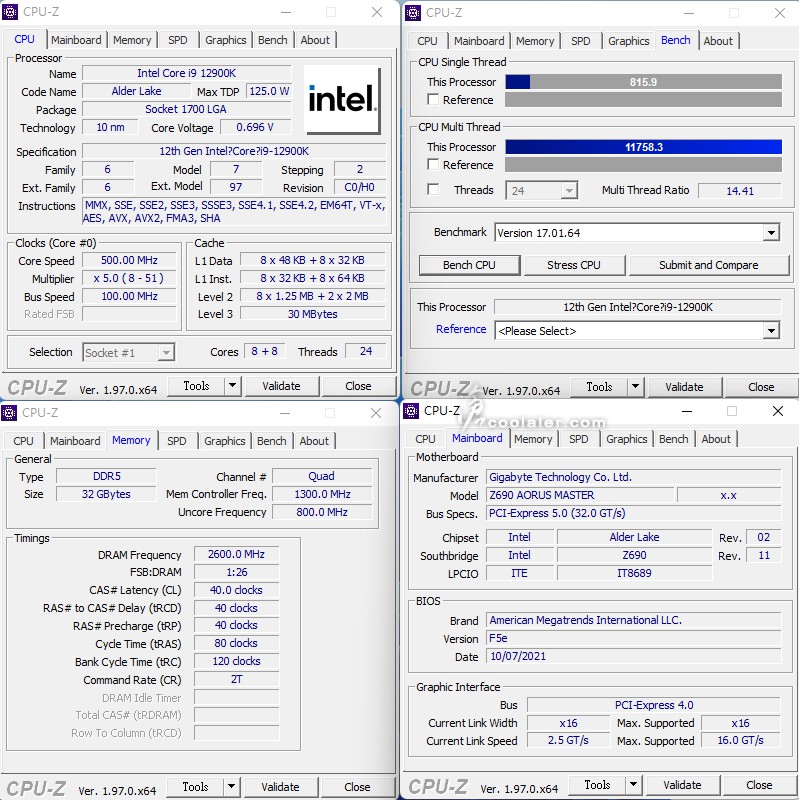
CPU Single:815.9(815.0)
CPU Multi:11758.3(11365.3)+3.5%
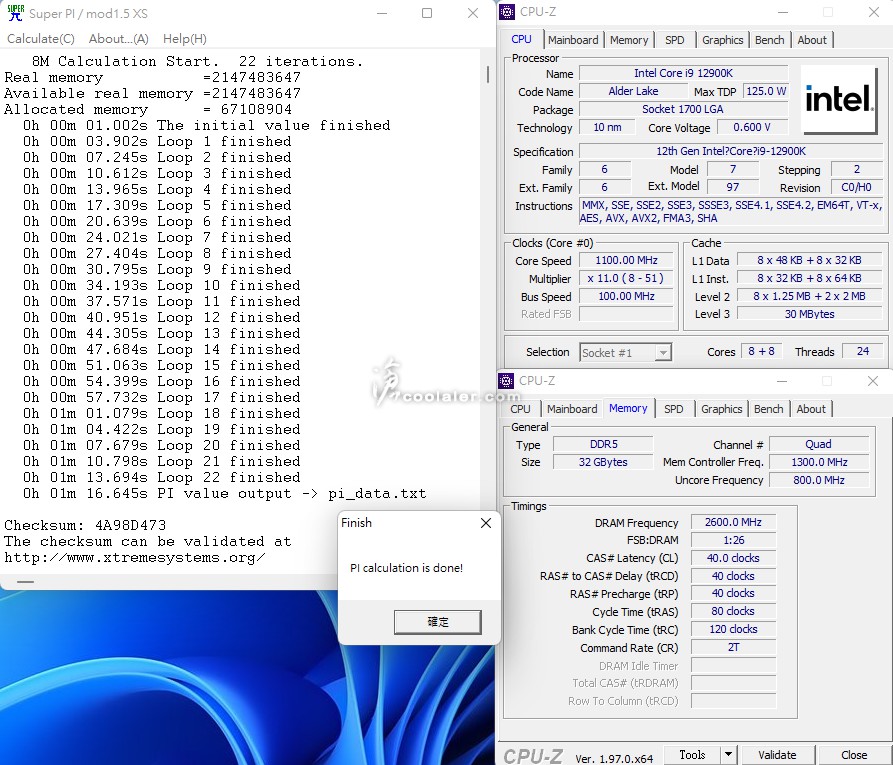
SupertPI 1M & CPUmark99
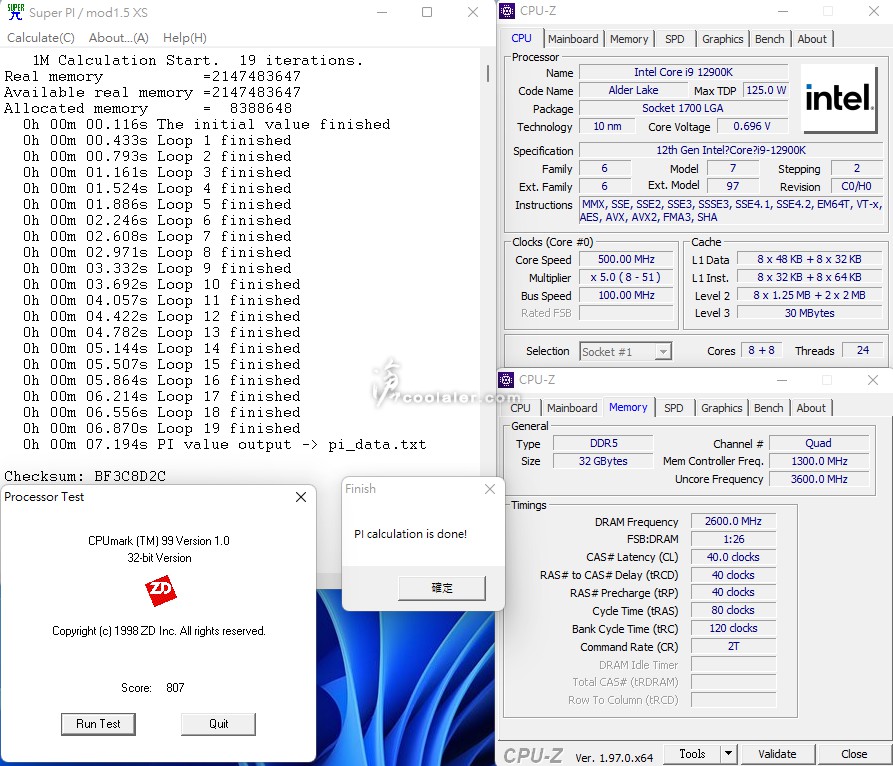
SuperPI 1M:7.194s(7.056s)
CPUmark99:807(810)
SuperPI 8M:1m16.645s(1m13.747s)
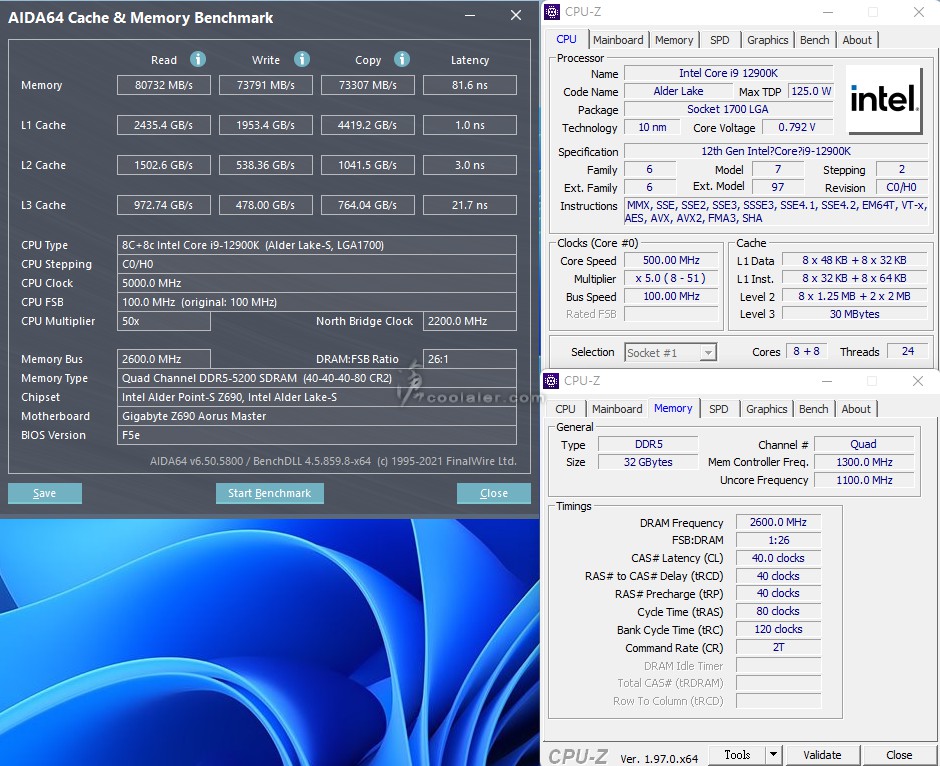
Memory Benchmark
Read:80732 MB/s(81458 MB/s)
Write:73791 MB/s(74181 MB/s)
Copy:73307 MB/s(73679 MB/s)
Latency:81.6 ns(79.4 ns)
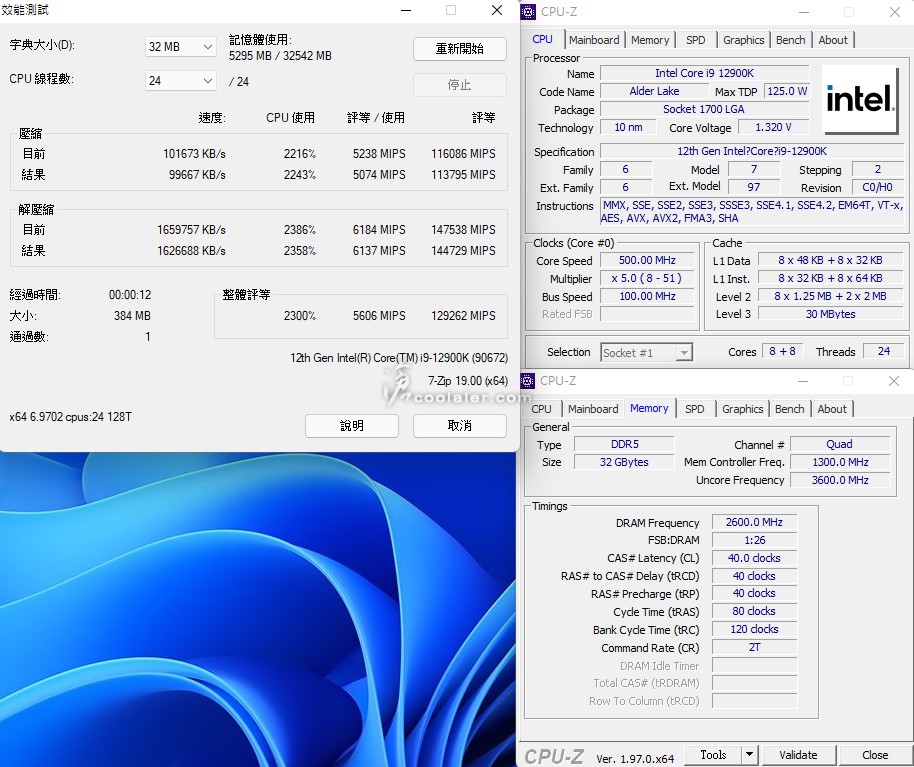
7-Zip 19.00
壓縮:113795 MIPS(111152 MIPS)+2.4%
解壓縮:144729 MIPS(139322 MIPS)+3.9%
整體評等:129262 MIPS(125237 MIPS)+3.2%
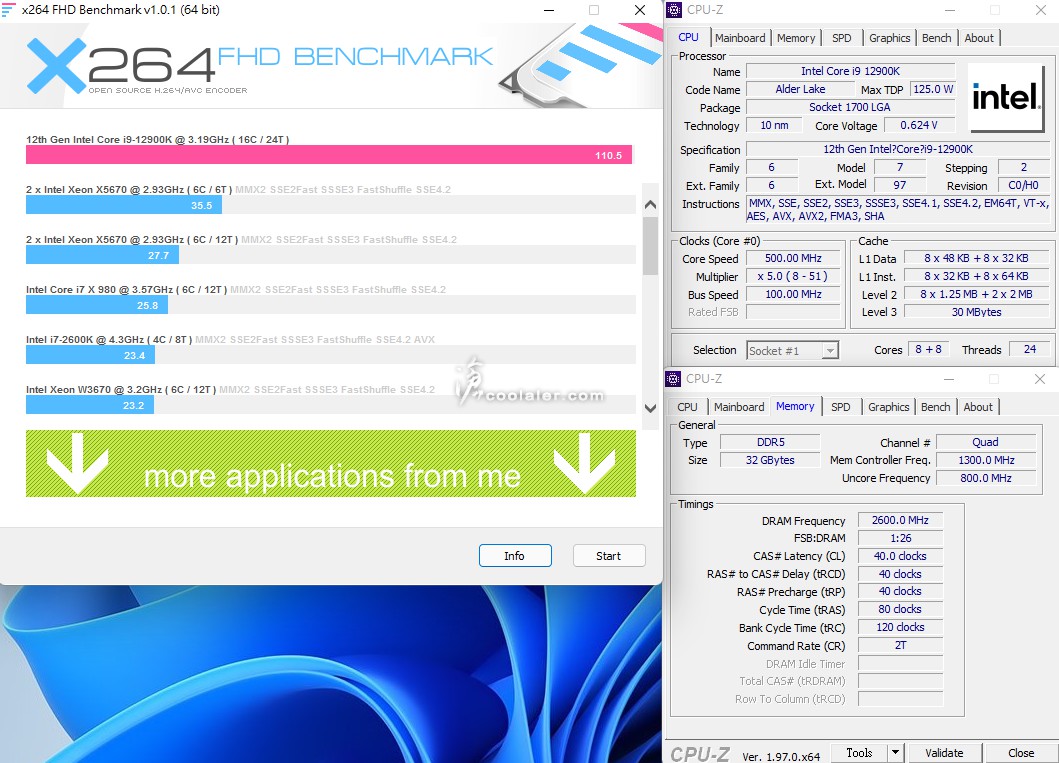
x264 FHD Benchmark:110.5(104.9)+5.3%
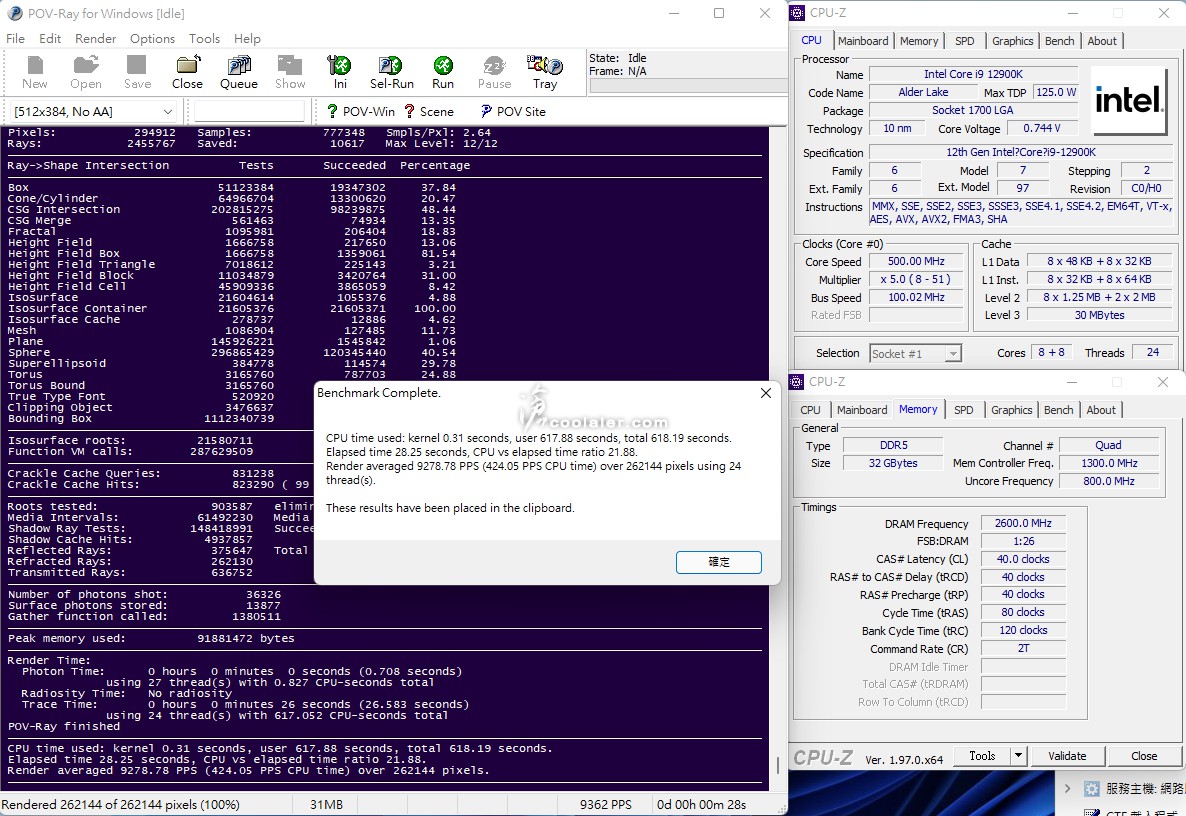
POV-Ray:28.25s(29.03s)+2.7%
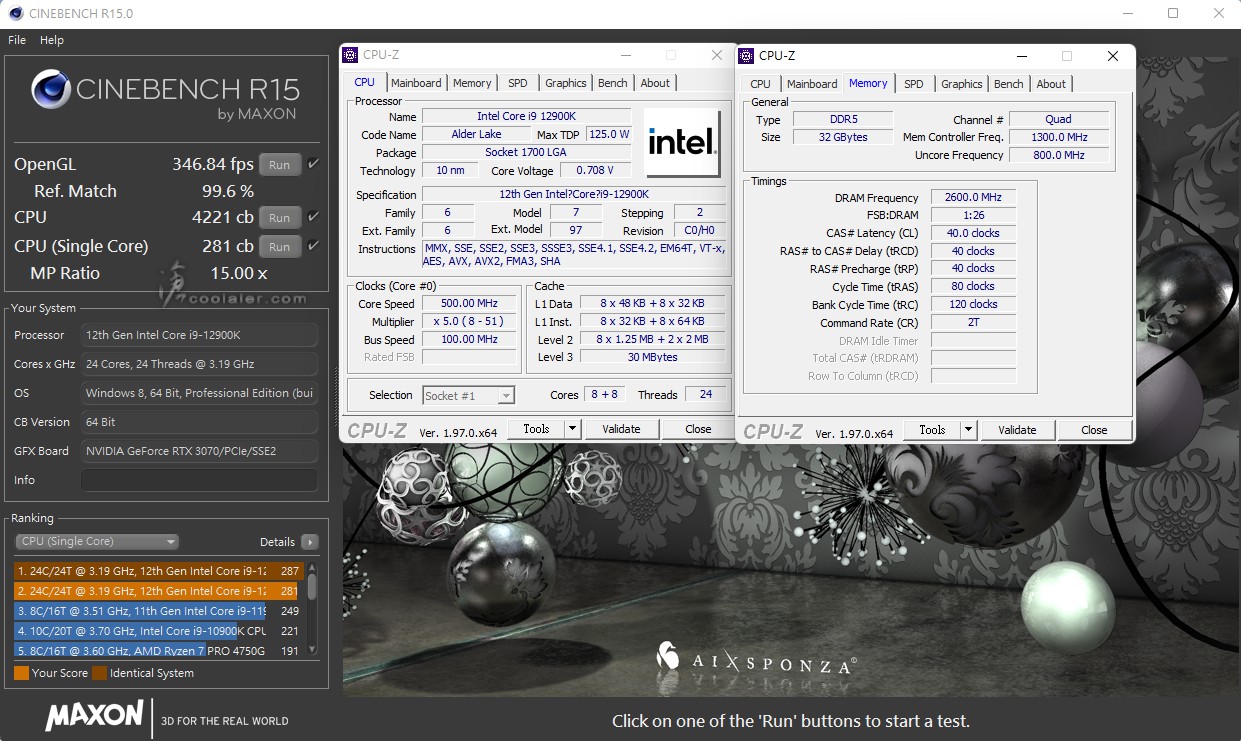
CINEBENCH R15
OpenGL:346.84 fps(340.66 fps)
CPU:4221 cb(4077 cb)+3.5%
CPU 單核心:281 cb(287 cb)
CINEBENCH R20
CPU:10673 cb(10391 cb)+2.7%
CPU 單核心:749 cb(763 cb)
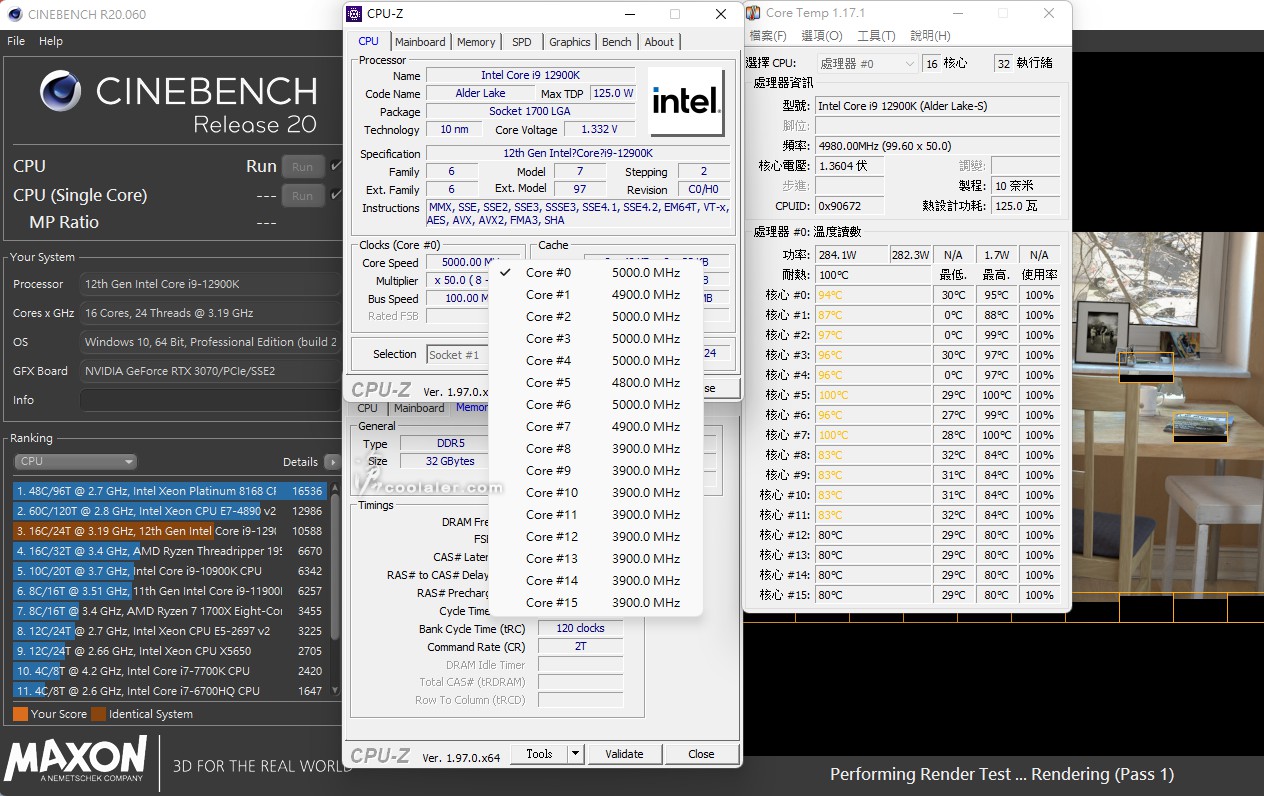
這項目順便測試一下溫度功耗,最低31度(31度),最高100度(95度),全機待機功耗77W(77W),R20最高功耗429W(396W)。
可以看到調用 Max Performance Profile 全核心負載最高大概在4.9~5.0GHz之間。這部分應該會視散熱器以及溫度而定。
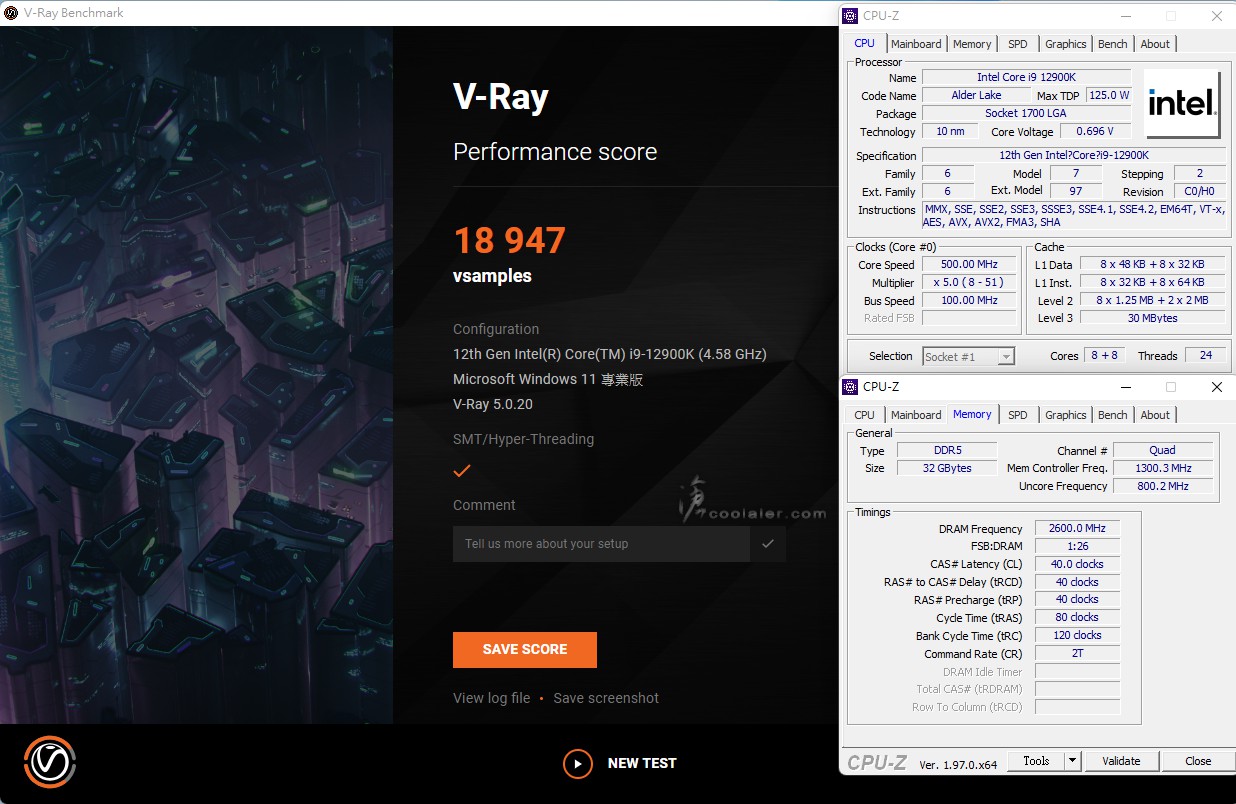
V-Ray:18947(18440)+2.7%
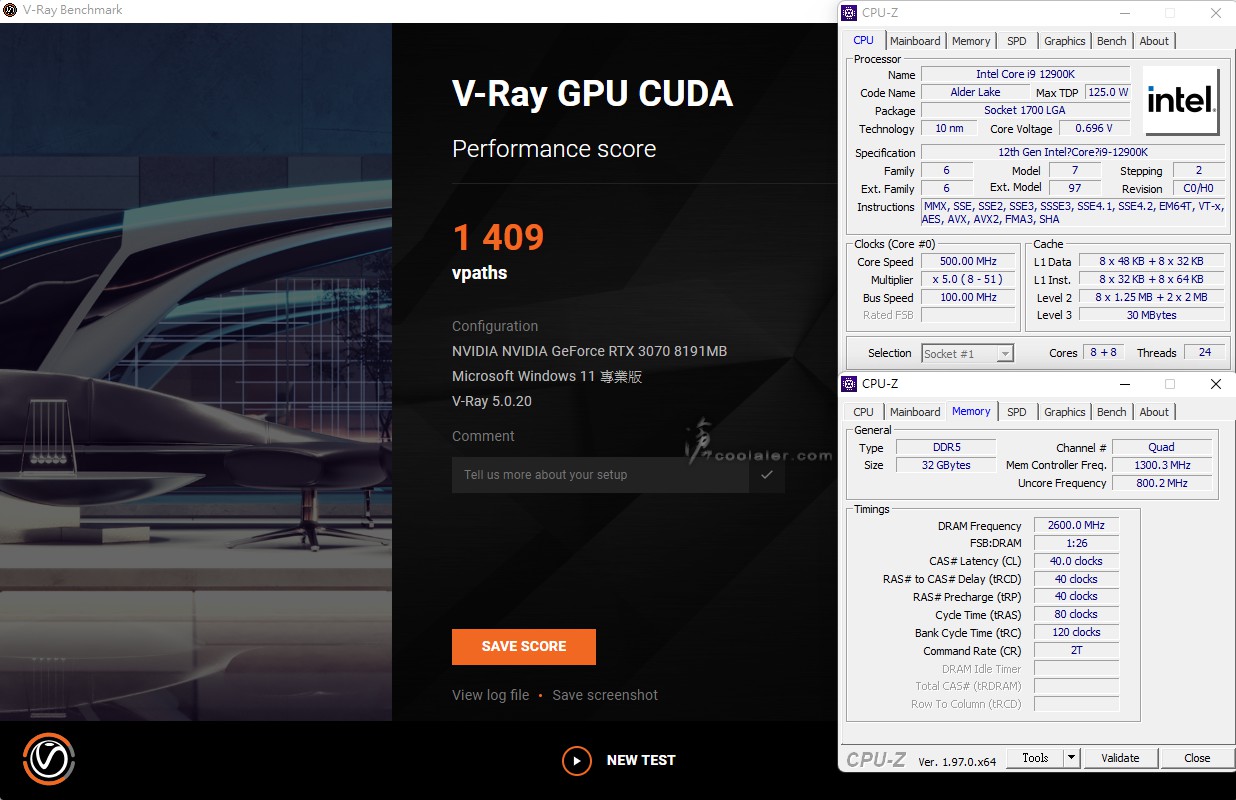
V-Ray GPU CUDA:1409(1403)
V-Ray GPU RTX:1801(1796)

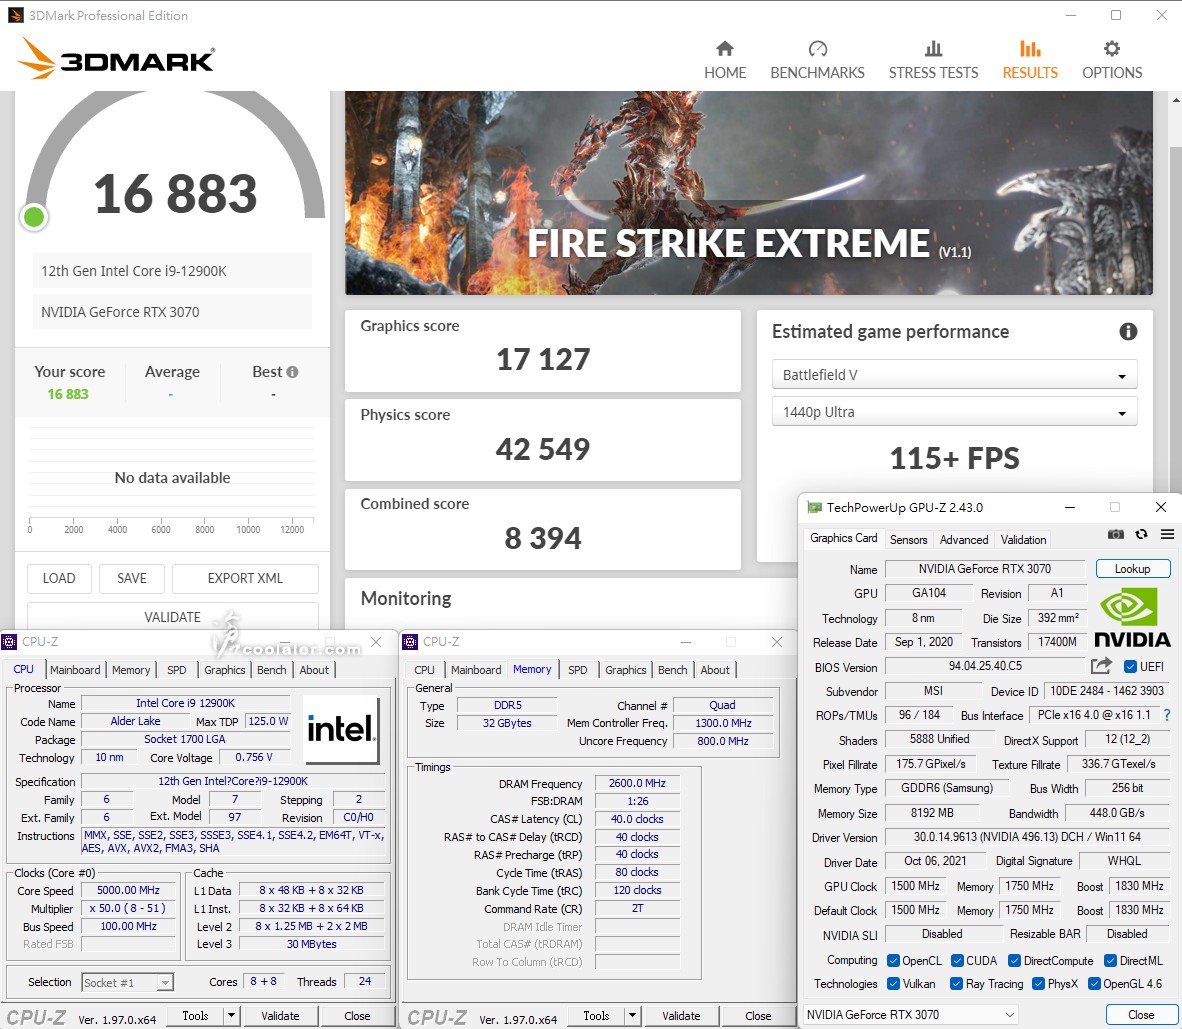
3DMark Fire Strike Extreme:16883(16820)
Graphics score:17127(17082)
Physics score:42549(41086)+3.6%
3DMark Fire Strike Ultra:8903(8900)
Graphics score:8667(8662)
Physics score:39388(38331)+2.8%

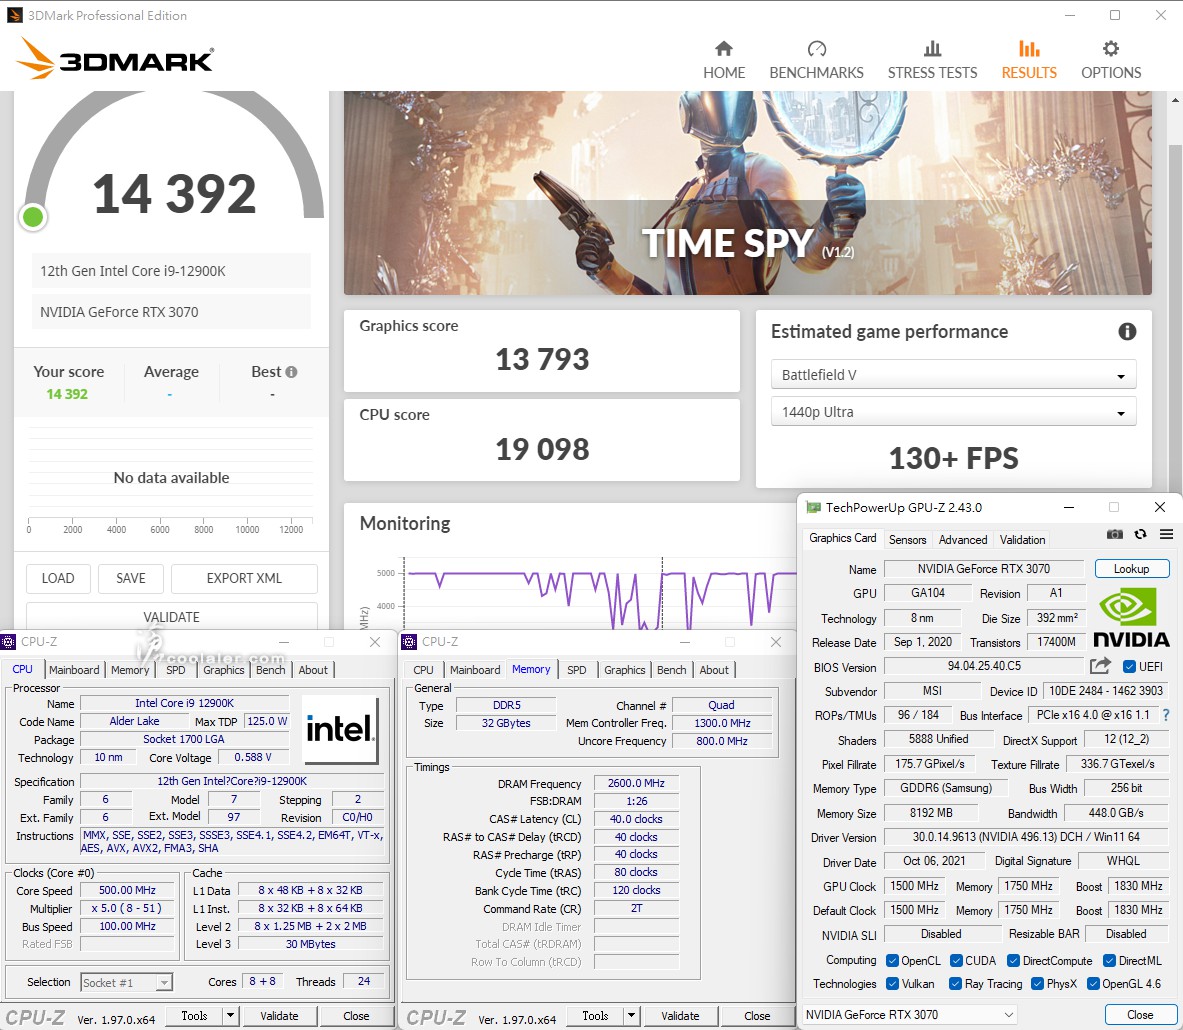
3DMark Time Spy:14392(14317)
Graphics score:13793(13736)
Physics score:19098(18832)+1.4%
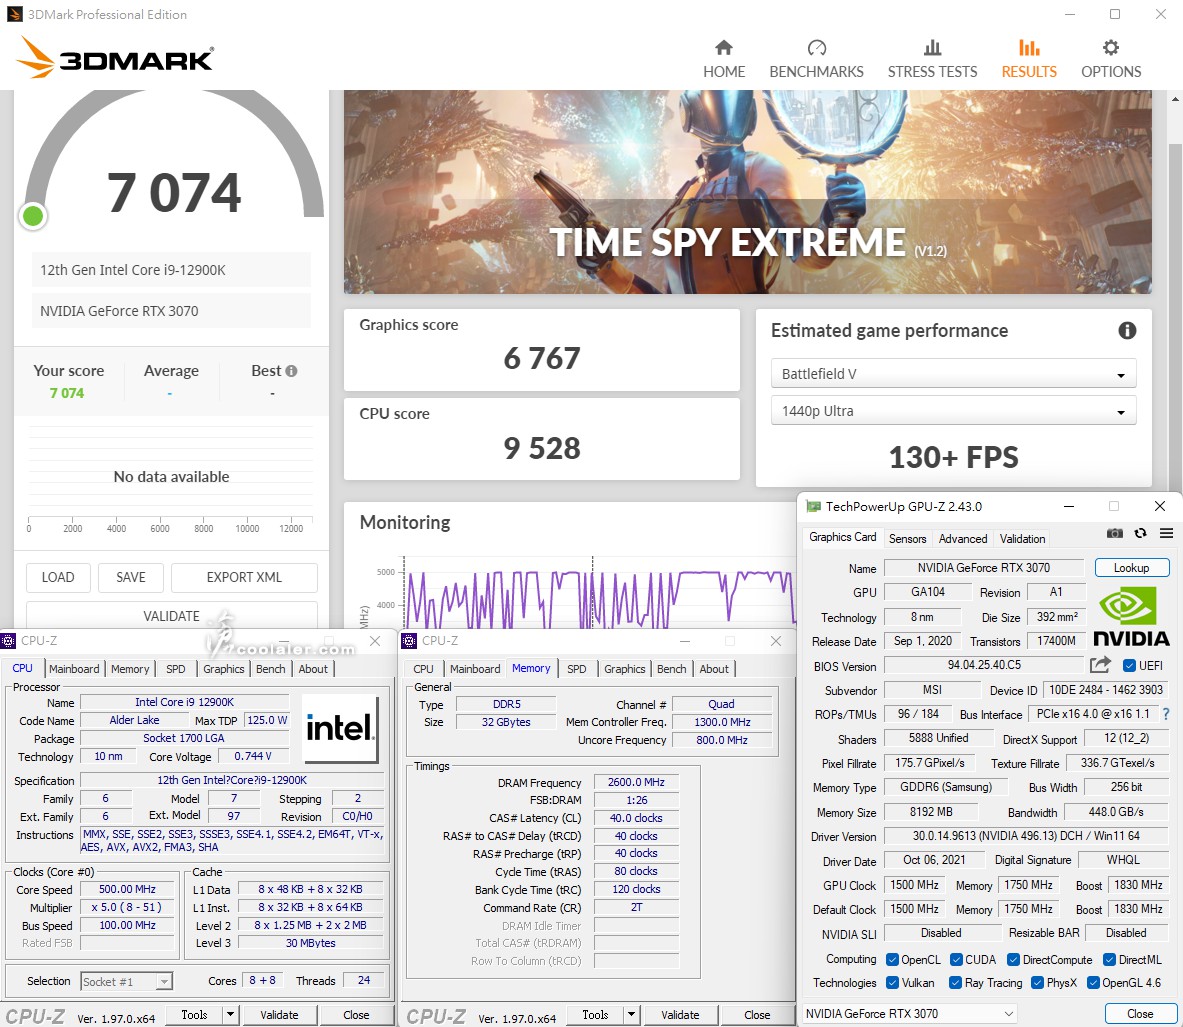
3DMark Time Spy Extreme:7074(7053)
Graphics score:6767(6768)
Physics score:9528(9268)+2.8%
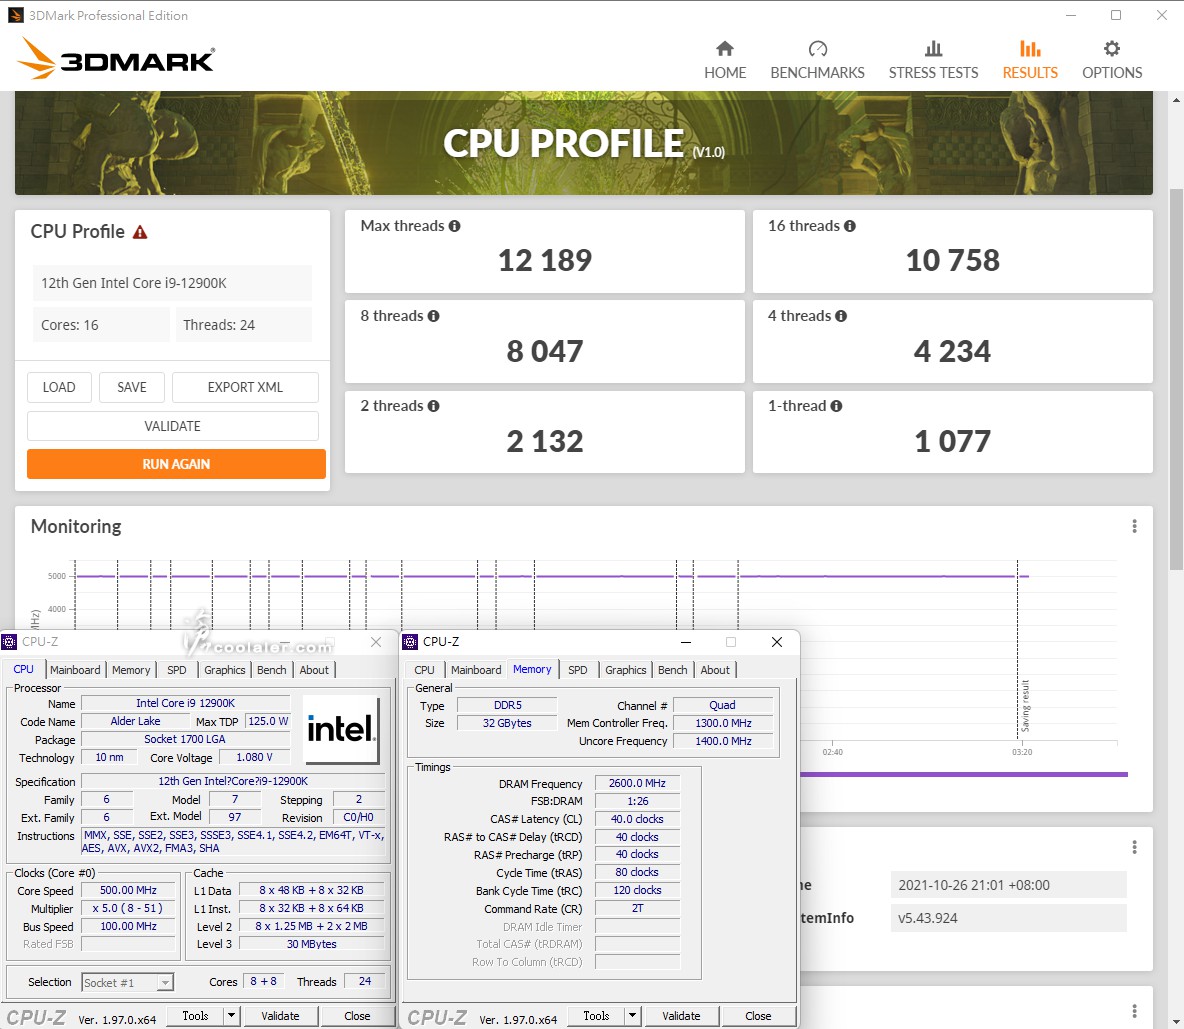
3DMark CPU Profile
1 thread:1077(1098)
2 threads:2132(2138)
4 threads:4234(4181)+1.3%
8 threads:8047(7915)+1.7%
16 threads:10758(10448)+3%
Max threads:12189(11980)+1.7%
比較表

小結
Intel 第12代搭配 Windows 11 目前來看是比較能正常發揮大小核心的調度,在測試裡面 POV-Ray 以及 CINEBENCH R15 在核心調度是比較有問題,有時候只有小核心在工作,大核心幾乎是停擺,當然這效能差異就明顯差很大,其餘大部分測試時並沒有發現這問題,正常下效能 Windows 11 與 10 的差異大概也只在誤差值裡面,或許有差但真的沒有到很大,據稱 Windows 10 大小核心調度問題可能之後也會有補丁解決,不過既然你都用了 Windows 10 而不是糾結在 Windows 7,那何不就升級 Windows 11 就好了。
GIGABYTE Z690 AORUS MASTER 搭配 Core i9-12900K 在預設下就發揮不錯的效能,這一代 Core i9 不管在單核心或多核心效率上都相當有感提升,多核心甚至可以接近 AMD Ryzen 9 5950X,以8大核心加上8小核心共24執行緒打16核32執行緒算是很猛,不過也因為在效能上算是榨得兇,對於溫度與功耗來說仍是較高一些。
Z690 AORUS MASTER 可以透過 BIOS 內的 CPU Upgrade 調用 Max Performance Profile 懶人超頻,把 12900K 的多核心效能多壓出 2~3%,不過這部分並不是絕對,這得視使用的 CPU 散熱器,也就是 CPU 溫度決定,全載時如果觸及到溫度保護就會降頻,也就是如果有更好的散熱器,可能效能還會更高一些。
Z690 與 Z590 最大的不同就是支援 DDR5 以及還未有產品支援的 PCIe Gen5,當然隔代給更多的介面通道這些都是必須的,這一代平台並無法向下相容,但也帶來了相當有感的升級以及效能,且處理器就售價上來看並不貴,如果覺得搭配 DDR5 價格太高倒是可以選擇 DDR4 的 Z690 主機板。
不過 Windows 10 在 Intel 12代上面真的無法有效發揮?此篇將針對 Intel 第12代處理器 Core i9-12900K 在 Windows 11 以及 Windows 10 上面進行效能比較。另外還有 Z690 AORUS MASTER 內建的 CPU Upgrade 快速超頻效能測試。
在這之前有針對 GIGABYTE Z690 AORUS MASTER 進行開箱,詳細請參閱連結。
測試之前先來看看 GIGABYTE Z690 AORUS MASTER 的 BIOS 選單。
BIOS 簡介
BIOS 介面相較於 Z590 差異並不是太大,以下為簡易模式,主要用於顯示目前系統資訊。
進階模式分有 Favorites、Tweaker、Settings、System Info、Boot、Save & Exit 幾項。Tweaker 裡面主要是針對超頻調校,可以調整 CPU 倍頻、外頻、進階 CPU 選項、記憶體時脈、參數、電壓等。
CPU Upgrade 簡單說就是屬於比較保守的超頻,裡面有兩種模式可調用,Gaming Profile、Max Performance Profile,左下角有說明,Gaming 倍頻+1,Max 倍頻+3,建議使用比較好的 CPU 散熱器才進行調整。
進階 CPU 選項。
DDR5 XMP Booster,這部分可以針對顆粒不同進行快速調用超頻,在右側邊主機板會判讀所使用的顆粒,如使用的這組為 Kingston FURY DDR5 5200,顯示的是 Micron 顆粒,就可以直接調用 5400 來超頻,當然這不一定保證就能穩定運作,還是得透過燒機來測試,但內建的就是 GIGABYTE 工程師所測試多數可以穩定的時脈、參數、電壓。
記憶體選項。
有完整的電壓選項可調。
Smart Fan 6,可針對風扇轉速對應溫度進行調整。
測試平台
CPU: Intel Core i9-12900K
CPU Cooler: MSI MEG CORELIQUID S360
RAM: Kingston FURY DDR5 5200MHz 16GBx2
MB: GIGABYTE Z690 AORUS MASTER
VGA: MSI RTX 3070 GAMING X TRIO
SSD: GIGABYTE AORUS NVMe Gen4 SSD 1TB
PSU: IN WIN SI 1065W
OS: Windows 11 & Windows 10
測試針對 Windows 11 以及 Windows 10 個別跑過同樣項目,並比較效能差異,Window 10 已經更新到最新版本。
CPU-Z @ Windows 11
CPU Single:815.0
CPU Multi:11365.3
CPU-Z @ Windows 10
CPU Single:819.6
CPU Multi:11462.3
SupertPI 1M & CPUmark99 @ Windows 11
SuperPI 1M:7.056s
CPUmark99:810
SupertPI 1M & CPUmark99 @ Windows 10
SuperPI 1M:7.062s
CPUmark99:824
SuperPI 8M @ Windows 11:1m13.747s
SuperPI 8M @ Windows 10:1m12.808s
Memory Benchmark @ Windows 11
Read:81458 MB/s
Write:74181 MB/s
Copy:73679 MB/s
Latency:79.4 ns
Memory Benchmark @ Windows 10
Read:81533 MB/s
Write:73962 MB/s
Copy:73832 MB/s
Latency:75.5 ns
7-Zip 19.00 @ Windows 11
壓縮:111152 MIPS
解壓縮:139322 MIPS
整體評等:125237 MIPS
7-Zip 19.00 @ Windows 10
壓縮:110742 MIPS
解壓縮:139322 MIPS
整體評等:125032 MIPS
x264 FHD Benchmark @ Windows 11:104.9
x264 FHD Benchmark @ Windows 10:104.8
POV-Ray @ Windows 11:29.03s
POV-Ray @ Windows 10:59.09s
POV-Ray 這部分成績差異較大,可以看到 POV-Ray 在 Windows 10 執行時只有約40%的核心負載,而不是100%。
CINEBENCH R15 @ Windows 11
OpenGL:340.66 fps
CPU:4077 cb
CPU 單核心:287 cb
CINEBENCH R15 @ Windows 10
OpenGL:330.04 fps
CPU:4093 cb
CPU 單核心:177 cb
R15上面一樣有 POV-Ray 的問題,可以看下圖,跑第二次多核心成績變成了1242 cb,大幅降低。
執行時 Core Temp 可以看到只有#8~#15核心是100%,其餘#0~#7是沒有負載,總負載是39~40%,與 POV-Ray 相同,大核心在運算時並沒有啟動執行。
CINEBENCH R20 @ Windows 11
CPU:10391 cb
CPU 單核心:763 cb
這項目順便測試一下溫度功耗,最低31度,最高95度,全機待機功耗77W,R20最高功耗396W。
CINEBENCH R20 @ Windows 10
CPU:10384 cb
CPU 單核心:762 cb
最低31度,最高96度,全機待機功耗77W,R20最高功耗390W。
R20 在 Windows 10 正常,沒有如 R15 發生大核心罷工的問題。
V-Ray @ Windows 11:18440
V-Ray @ Windows 10:18575
V-Ray GPU CUDA @ Windows 11:1403
V-Ray GPU CUDA @ Windows 10:1179
V-Ray GPU RTX @ Windows 11:1796
V-Ray GPU RTX @ Windows 10:1799
3DMark Fire Strike Extreme @ Windows 11:16820
Graphics score:17082
Physics score:41086
3DMark Fire Strike Extreme @ Windows 10:16859
Graphics score:17112
Physics score:41714
3DMark Fire Strike Ultra @ Windows 11:8900
Graphics score:8662
Physics score:38331
3DMark Fire Strike Ultra @ Windows 10:8878
Graphics score:8631
Physics score:42268
3DMark Time Spy @ Windows 11:14317
Graphics score:13736
CPU score:18832
3DMark Time Spy @ Windows 10:14311
Graphics score:13684
CPU score:19330
3DMark Time Spy Extreme @ Windows 11:7053
Graphics score:6768
CPU score:9268
3DMark Time Spy Extreme @ Windows 10:7020
Graphics score:6732
CPU score:9270
3DMark CPU Profile @ Windows 11
1 thread:1098
2 threads:2138
4 threads:4181
8 threads:7915
16 threads:10448
Max threads:11980
3DMark CPU Profile @ Windows 10
1 thread:1090
2 threads:2139
4 threads:4168
8 threads:7950
16 threads:10400
Max threads:11977
CPU Upgrade 超頻
接著是 Z690 AORUS MASTER 在 BIOS 內 CPU Upgrade 調用 Max Performance Profile 超頻。括弧後面為預設值的成績,最後會有比較表。
CPU-Z
CPU Single:815.9(815.0)
CPU Multi:11758.3(11365.3)+3.5%
SupertPI 1M & CPUmark99
SuperPI 1M:7.194s(7.056s)
CPUmark99:807(810)
SuperPI 8M:1m16.645s(1m13.747s)
Memory Benchmark
Read:80732 MB/s(81458 MB/s)
Write:73791 MB/s(74181 MB/s)
Copy:73307 MB/s(73679 MB/s)
Latency:81.6 ns(79.4 ns)
7-Zip 19.00
壓縮:113795 MIPS(111152 MIPS)+2.4%
解壓縮:144729 MIPS(139322 MIPS)+3.9%
整體評等:129262 MIPS(125237 MIPS)+3.2%
x264 FHD Benchmark:110.5(104.9)+5.3%
POV-Ray:28.25s(29.03s)+2.7%
CINEBENCH R15
OpenGL:346.84 fps(340.66 fps)
CPU:4221 cb(4077 cb)+3.5%
CPU 單核心:281 cb(287 cb)
CINEBENCH R20
CPU:10673 cb(10391 cb)+2.7%
CPU 單核心:749 cb(763 cb)
這項目順便測試一下溫度功耗,最低31度(31度),最高100度(95度),全機待機功耗77W(77W),R20最高功耗429W(396W)。
可以看到調用 Max Performance Profile 全核心負載最高大概在4.9~5.0GHz之間。這部分應該會視散熱器以及溫度而定。
V-Ray:18947(18440)+2.7%
V-Ray GPU CUDA:1409(1403)
V-Ray GPU RTX:1801(1796)
3DMark Fire Strike Extreme:16883(16820)
Graphics score:17127(17082)
Physics score:42549(41086)+3.6%
3DMark Fire Strike Ultra:8903(8900)
Graphics score:8667(8662)
Physics score:39388(38331)+2.8%
3DMark Time Spy:14392(14317)
Graphics score:13793(13736)
Physics score:19098(18832)+1.4%
3DMark Time Spy Extreme:7074(7053)
Graphics score:6767(6768)
Physics score:9528(9268)+2.8%
3DMark CPU Profile
1 thread:1077(1098)
2 threads:2132(2138)
4 threads:4234(4181)+1.3%
8 threads:8047(7915)+1.7%
16 threads:10758(10448)+3%
Max threads:12189(11980)+1.7%
比較表
小結
Intel 第12代搭配 Windows 11 目前來看是比較能正常發揮大小核心的調度,在測試裡面 POV-Ray 以及 CINEBENCH R15 在核心調度是比較有問題,有時候只有小核心在工作,大核心幾乎是停擺,當然這效能差異就明顯差很大,其餘大部分測試時並沒有發現這問題,正常下效能 Windows 11 與 10 的差異大概也只在誤差值裡面,或許有差但真的沒有到很大,據稱 Windows 10 大小核心調度問題可能之後也會有補丁解決,不過既然你都用了 Windows 10 而不是糾結在 Windows 7,那何不就升級 Windows 11 就好了。
GIGABYTE Z690 AORUS MASTER 搭配 Core i9-12900K 在預設下就發揮不錯的效能,這一代 Core i9 不管在單核心或多核心效率上都相當有感提升,多核心甚至可以接近 AMD Ryzen 9 5950X,以8大核心加上8小核心共24執行緒打16核32執行緒算是很猛,不過也因為在效能上算是榨得兇,對於溫度與功耗來說仍是較高一些。
Z690 AORUS MASTER 可以透過 BIOS 內的 CPU Upgrade 調用 Max Performance Profile 懶人超頻,把 12900K 的多核心效能多壓出 2~3%,不過這部分並不是絕對,這得視使用的 CPU 散熱器,也就是 CPU 溫度決定,全載時如果觸及到溫度保護就會降頻,也就是如果有更好的散熱器,可能效能還會更高一些。
Z690 與 Z590 最大的不同就是支援 DDR5 以及還未有產品支援的 PCIe Gen5,當然隔代給更多的介面通道這些都是必須的,這一代平台並無法向下相容,但也帶來了相當有感的升級以及效能,且處理器就售價上來看並不貴,如果覺得搭配 DDR5 價格太高倒是可以選擇 DDR4 的 Z690 主機板。