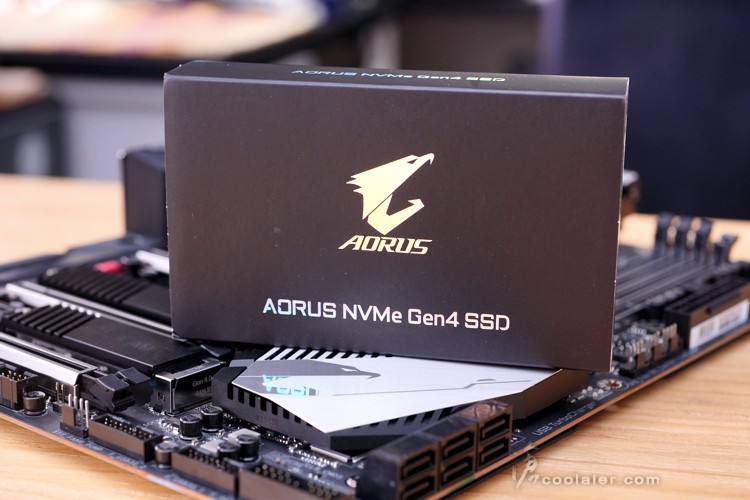
AMD Ryzen 3000 以及 X570 帶來了首款消費級市場的 PCIe 4.0 規格,雖然對手 Intel 酸說顯卡差異微乎其微,但是在 NVMe SSD 應用上就不是這麼回事。在今年稍早的 Computex 上,GIGABYTE 展示了 PCIe 4.0 的 NVMe SSD 應用產品 AORUS NVMe Gen4 SSD,並且有實機效能數據,比起 PCIe 3.0 的 NVMe SSD 有更驚人的效能表現。
AORUS NVMe Gen4 SSD 採用 Phison 群聯 28nm 的 PS5016-E16 主控晶片,搭配 Toshiba 96層堆疊 BiCS4 3D TLC,目前官網有看到500GB、1TB 和 2TB 三種容量,效能的部分,500GB 讀取最高為5000MB/s,寫入2500MB/s,4K隨機讀取為400,000 IOPS,寫入550,000 IOPS;1TB、2TB效能數據相同,連續讀取最高可達到 5000 MB/s,寫入 4400 MB/s,4K隨機讀取最大為 750,000 IOPS,寫入 700,000 IOPS。耐久度方面500GB的寫入量為850TBW;1TB的寫入量是1800TBW;2TB是3600TBW,保固皆為五年。
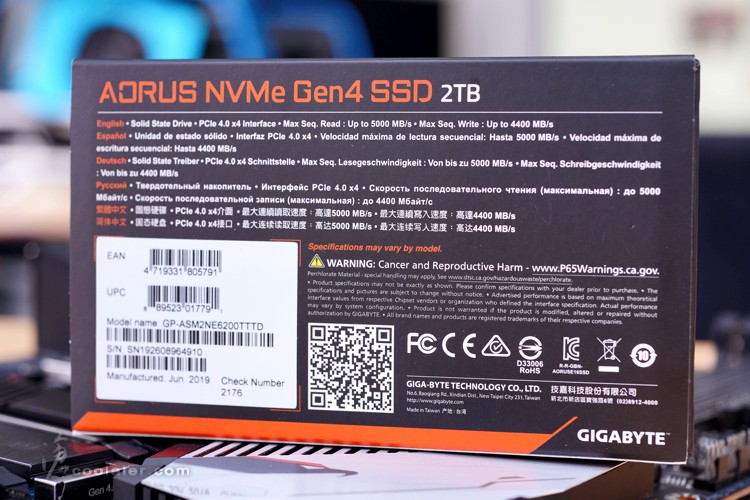
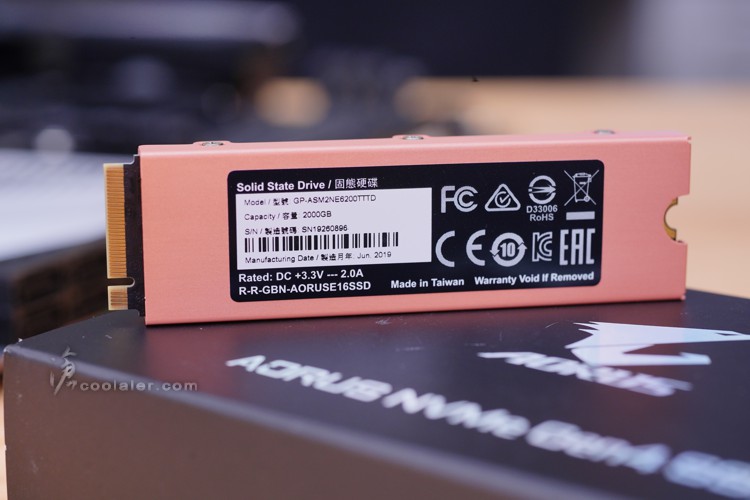
入手測試的這款為2TB容量。
外盒背面有效能數據,讀寫速度分別高達驚人的5000MB/s以及4400MB/s。
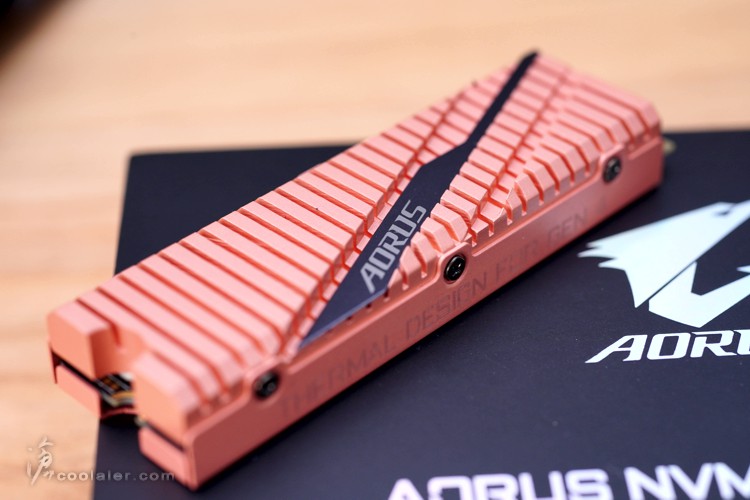
AORUS NVMe Gen4 SSD 的外觀採用全銅材質的散熱片包覆,畢竟這速度是需要良好的散熱來避免可能因為溫度過高保護而掉速。
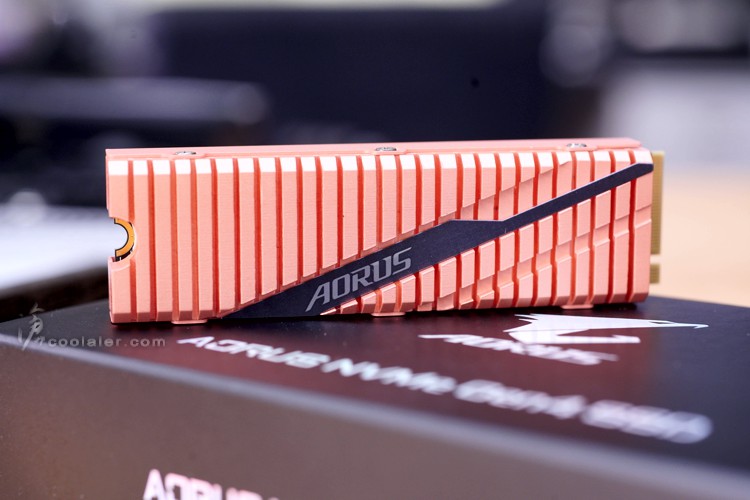
散熱片側面可以看到有一些溝槽設計,來加大整個散熱面積。
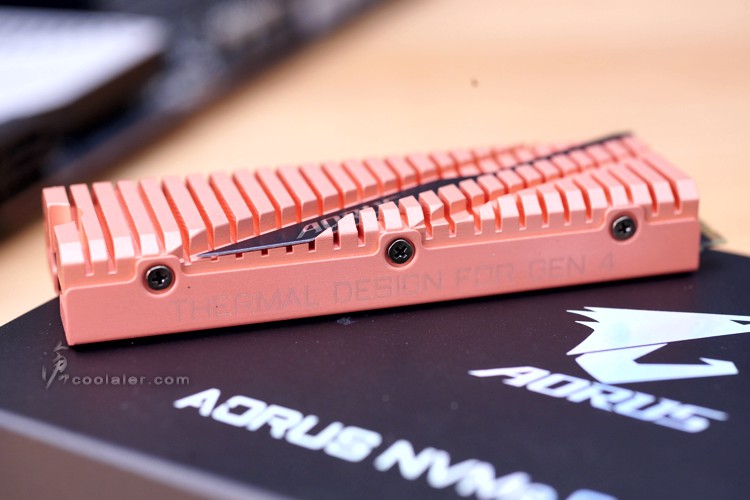
中間則有 AORUS 字樣,金銅色看起來質感不錯,且拿起來也挺有份量。
背面也是銅材質。
側邊螺絲轉下即可拆下散熱片,並沒有卡點或是甚麼,純粹就是靠正反面導熱膠貼合。
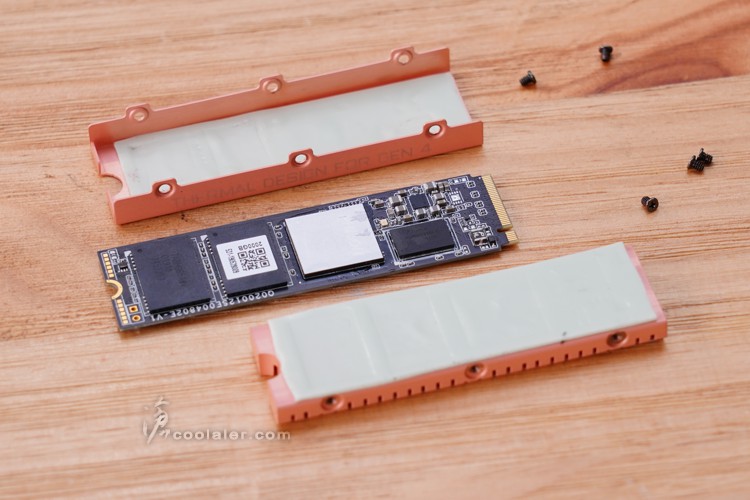
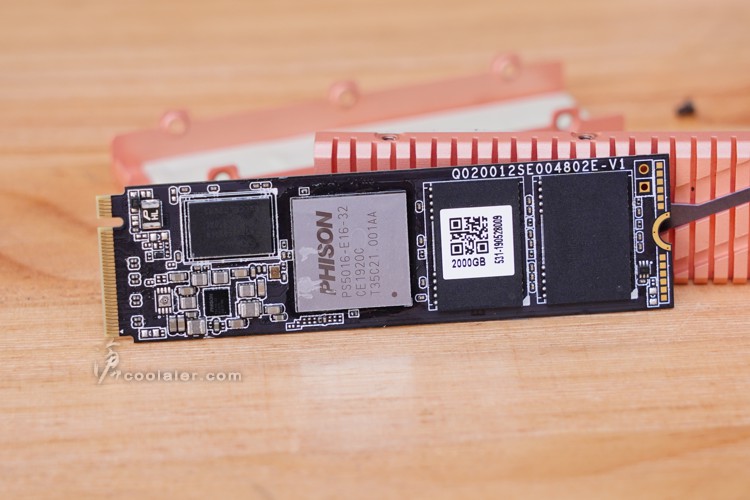
正面可以看到 PHISON PS5016-E16 主控晶片。左側上方是 SK Hynix 的快取記憶體,右邊則是兩顆 Toshiba 96層 BiCS4 3D NAND TLC 顆粒。
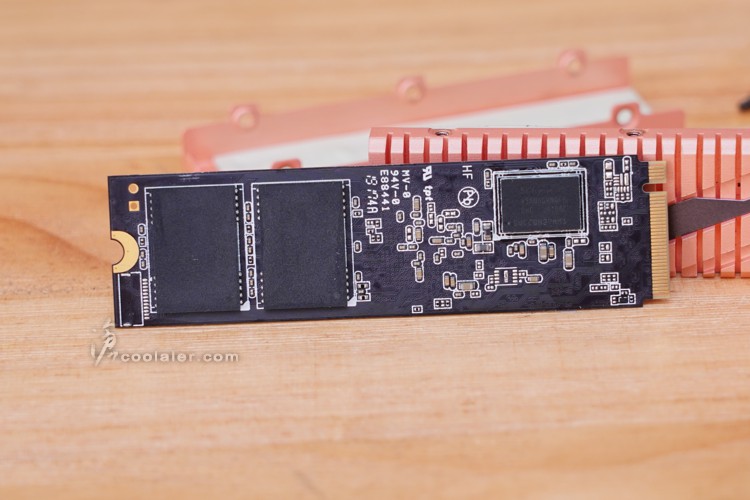
背面也有2顆 Toshiba 3D NAND TLC 以及1顆 SK Hynix 快取記憶體。
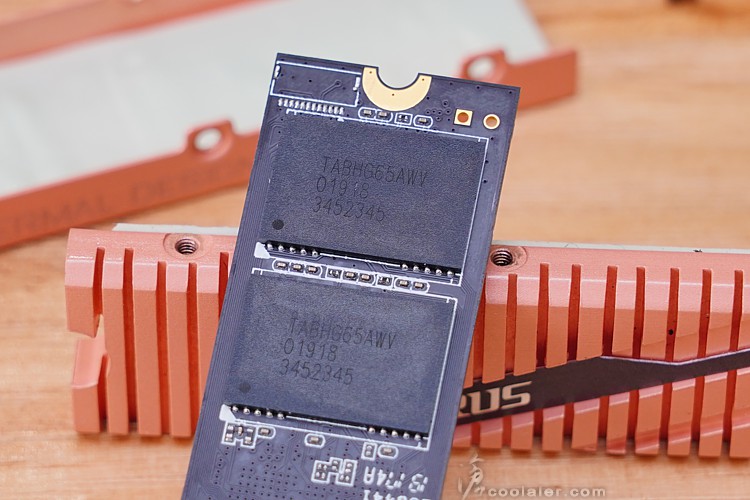
Toshiba 96層 BiCS4 3D NAND TLC,顆粒型號 TABHG65AWV,單顆512GB,共4顆組成2TB。
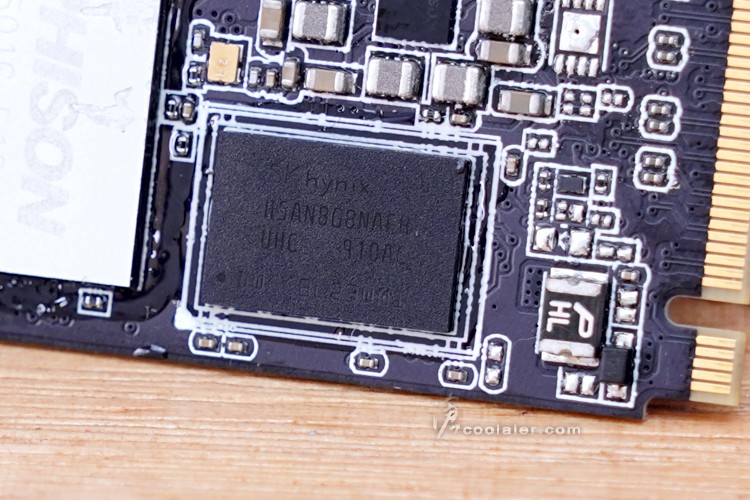
SK Hynix 的快取記憶體,顆粒型號 H5AN8G8NAFR-UHC,DDR4 2400,容量1GB,2顆共2GB。
測試平台
CPU: AMD Ryzen 7 3700X
CPU Cooler: EK Predator 240
RAM: GSKILL DDR4 3200 8GBx2
MB: GIGABYTE X570 AORUS Master
VGA: MSI RTX 2070 GAMING Z
HDD: GIGABYTE AORUS NVMe Gen4 SSD 2TB 、Maxiotek 512GB(OS)
PSU: IN WIN SI 1065W
OS: Windows 10 64bit
測試時加入 PCIe 3.0 跑的數據,來看看 PCIe 4.0 與 PCIe 3.0 的效能差異。
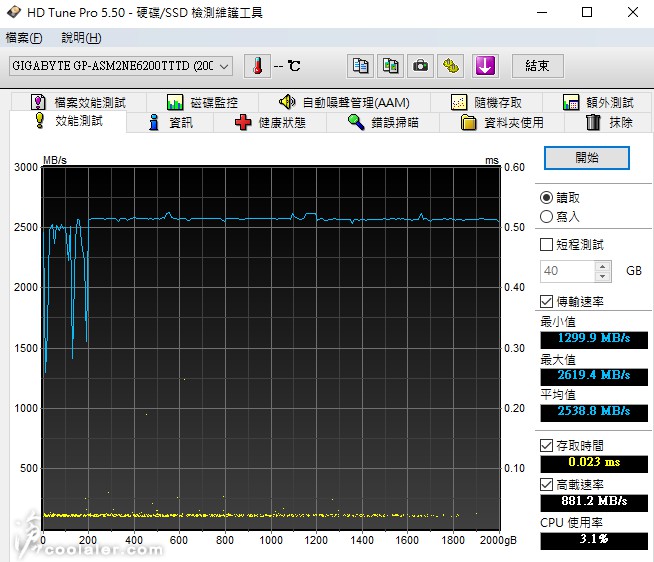
HD Tune Pro
PCIe 4.0
平均讀取:2538.8 MB/s
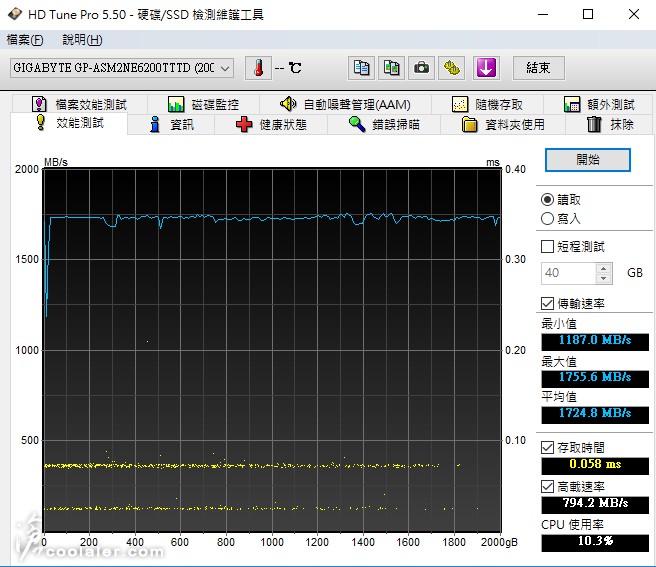
PCIe 3.0
平均讀取:1724.8 MB/s
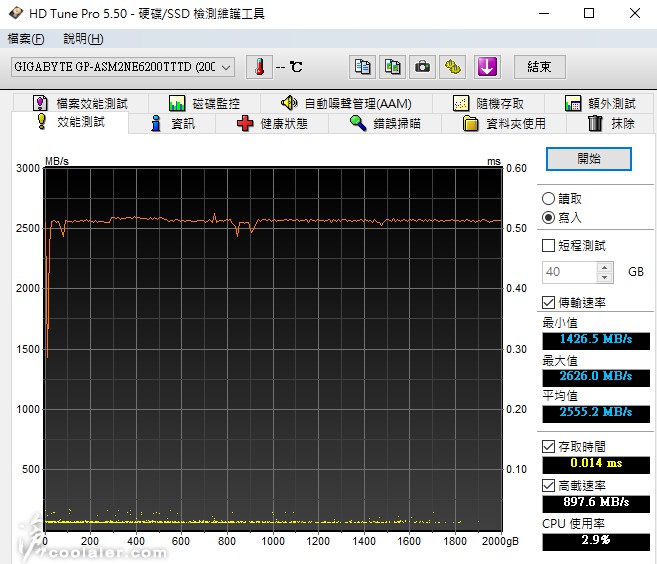
PCIe 4.0
平均寫入:2555.2 MB/s
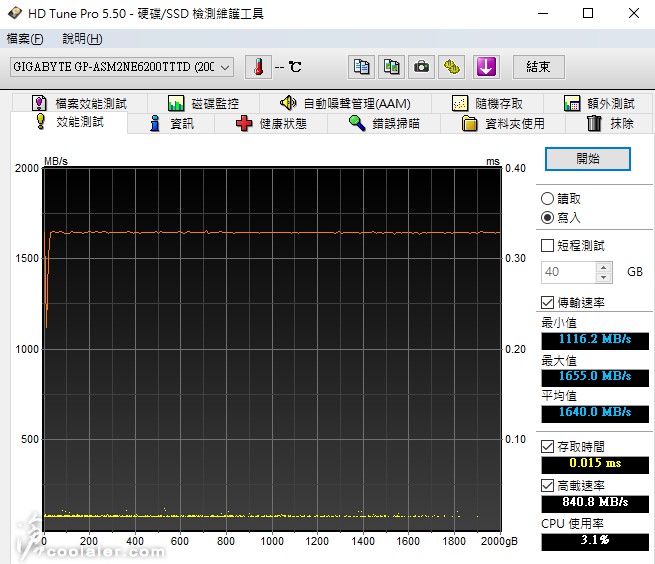
PCIe 3.0
平均寫入:1640.0 MB/s
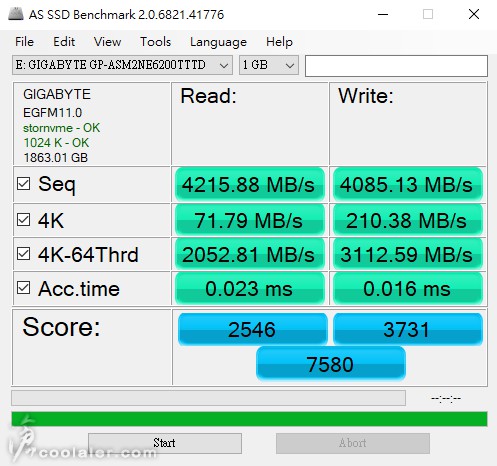
AS SSD Benchmark
PCIe 4.0
讀取:4215.88 MB/s
寫入:4085.13 MB/s
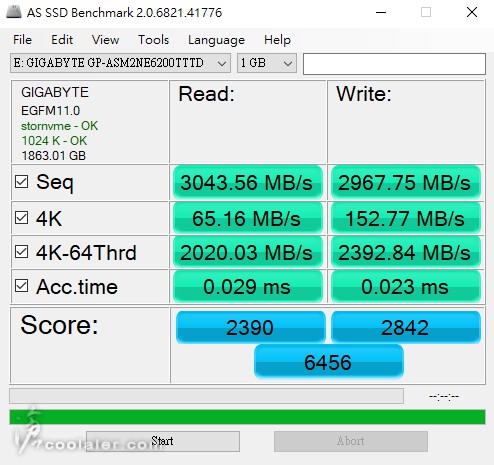
PCIe 3.0
讀取:3043.56 MB/s
寫入:2967.75 MB/s
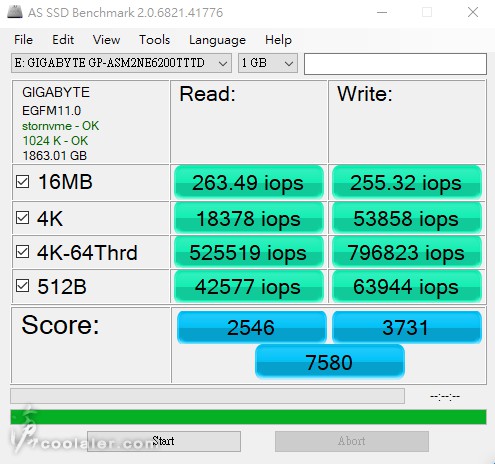
PCIe 4.0
IOPS顯示
4K-64Thrd 讀取:525519 IOPS
4K-64Thrd 寫入:796823 IOPS
PCIe 3.0
IOPS顯示
4K-64Thrd 讀取:517128 IOPS
4K-64Thrd 寫入:612567 IOPS

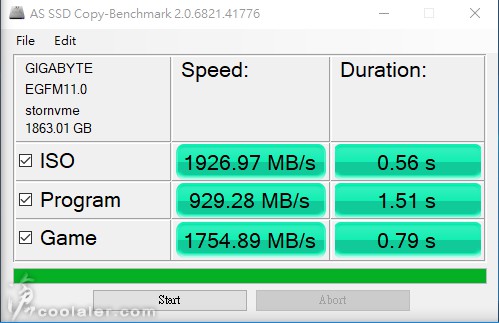
PCIe 4.0
Copy-Benchmark
PCIe 3.0
Copy-Benchmark

PCIe 4.0
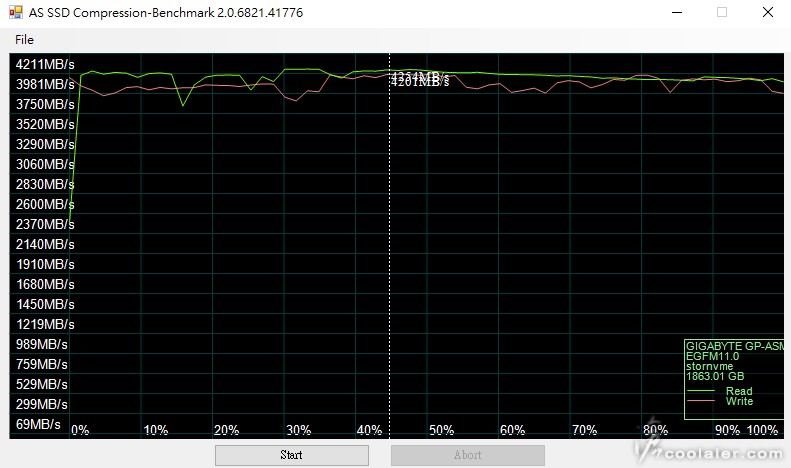
Compression-Benchmark
讀取最高約 4254 MB/s,寫入約 4201 MB/s
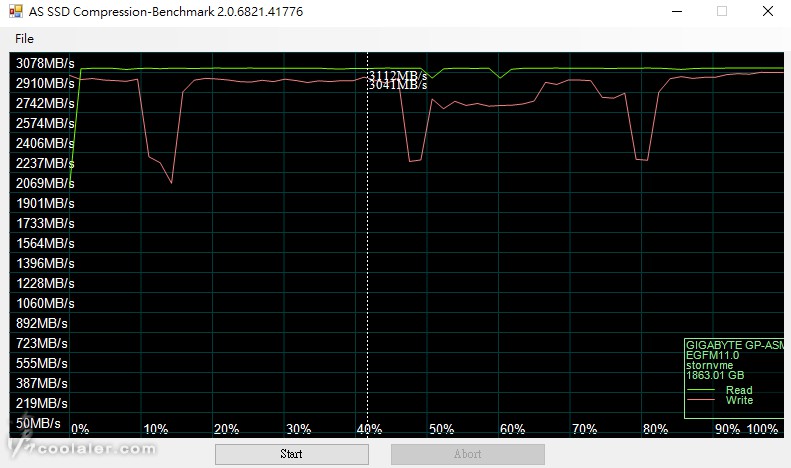
PCIe 3.0
Compression-Benchmark
讀取最高約 3112 MB/s,寫入約 3041 MB/s
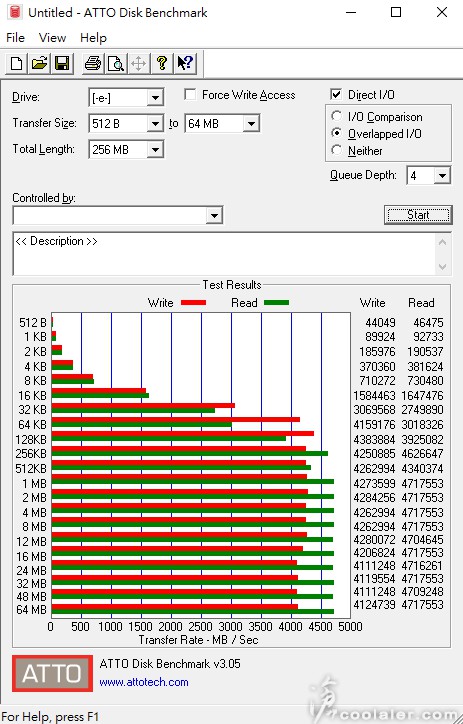
ATTO Disk Benchmark
PCIe 4.0
讀取最大 4607 MB/s,寫入最大 4281 MB/s。
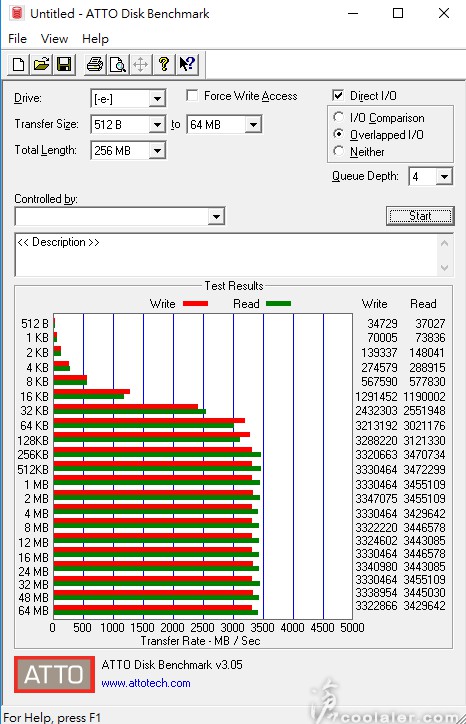
PCIe 3.0
讀取最大 3391 MB/s,寫入最大 3267 MB/s。
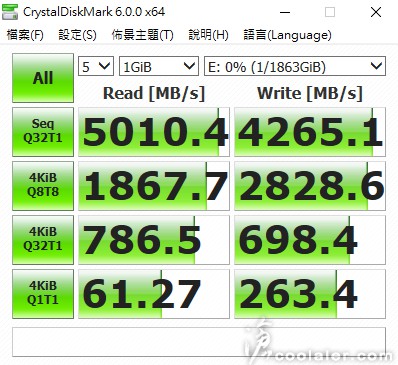
CrystalDiskMark x64
PCIe 4.0
隨機讀寫測試,Seq讀取最大 5010.4 MB/s,寫入最大 4265.1 MB/s。
4K Q8T8換算成IOPS讀取為 478,131 IOPS,寫入 724,122 IOPS。
4K Q32T1換算成IOPS讀取為 201,344 IOPS,寫入 178,790 IOPS。
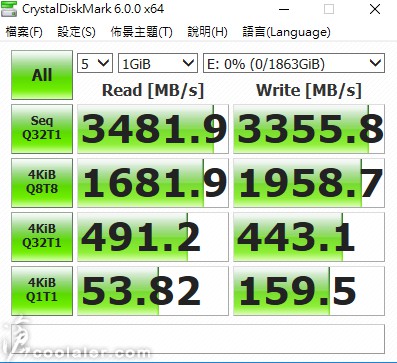
PCIe 3.0
隨機讀寫測試,Seq讀取最大 3481.9 MB/s,寫入最大 3355.8 MB/s。
4K Q8T8換算成IOPS讀取為 430,566 IOPS,寫入 501,427 IOPS。
4K Q32T1換算成IOPS讀取為 125,747 IOPS,寫入 113,434 IOPS。
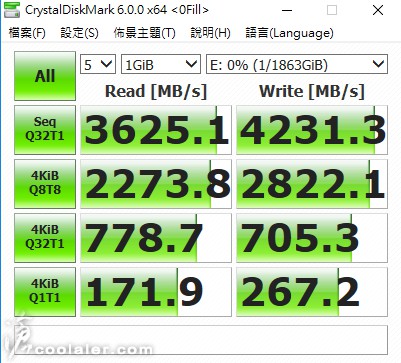
PCIe 4.0
0Fill 測試,Seq讀取最大 3625.1 MB/s,寫入最大 4231.3 MB/s。
4K Q8T8換算成IOPS讀取為 582,093 IOPS,寫入 722,458 IOPS。
4K Q32T1換算成IOPS讀取為 199,347 IOPS,寫入 180,557 IOPS。
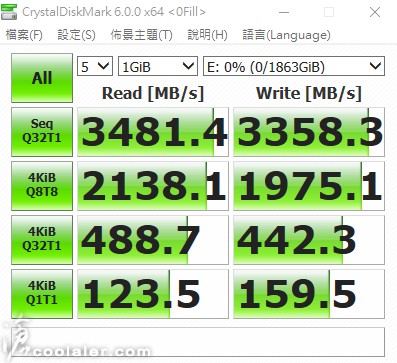
PCIe 3.0
0Fill 測試,Seq讀取最大 3481.4 MB/s,寫入最大 3358.3 MB/s。
4K Q8T8換算成IOPS讀取為 547,354 IOPS,寫入 505,626 IOPS。
4K Q32T1換算成IOPS讀取為 125,107 IOPS,寫入 113,229 IOPS。
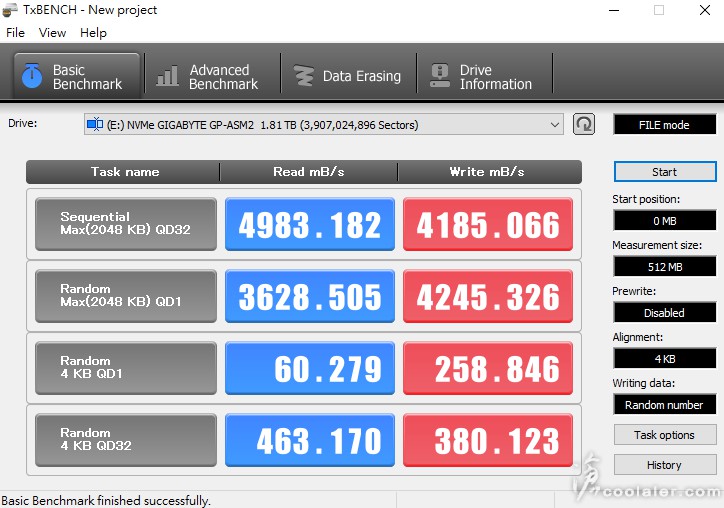
TxBENCH
PCIe 4.0
讀取最大 4983.182 MB/s,寫入 4185.066 MB/s。
PCIe 3.0
讀取最大 3426.573 MB/s,寫入 3320.484 MB/s。

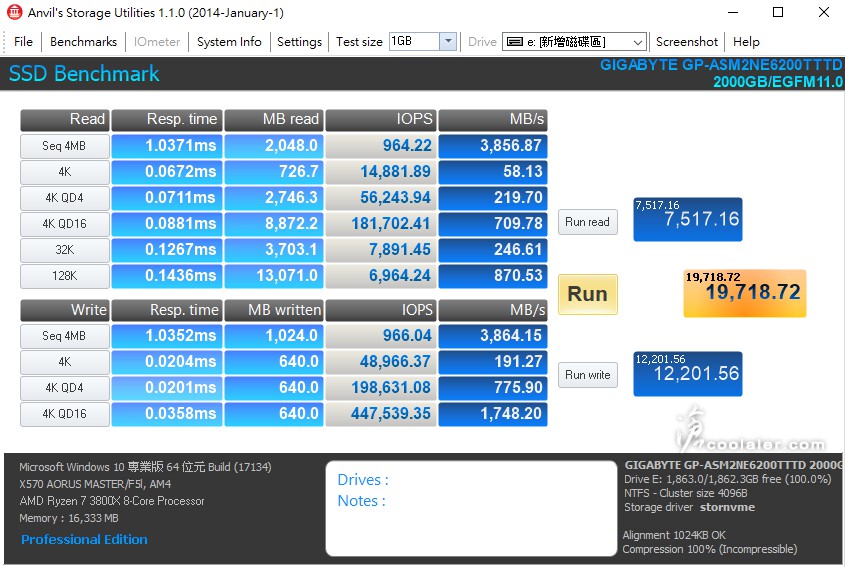
Anvil's Storage Utilities
PCIe 4.0
讀取最快為 3856.87 MB/s,寫入最快為 3864.15 MB/s。
4K QD16 讀取為 181,702 IOPS,寫入為 447,539 IOPS
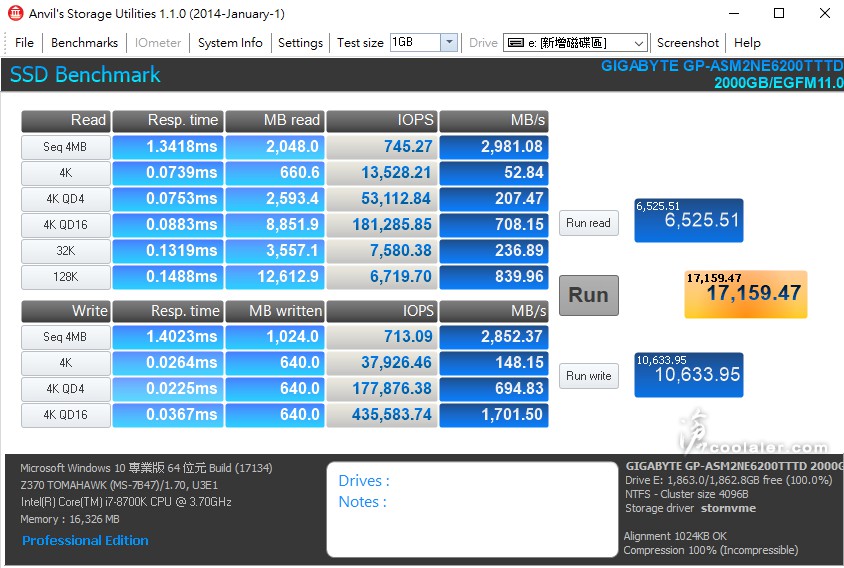
PCIe 3.0
讀取最快為 2981.08 MB/s,寫入最快為 2852.37 MB/s。
4K QD16 讀取為 181,285 IOPS,寫入為 435,583 IOPS
小結
AORUS NVMe Gen4 SSD 2TB 不僅容量大,速度也是相當快,上面所測得讀取最高 5010MB/s,寫入 4281 MB/s,4K隨機讀取最高 580,000 IOPS,寫入 790,000 IOPS,4K 讀取的部分並沒有達到官網數據 750,000 IOPS,不過這樣的效能已經是相當驚人,畢竟測試軟體、環境、平台不一樣,跑出來的分數可能也會有差異,另外可以看到 PCIe 4.0 與 3.0 的差異,換到 PCIe 3.0 上面,讀取最高是3481MB/s,寫入3358MB/s,有不小的落差,所以如果要極緻 NVMe Gen4 的效能還是要搭配 PCIe 4.0 平台,誰說這通道只能跑顯卡呢XD。
AORUS NVMe Gen4 SSD 採用 Phison 群聯 28nm 的 PS5016-E16 主控晶片,搭配 Toshiba 96層堆疊 BiCS4 3D TLC,目前官網有看到500GB、1TB 和 2TB 三種容量,效能的部分,500GB 讀取最高為5000MB/s,寫入2500MB/s,4K隨機讀取為400,000 IOPS,寫入550,000 IOPS;1TB、2TB效能數據相同,連續讀取最高可達到 5000 MB/s,寫入 4400 MB/s,4K隨機讀取最大為 750,000 IOPS,寫入 700,000 IOPS。耐久度方面500GB的寫入量為850TBW;1TB的寫入量是1800TBW;2TB是3600TBW,保固皆為五年。
入手測試的這款為2TB容量。
外盒背面有效能數據,讀寫速度分別高達驚人的5000MB/s以及4400MB/s。
AORUS NVMe Gen4 SSD 的外觀採用全銅材質的散熱片包覆,畢竟這速度是需要良好的散熱來避免可能因為溫度過高保護而掉速。
散熱片側面可以看到有一些溝槽設計,來加大整個散熱面積。
中間則有 AORUS 字樣,金銅色看起來質感不錯,且拿起來也挺有份量。
背面也是銅材質。
側邊螺絲轉下即可拆下散熱片,並沒有卡點或是甚麼,純粹就是靠正反面導熱膠貼合。
正面可以看到 PHISON PS5016-E16 主控晶片。左側上方是 SK Hynix 的快取記憶體,右邊則是兩顆 Toshiba 96層 BiCS4 3D NAND TLC 顆粒。
背面也有2顆 Toshiba 3D NAND TLC 以及1顆 SK Hynix 快取記憶體。
Toshiba 96層 BiCS4 3D NAND TLC,顆粒型號 TABHG65AWV,單顆512GB,共4顆組成2TB。
SK Hynix 的快取記憶體,顆粒型號 H5AN8G8NAFR-UHC,DDR4 2400,容量1GB,2顆共2GB。
測試平台
CPU: AMD Ryzen 7 3700X
CPU Cooler: EK Predator 240
RAM: GSKILL DDR4 3200 8GBx2
MB: GIGABYTE X570 AORUS Master
VGA: MSI RTX 2070 GAMING Z
HDD: GIGABYTE AORUS NVMe Gen4 SSD 2TB 、Maxiotek 512GB(OS)
PSU: IN WIN SI 1065W
OS: Windows 10 64bit
測試時加入 PCIe 3.0 跑的數據,來看看 PCIe 4.0 與 PCIe 3.0 的效能差異。
HD Tune Pro
PCIe 4.0
平均讀取:2538.8 MB/s
PCIe 3.0
平均讀取:1724.8 MB/s
PCIe 4.0
平均寫入:2555.2 MB/s
PCIe 3.0
平均寫入:1640.0 MB/s
AS SSD Benchmark
PCIe 4.0
讀取:4215.88 MB/s
寫入:4085.13 MB/s
PCIe 3.0
讀取:3043.56 MB/s
寫入:2967.75 MB/s
PCIe 4.0
IOPS顯示
4K-64Thrd 讀取:525519 IOPS
4K-64Thrd 寫入:796823 IOPS
PCIe 3.0
IOPS顯示
4K-64Thrd 讀取:517128 IOPS
4K-64Thrd 寫入:612567 IOPS
PCIe 4.0
Copy-Benchmark
PCIe 3.0
Copy-Benchmark
PCIe 4.0
Compression-Benchmark
讀取最高約 4254 MB/s,寫入約 4201 MB/s
PCIe 3.0
Compression-Benchmark
讀取最高約 3112 MB/s,寫入約 3041 MB/s
ATTO Disk Benchmark
PCIe 4.0
讀取最大 4607 MB/s,寫入最大 4281 MB/s。
PCIe 3.0
讀取最大 3391 MB/s,寫入最大 3267 MB/s。
CrystalDiskMark x64
PCIe 4.0
隨機讀寫測試,Seq讀取最大 5010.4 MB/s,寫入最大 4265.1 MB/s。
4K Q8T8換算成IOPS讀取為 478,131 IOPS,寫入 724,122 IOPS。
4K Q32T1換算成IOPS讀取為 201,344 IOPS,寫入 178,790 IOPS。
PCIe 3.0
隨機讀寫測試,Seq讀取最大 3481.9 MB/s,寫入最大 3355.8 MB/s。
4K Q8T8換算成IOPS讀取為 430,566 IOPS,寫入 501,427 IOPS。
4K Q32T1換算成IOPS讀取為 125,747 IOPS,寫入 113,434 IOPS。
PCIe 4.0
0Fill 測試,Seq讀取最大 3625.1 MB/s,寫入最大 4231.3 MB/s。
4K Q8T8換算成IOPS讀取為 582,093 IOPS,寫入 722,458 IOPS。
4K Q32T1換算成IOPS讀取為 199,347 IOPS,寫入 180,557 IOPS。
PCIe 3.0
0Fill 測試,Seq讀取最大 3481.4 MB/s,寫入最大 3358.3 MB/s。
4K Q8T8換算成IOPS讀取為 547,354 IOPS,寫入 505,626 IOPS。
4K Q32T1換算成IOPS讀取為 125,107 IOPS,寫入 113,229 IOPS。
TxBENCH
PCIe 4.0
讀取最大 4983.182 MB/s,寫入 4185.066 MB/s。
PCIe 3.0
讀取最大 3426.573 MB/s,寫入 3320.484 MB/s。
Anvil's Storage Utilities
PCIe 4.0
讀取最快為 3856.87 MB/s,寫入最快為 3864.15 MB/s。
4K QD16 讀取為 181,702 IOPS,寫入為 447,539 IOPS
PCIe 3.0
讀取最快為 2981.08 MB/s,寫入最快為 2852.37 MB/s。
4K QD16 讀取為 181,285 IOPS,寫入為 435,583 IOPS
小結
AORUS NVMe Gen4 SSD 2TB 不僅容量大,速度也是相當快,上面所測得讀取最高 5010MB/s,寫入 4281 MB/s,4K隨機讀取最高 580,000 IOPS,寫入 790,000 IOPS,4K 讀取的部分並沒有達到官網數據 750,000 IOPS,不過這樣的效能已經是相當驚人,畢竟測試軟體、環境、平台不一樣,跑出來的分數可能也會有差異,另外可以看到 PCIe 4.0 與 3.0 的差異,換到 PCIe 3.0 上面,讀取最高是3481MB/s,寫入3358MB/s,有不小的落差,所以如果要極緻 NVMe Gen4 的效能還是要搭配 PCIe 4.0 平台,誰說這通道只能跑顯卡呢XD。