
還記得這張地表最快電競處理器 Core i9-9900KS現身的圖嗎,在全新第 10代 Intel Core系列桌上型處理器上市的同時,地表最快電競處理器即將換人做
前言:
全新第 10 代 Intel® Core™系列桌上型處理器以及 GIGABYTE Z490 AORUS XTREME 已於今日效能解禁,有關 處理器開箱 與主機板介紹 已經在先前發表這裡就不再贅述
第 10 代 Intel Core 桌上型處理器 Intel Core i9-10900K 挾著史上首顆 5.3GHz (Thermal Velocity Boost) 及地表最快電競處理器的名號來勢洶洶,跟 Core i9-9900KS 相比 Core i9-10900K 雖然核心數比較多,但因為增加了 IHS 厚度並降低 CPU die 的關係其在超頻的表現仍然不讓 Core i9-9900KS專美於前,有關 Core i9-10900K 與 Core i9-9900KS 的效能比較將會在本文中陸續呈現還請持續關注
除了超頻是強項之外 Core i9-10900K 也比 Core i9-9900KS 更適合內容創作,但在遊戲方面 Core i9-10900K 是否能與 Core i9-9900KS 一爭長短則還有待看完測試才有定論
說到遊戲就來談談處理器核心數跟頻率與遊戲的關係,早在前幾年多核心處理器還未開始流行的時候,遊戲幀數的多寡除了與顯示卡規格高低有關之外再來就是處理器頻率了,當使用的處理器頻率愈高遊戲的效能就愈好,因此處理器的頻率總是那麼重要
科技日新月異,近年來桌上型處理器開始朝多核心發展,也促使遊戲開發商必須提高多核心的相容性以有利於遊戲效能的提升,這時玩家除了在選擇有 K 的處理器之餘,選擇適當核心數的處理器玩遊戲也是玩家捧油一併要考慮的
網路上有一篇視頻 「How Many Cores Really Need For Gaming?」剛好在探討應該使用多少核心數的處理器玩遊戲效能最好,最後遊戲幀數最高的前二名是由「10核心」與 「12核心」的處理器拿下
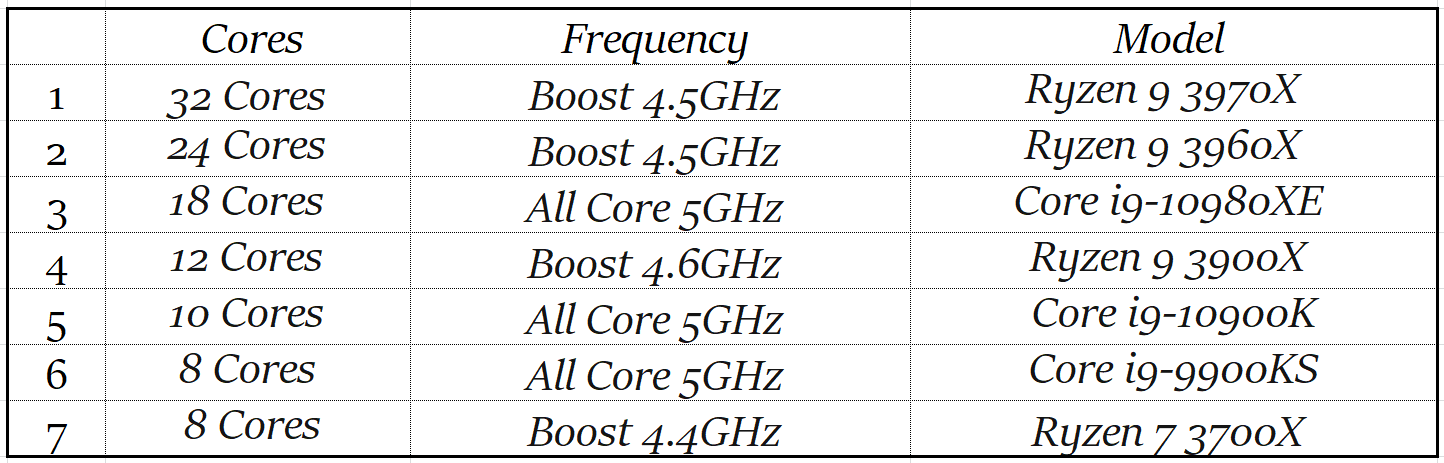
但這篇視頻是在只使用同一顆 12 核心處理器以關掉核心的方式做出的,是不是能反應出真實的情況還不好說,這樣的測試結果引起了滄者的好奇心,為了找出誰才是真正地表最強電競處理器,因此也就有了本文的在各個不同核心數的桌上型處理器的交叉評比 (詳參與遊戲評比的處理器規格及在遊戲中使用的頻率比較表) 而也同時能驗證在這些處理器當中誰才是當今地表最快的電競處理器
參與遊戲評比的處理器規格及在遊戲中使用的頻率比較表
因為有部分的處理器在之前所做的遊戲測試項目與現今的不同,因此只能從中挑選有共同項目的測試做評比還請包涵,而有關評比數據來源的測試圖請詳本連結
本波的測試文較多為了方便比較在每一篇文內都有與在其他篇測試文的比較表以提供玩家比較參考,本波各篇測試主題請詳以下連結
1.第 10代 Intel® Core™系列桌上型處理器解禁,看 Core i9-10900K如何在 6~32核心的 7種核心數 8種處理器間之遊戲評比中勝出及在 MAXIMUS XII EXTREME 5.4G DDR4 5000表現
2.地表最快電競處理器捨我其誰,看 Intel® Core™ i9-10900K 封王之路及在空冷 5.3GHz Cinebench 過測
3.DDR4 4800頻寬最出色,看專為遊戲打造的 Intel® Core™ i9-10900K VS i9-9900KS在 GIGABYTE Z490 AORUS XTREME
4.什麼核心數的處理器玩遊戲最快?看創作與電競兼俱之 Intel® Core™ i9-10900K 10核心在 ASUS ROG MAXIMUS XII HERO Wi-Fi測試
5.核心不夠多超頻就對了,看 Intel® Core™ i5-10600K挑戰 Core i9-10900K地表最快電競寶座及在 ASUS ROG STRIX Z490-E GAMING 5.4GHz超頻實測
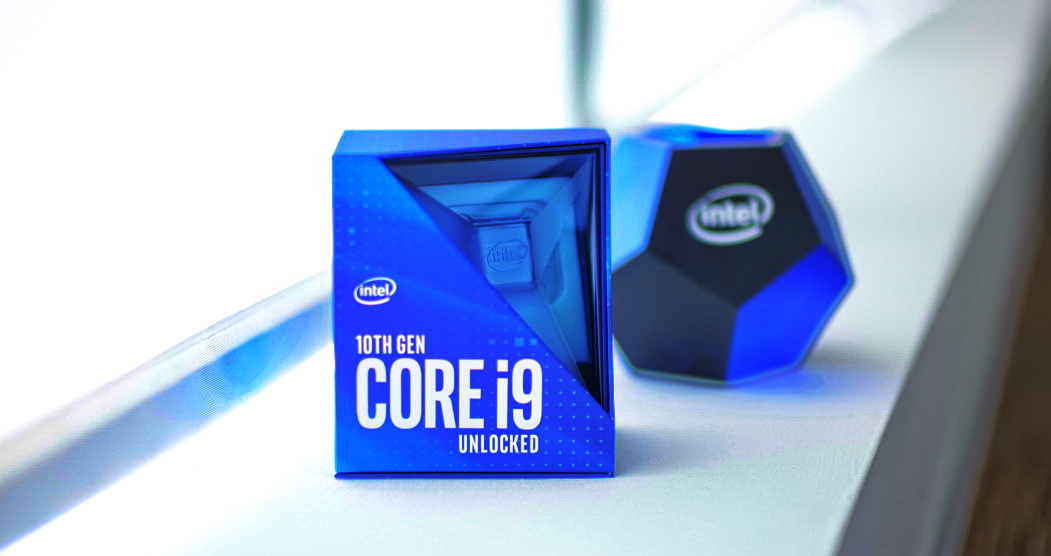
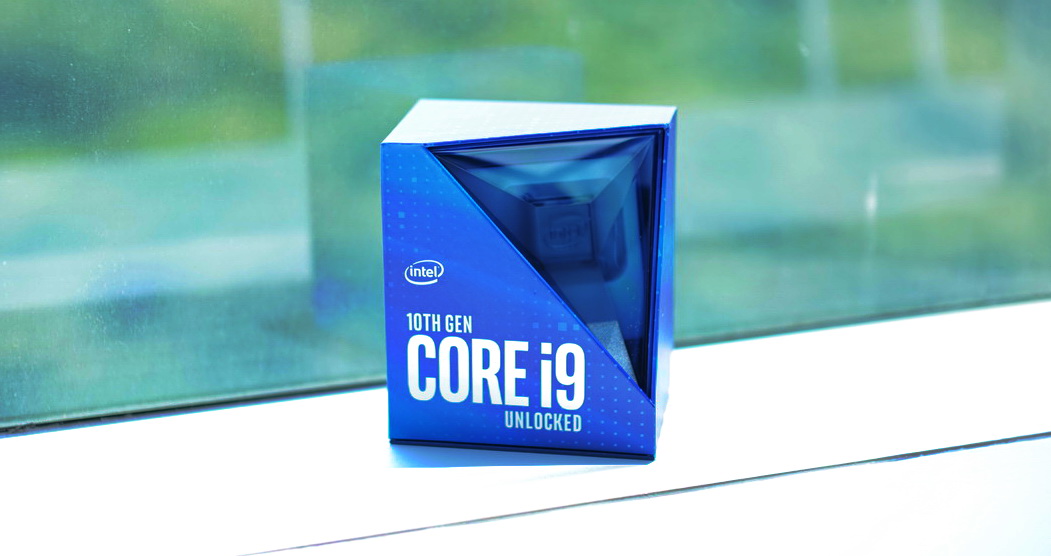
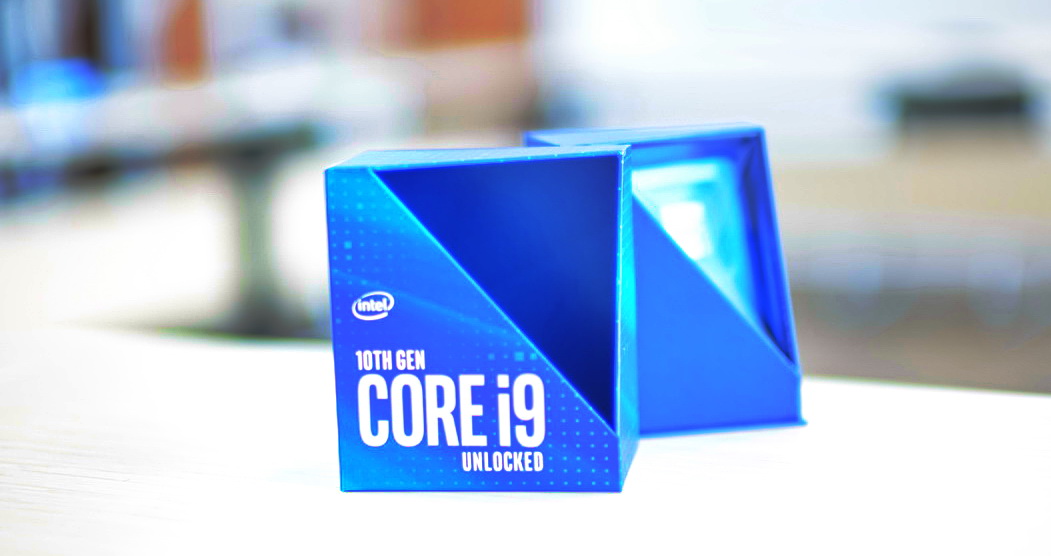
第 10代 Intel® Core™ i9桌上型電腦處理器零售版彩盒
要開彩盒的方法是往上拉
正式版 Intel Core i9-10900K本尊

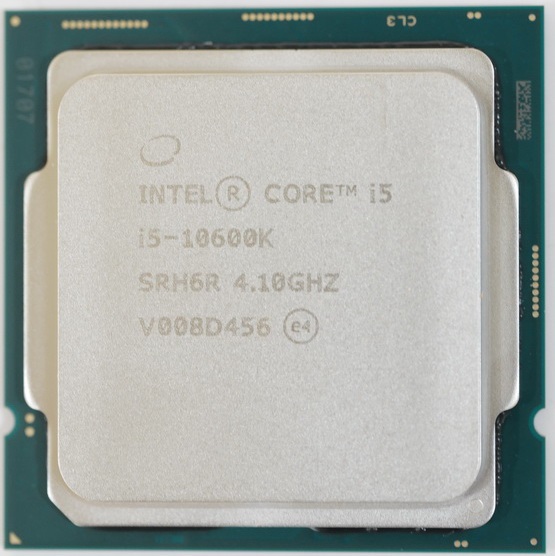
正式版 Intel Core i5-10600K本尊
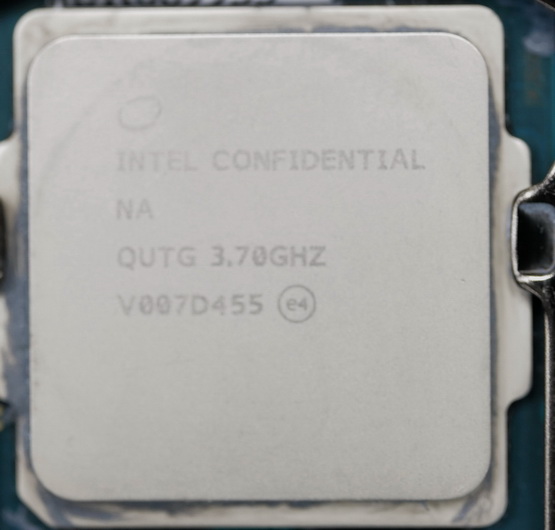
Intel Intel Core i9-10900KF QS
本波測試所使用之處理器規格

測試項目
A.default
在預設下對 Core i9-10900K做 idle、Single core loading、Full loading等測試,以了解 Core i9-10900K在各項測試中的頻率、電壓、溫度、功耗、效能表現
1.Cinebench R15 & R20 CPU Test
2.wPrime 2.10 1024M Benchmark
3.CPU-Z Bench
4.AIDA64 Cache & Memory Benchmark
5.POV-Ray Benchmark
6.Corona Benchmark
7.X264 FHD Benchmark
8.V-ray Benchmark
9.WinRAR Benchmark
10.CPU Package Power
B.All Core 5GHz
在 All Core 5GHz下對 Core i9-10900K做 idle、Single core loading、Full loading等測試,以了解 Core i9-10900K在各項測試中的頻率、電壓、溫度、功耗、效能表現
1.Cinebench R15 & R20 CPU Test
2.wPrime 2.10 1024M Benchmark
3.CPU-Z Bench
4.AIDA64 Cache & Memory Benchmark
5.POV-Ray Benchmark
6.Corona Benchmark
7.X264 FHD Benchmark
8.V-ray Benchmark
9.WinRAR Benchmark
10.CPU Package Power
C.PCMark 10
在預設下對 Core i9-10900K做 PCMark綜合測試以了解 Core i9-10900K在 Office方面的綜合表現
1.「Essentials」 包括 Web瀏覽,視頻會議和應用程序啟動時間
2.「Productivity」包括基於電子表格和寫作的測試
3.「Digital Content Creation」包括照片編輯,視頻編輯以及渲染和可視化測試
D.Gaming Benchmark
在 All Core 5GHz下看 Core i9-10900K在 6~32核心的 7種核數 8種處理器間之遊戲效能比較
10900K vs 10600K vs 10980XE vs 9900KS vs 3700X 1080P Gaming Compare (10980XE & 3700X測試連結)
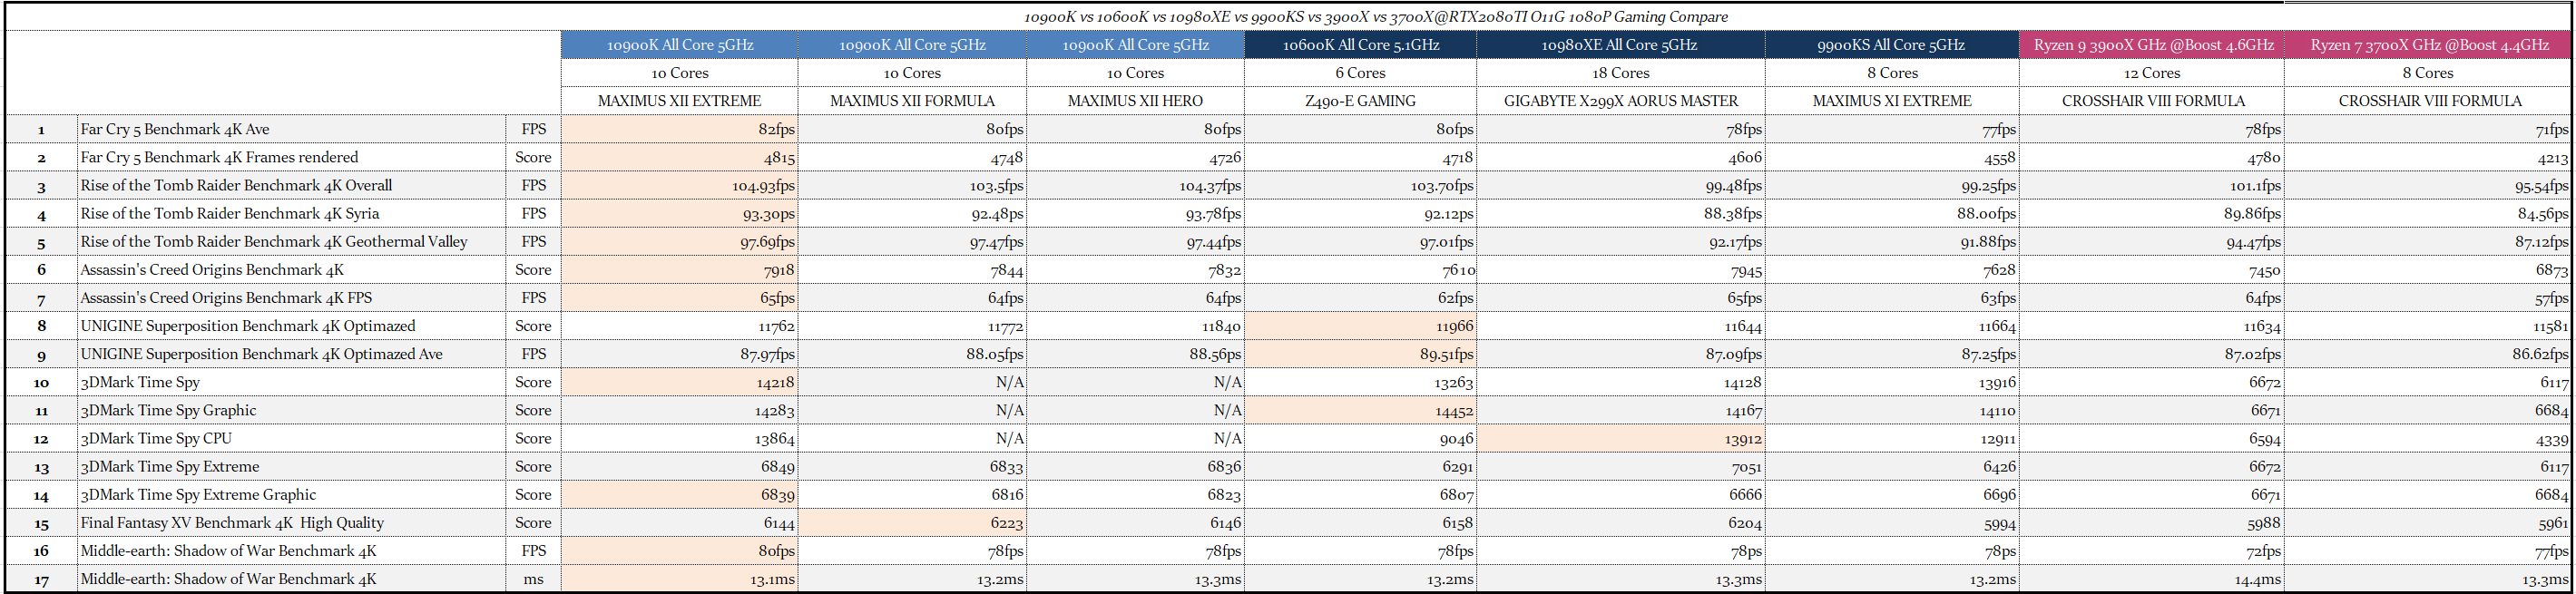
10900K vs 10600K vs 10980XE vs 9900KS vs 3900X vs 3700X@4K Gaming Compare (10980XE & 3900X & 3700X測試連結)
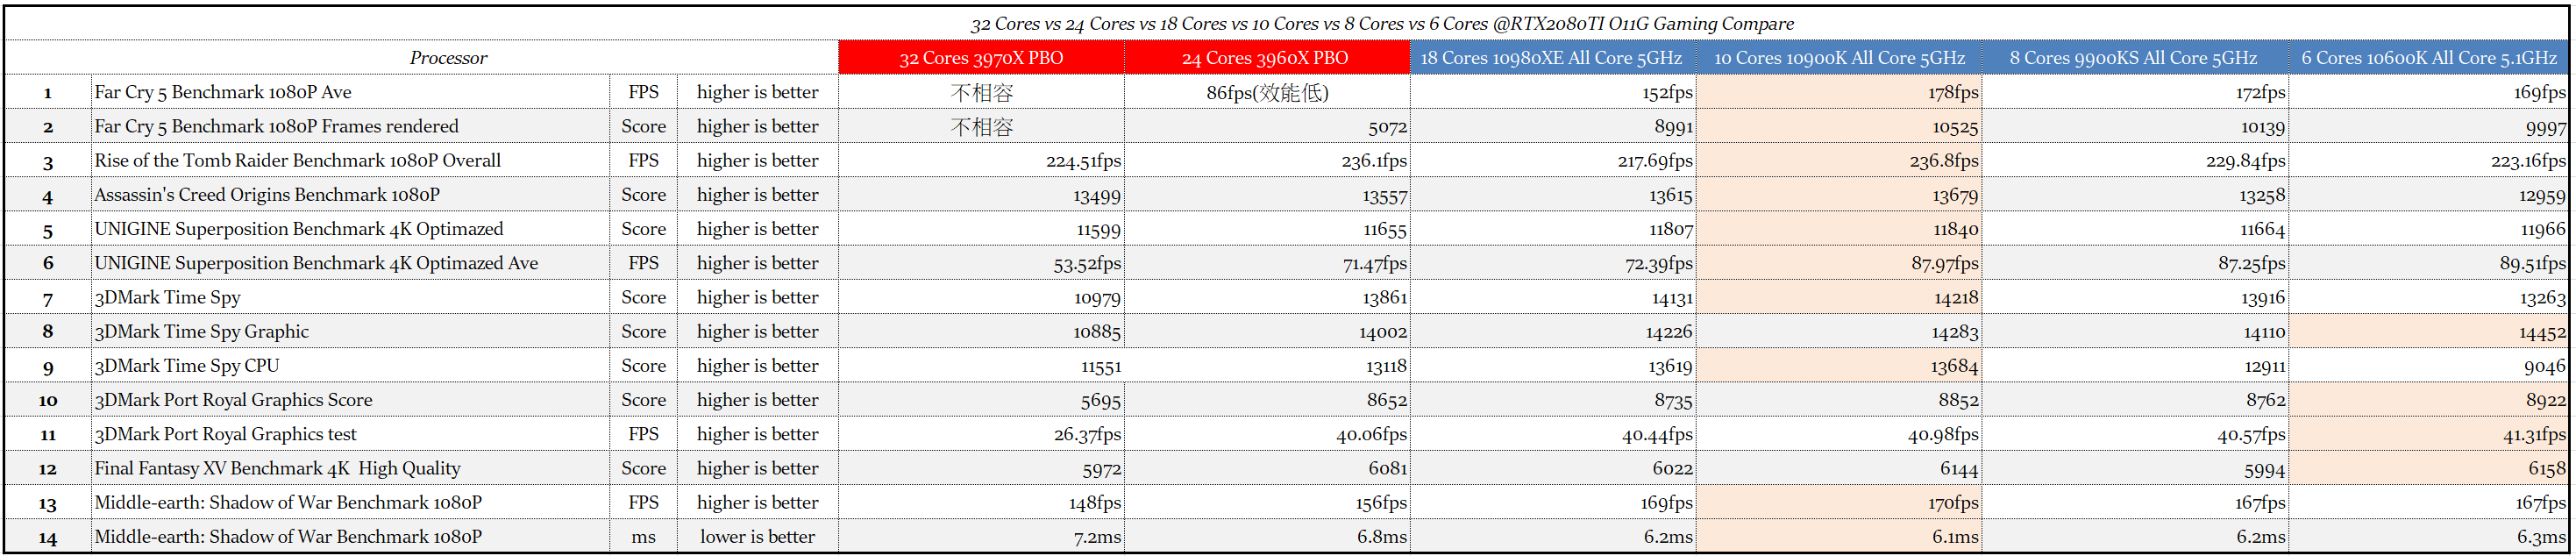
10900K vs 10600K vs 10980XE vs 9900KS vs 3970X vs 3960X vs 3900X vs 3700X@1080P Gaming Compare (3970X vs 3960X測試連結)
a.Far Cry 5 Benchmark《極地戰嚎5》
b.Rise of the Tomb Raider Benchmark《古墓奇兵:崛起》
c.Assassin's Creed Origins Benchmark《刺客教條:起源》
d.UNIGINE Superposition Benchmark
e.3DMark Time Spy
f.3DMark Time Spy Extreme
g.3DMark Port Royal
h.Final Fantasy XV Benchmark 《中土世界:戰爭之影》
i.Middle-earth: Shadow of War Benchmark
E.Overclocking Limit Air Cooled
a.DDR4 4800@10600KF default
b.DDR4 4800@10900K default
c.DDR4 5000@10900K 5.4GHz
d.10900K@All Core 5.2GHz Cinebench R20 CPU Test
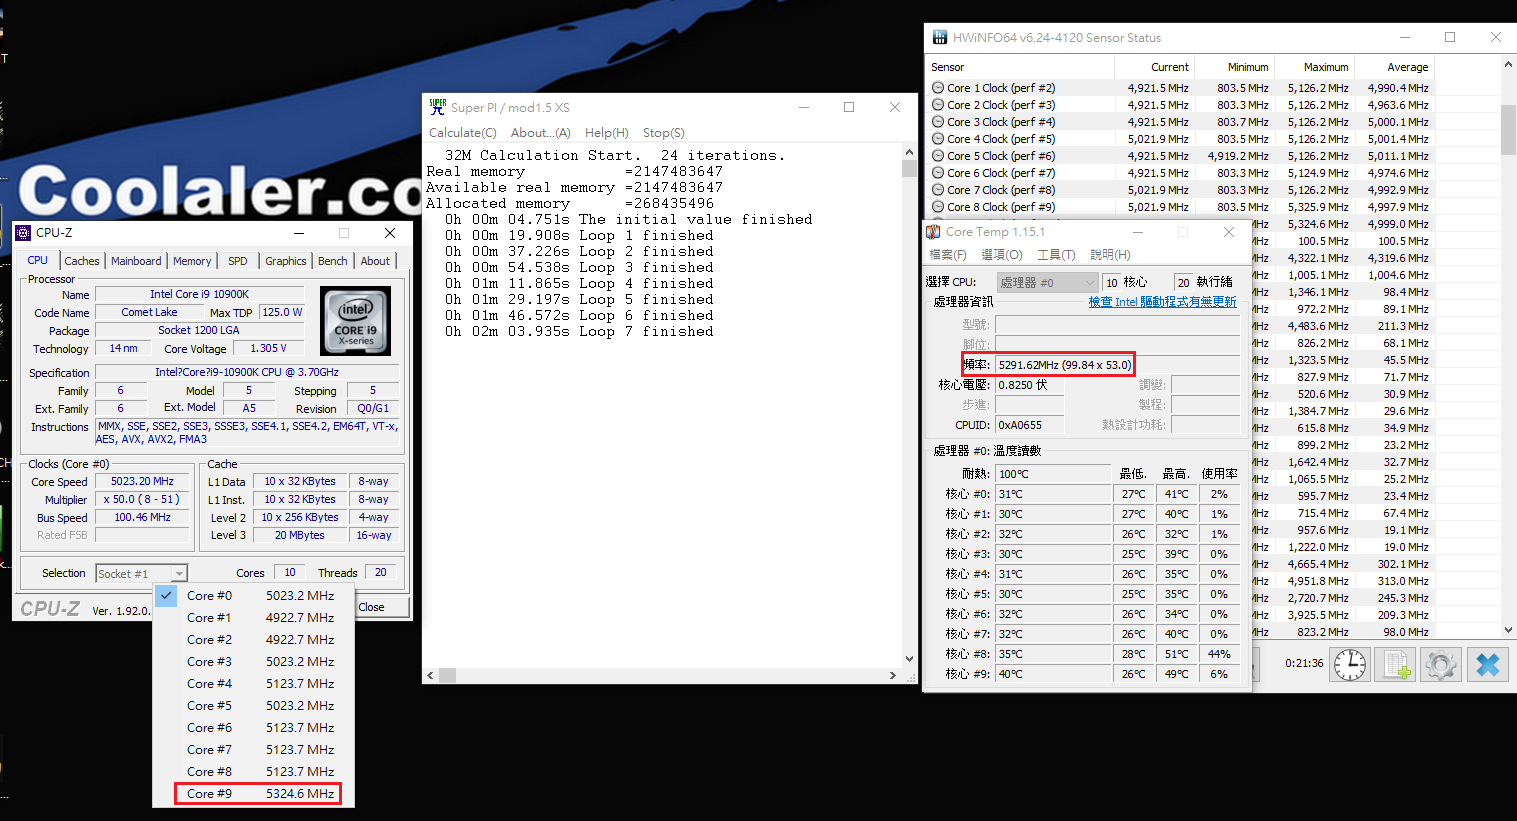
e.10900K@All Core 5.3GHz Cinebench R15 CPU Test
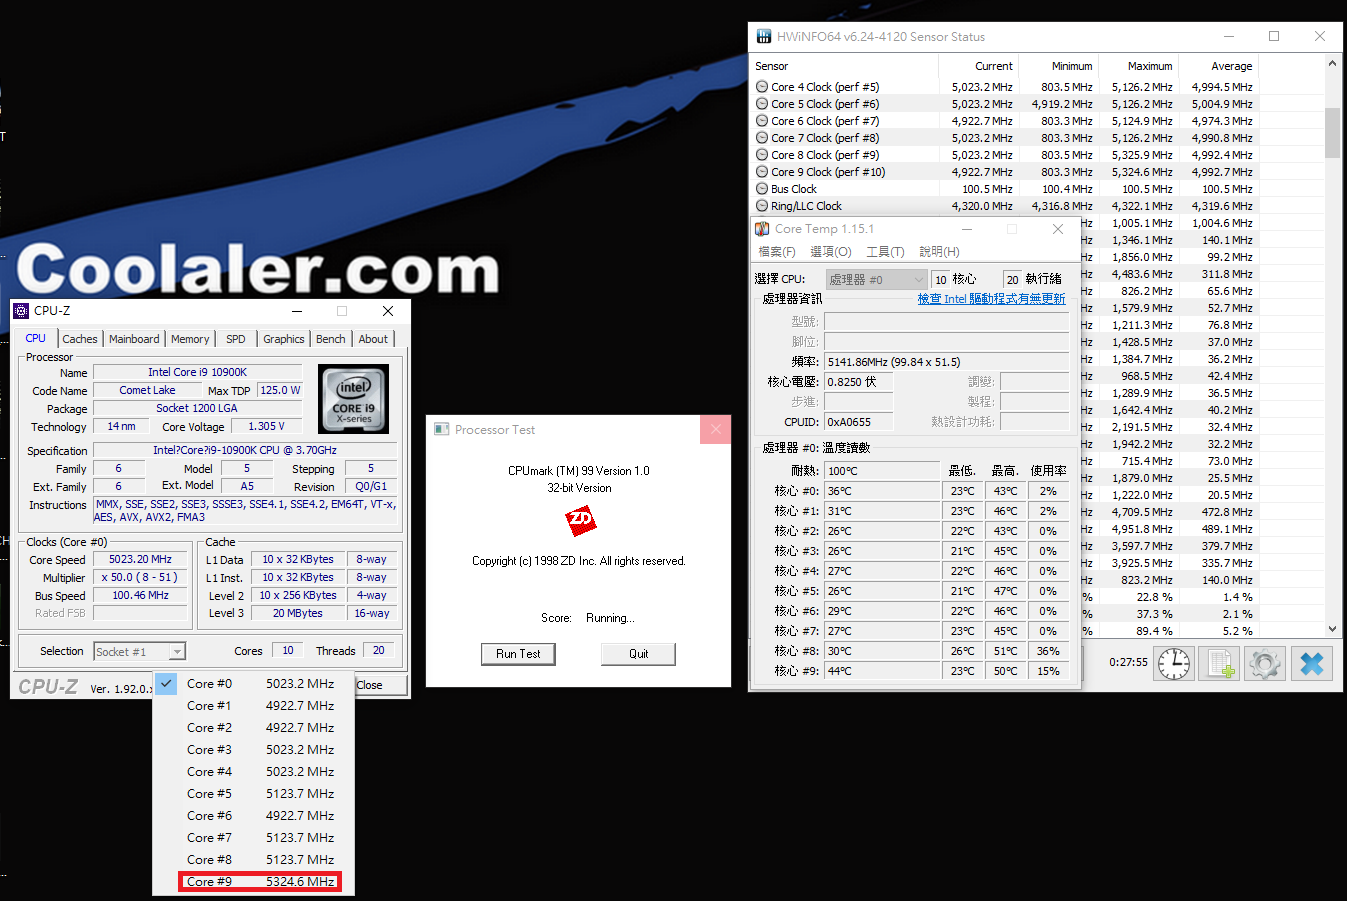
f.10900K@All Core 5.4GHz CPUMark99
測試平台
CPU:Intel Core i9-10900KF QS
CPU:Intel Core i9-10900K retail
CPU:Intel Core i5-10600K retail
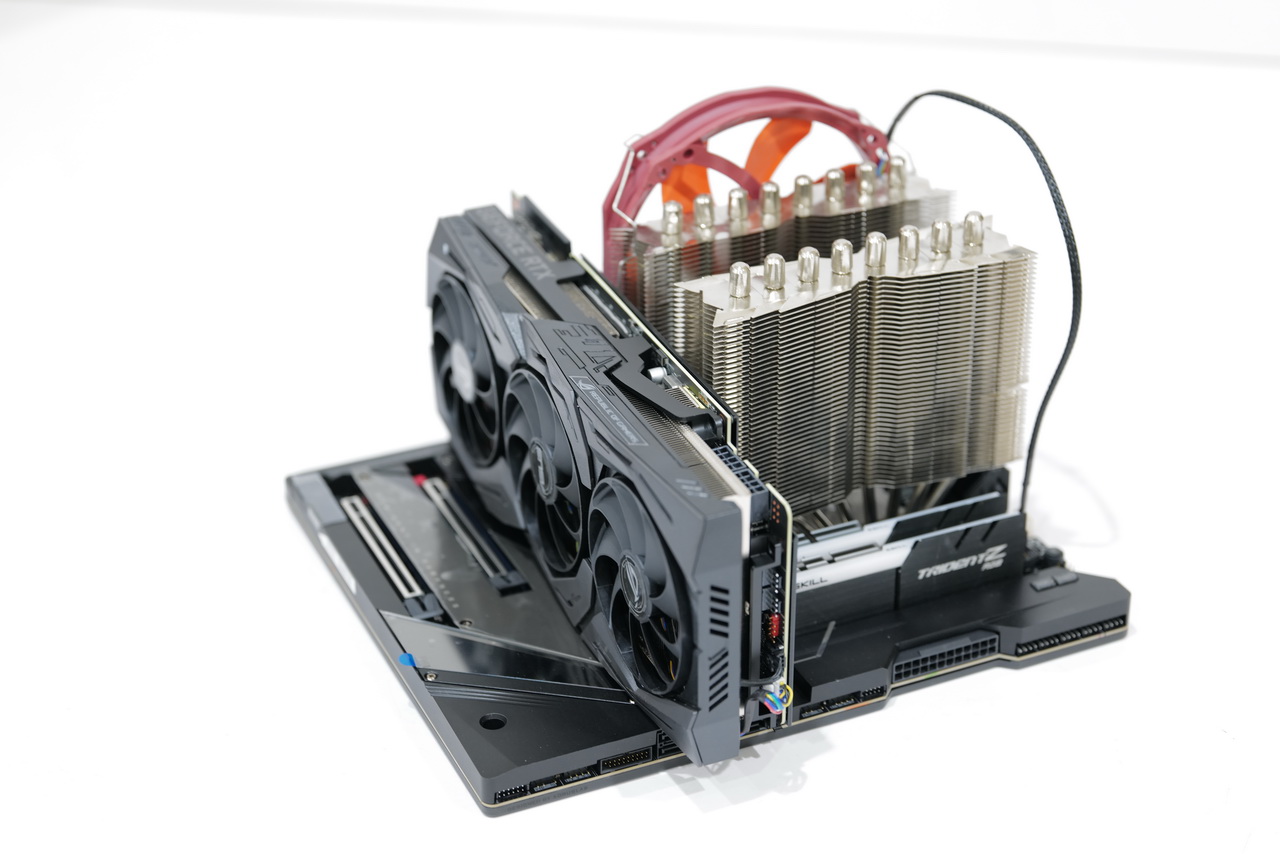
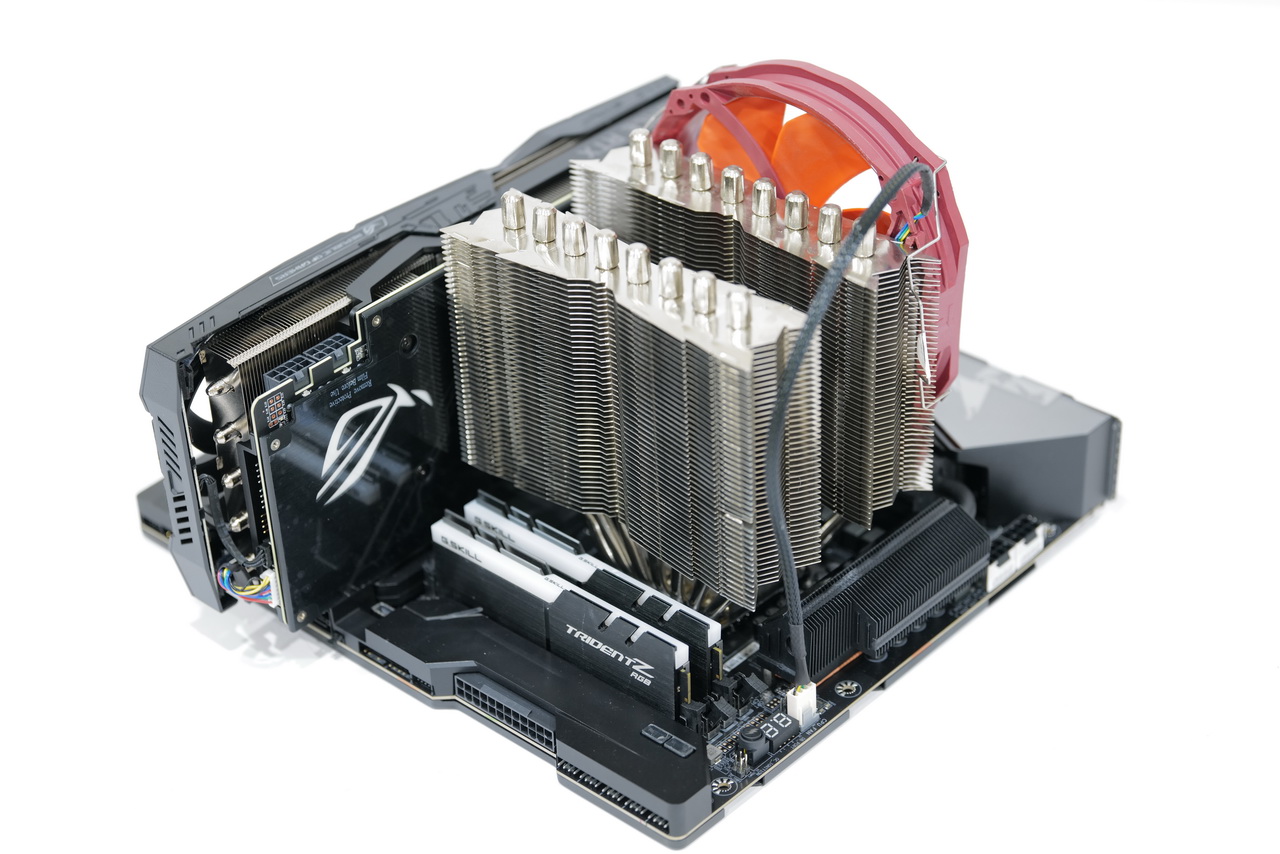
CPU Cooler:Thermalright Silver Arrow Extreme IB-E (5.0~5.2GHz)
CPU Cooler:Thermalright Silver Arrow Extreme IB-E+Delta AFC1212DE X2 Fan (5.3~5.4GHz)
RAM:GSKILL Trident Z DDR4 4000 8GB X4 C18
MB:GIGABYTE Z490 AORUS XTREME BIOS F3
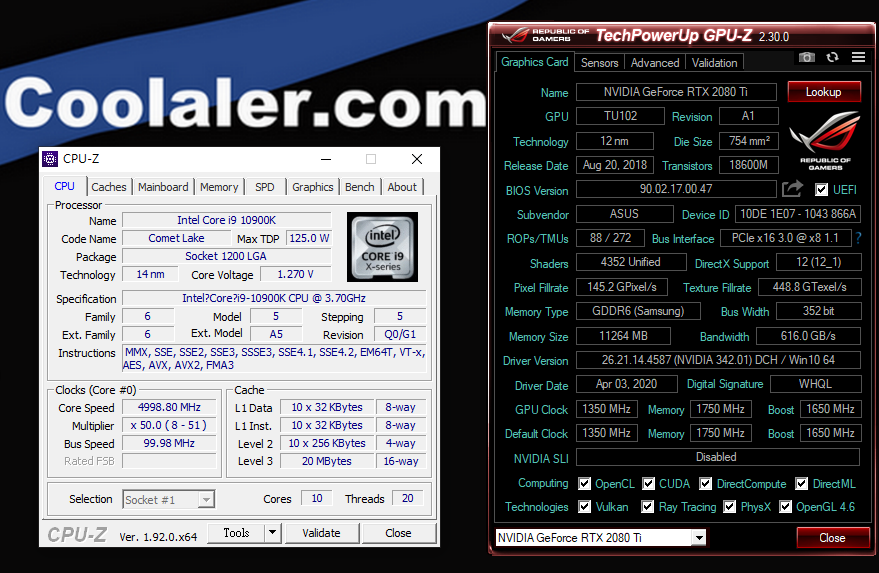
VGA:ASUS ROG STRIX RTX2080TI O11G
SDD:KINGSTON KC2500 NVMe PCIe SSD 1TB
SSD:CORSAIR MP600 NVMe PCIe SSD 2TB
PSU:Corsair AX1500i
OS:Windows 10 64bit 1909
Temperature :室溫 25°C
High Speed Delta Fan for Overclocking 5.4GHz

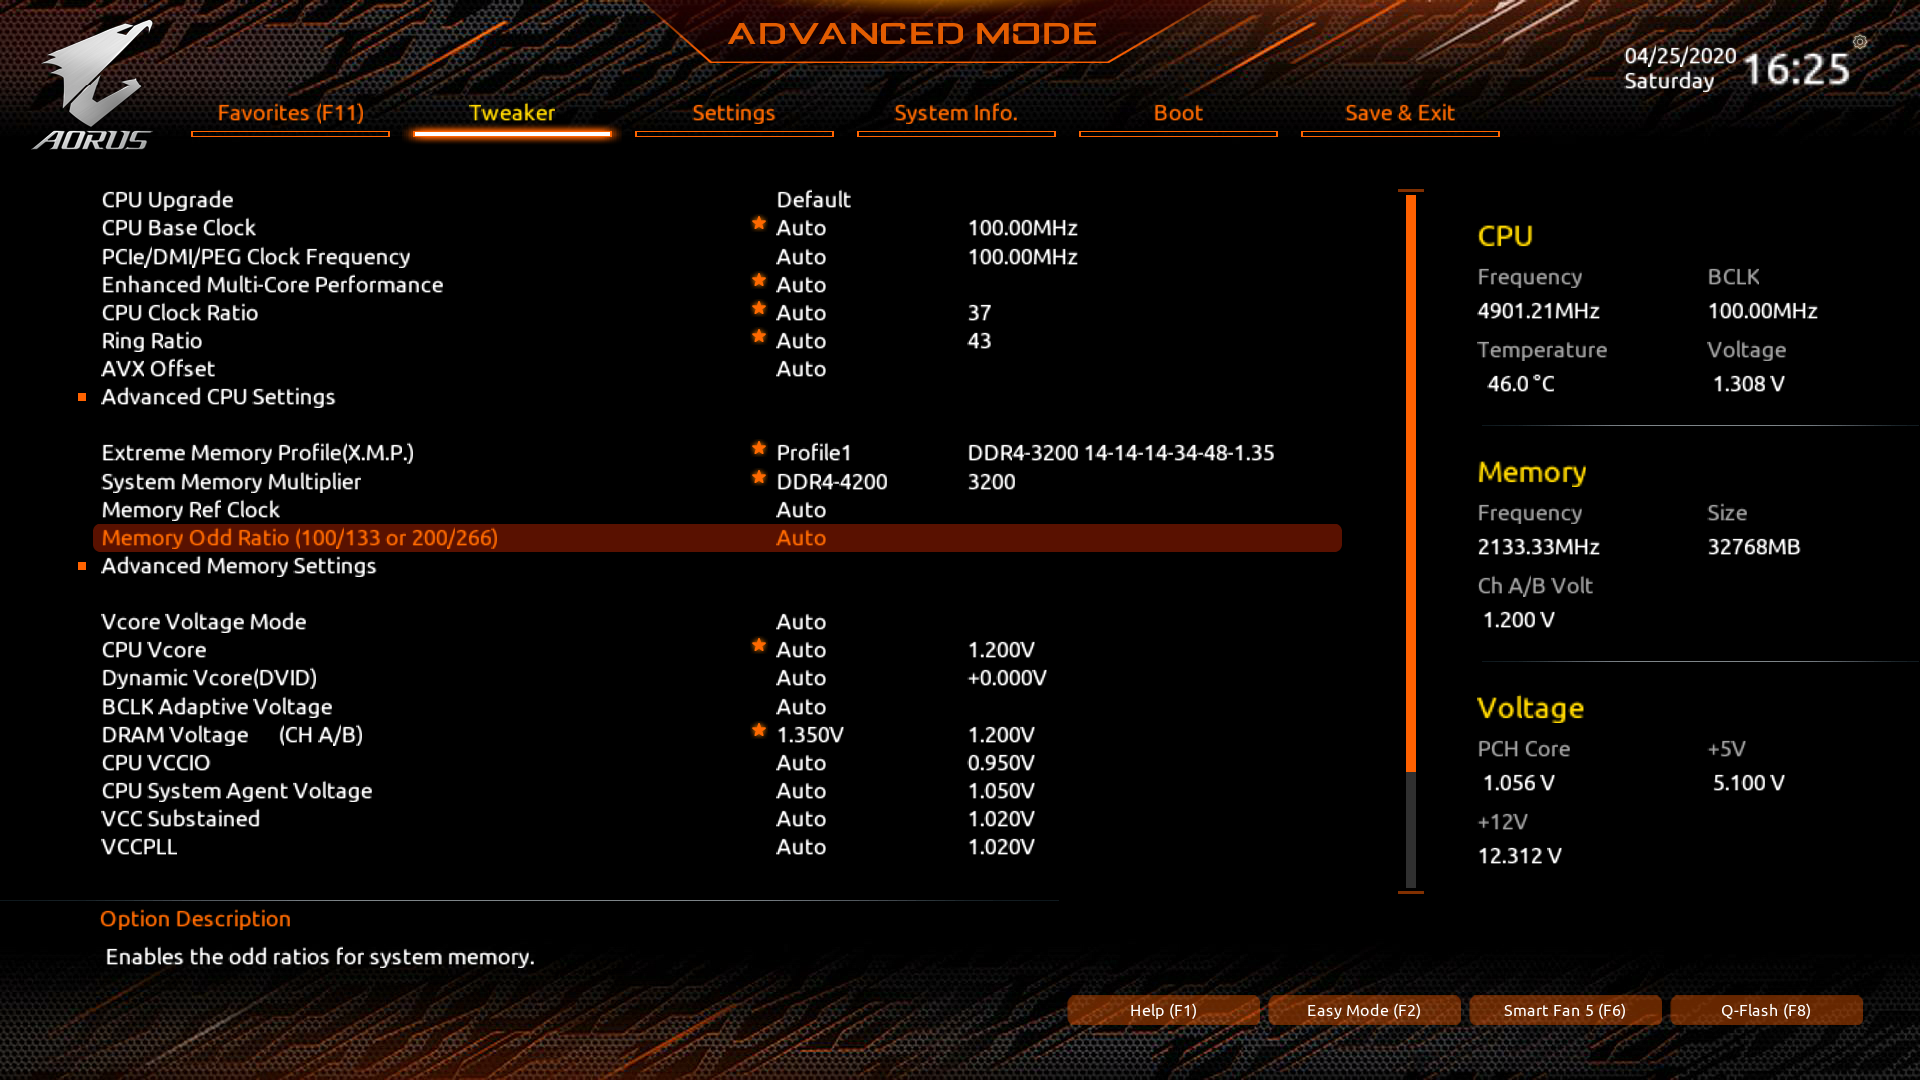
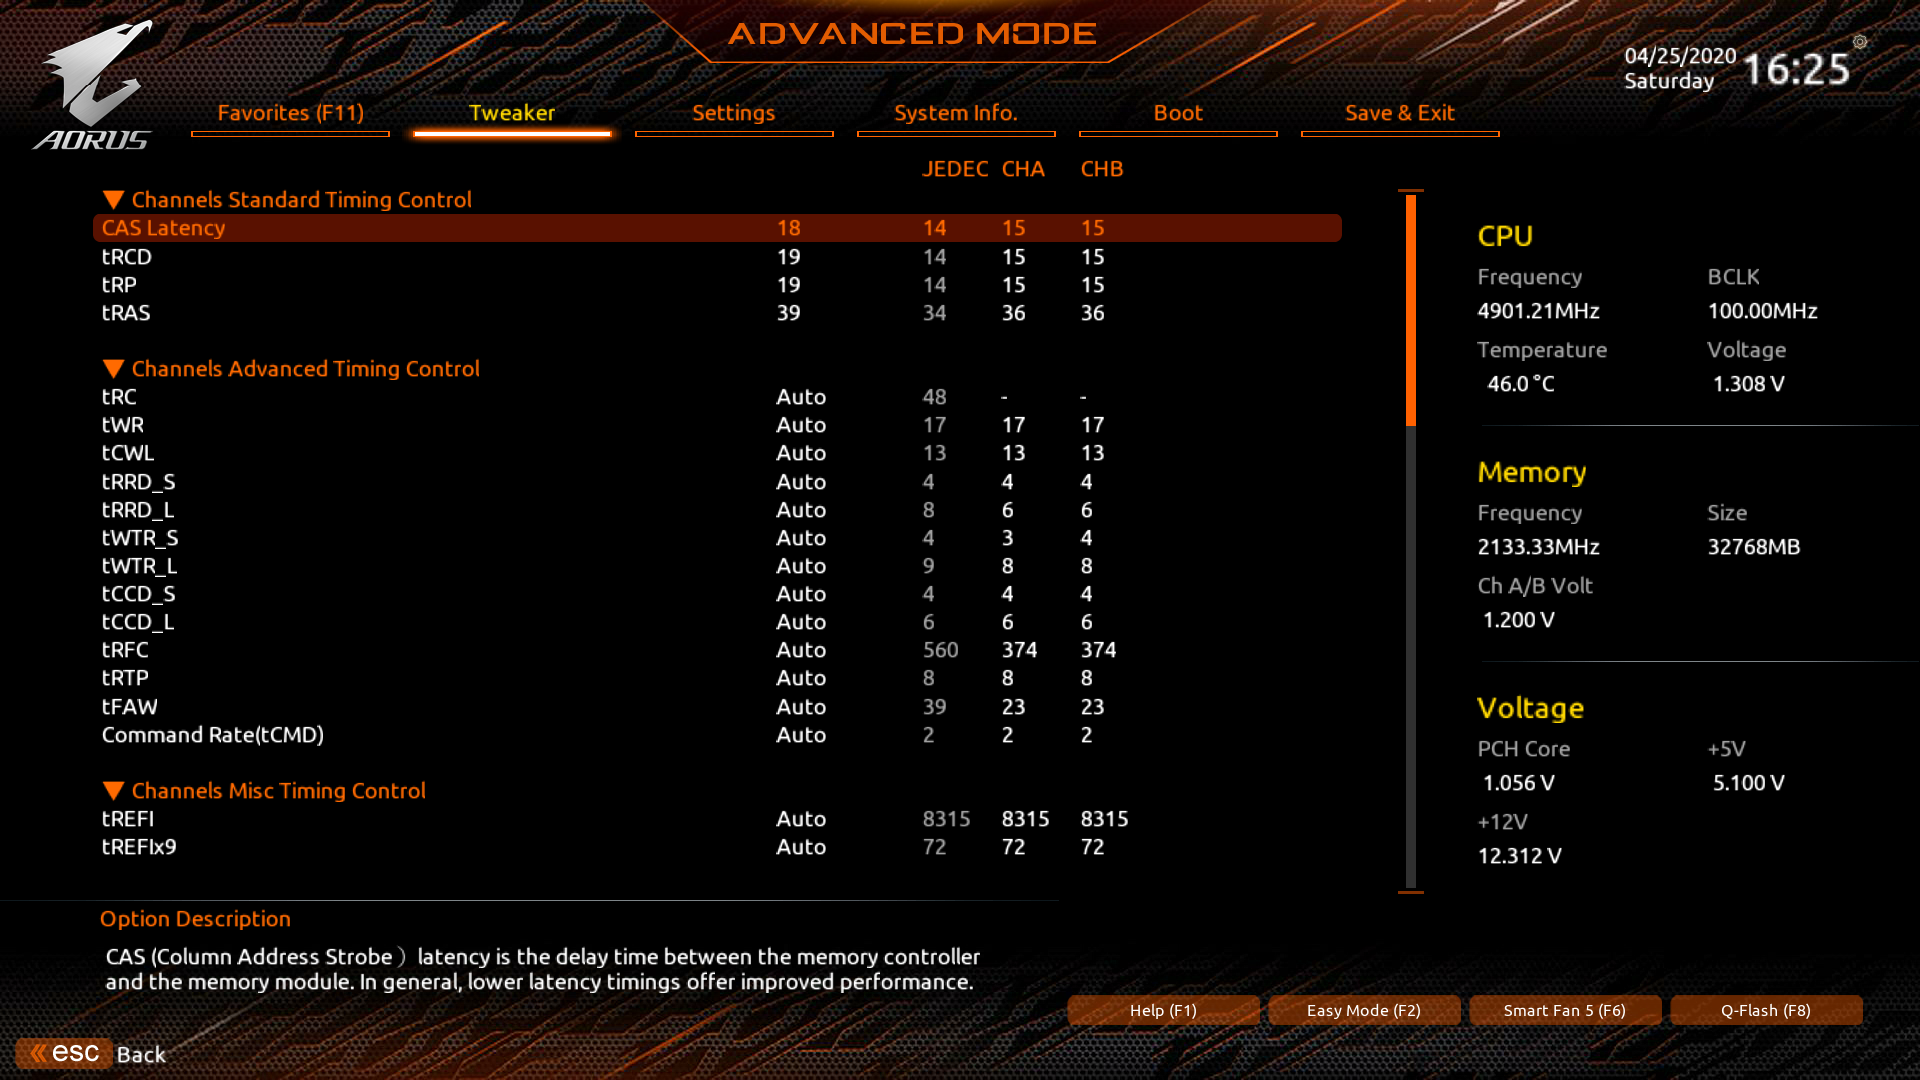
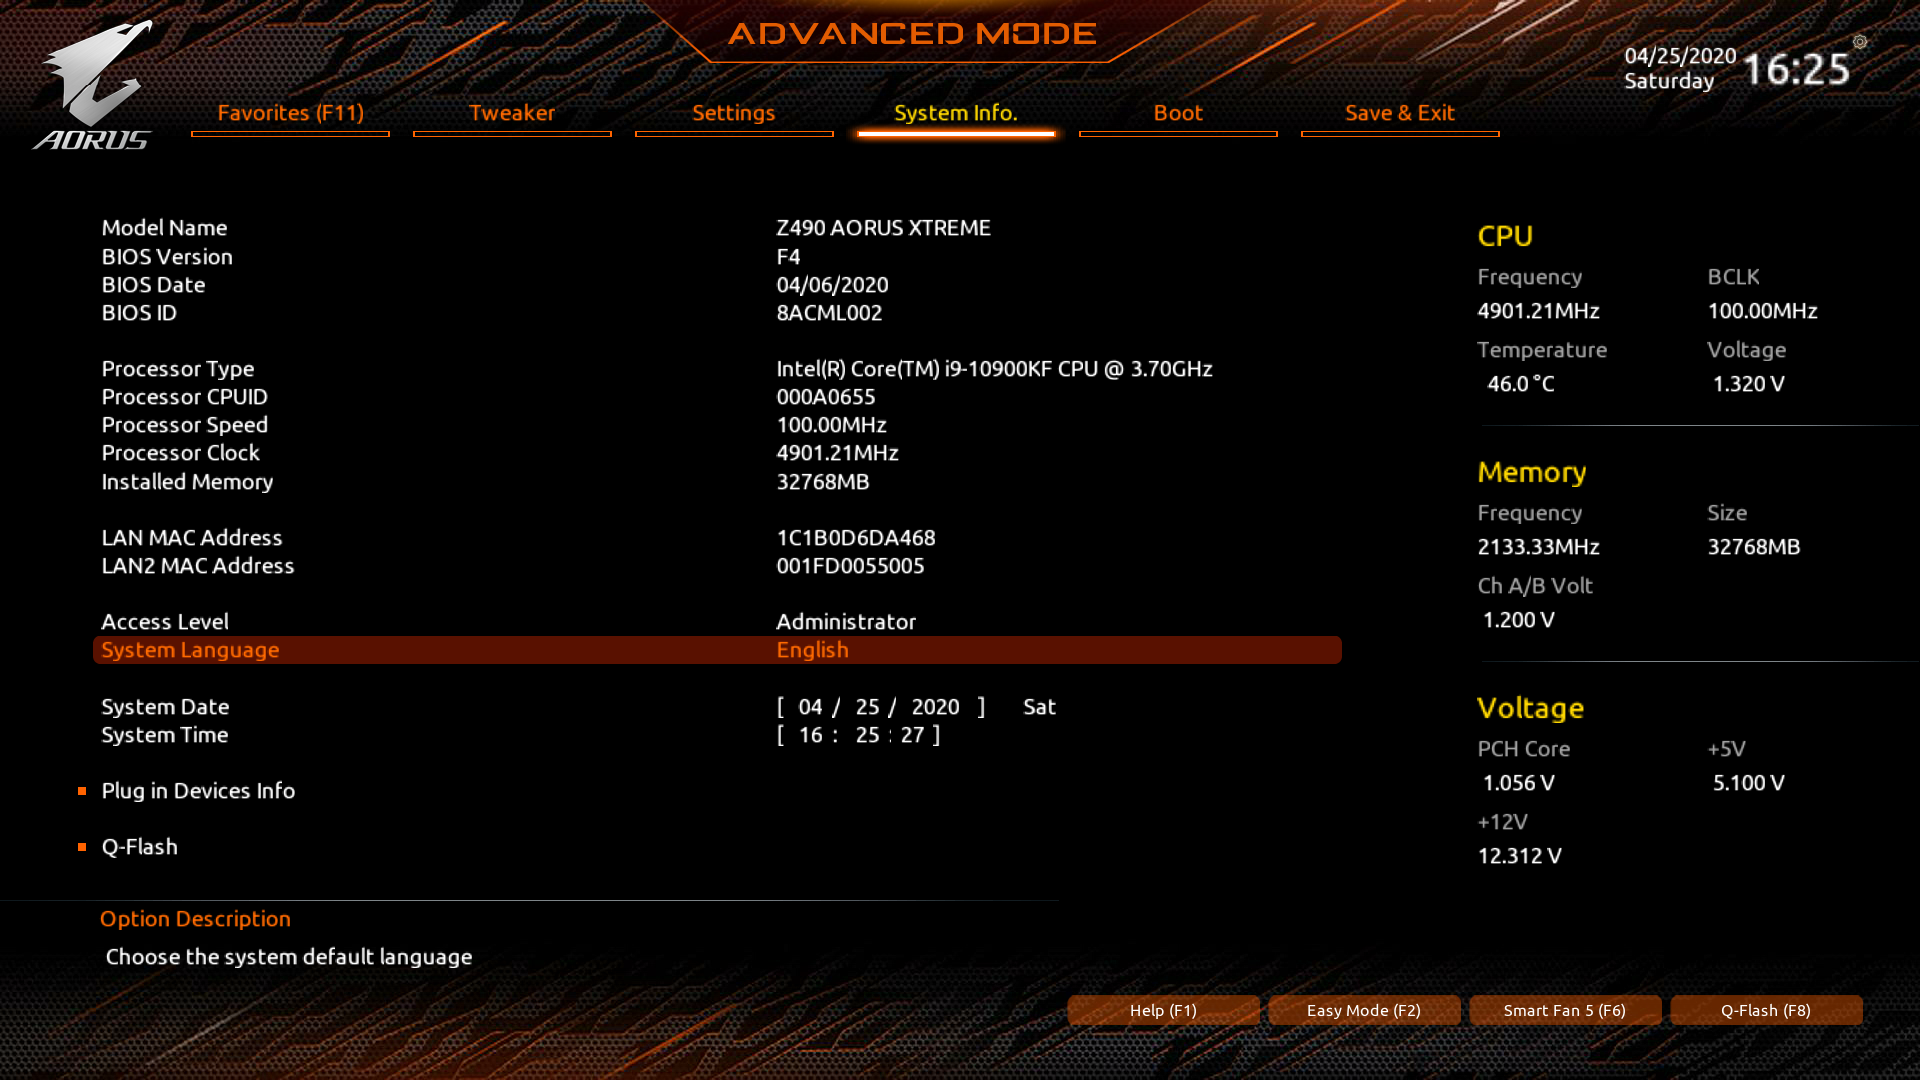
GIGABYTE Z490 AORUS XTREME BIOS
A.default
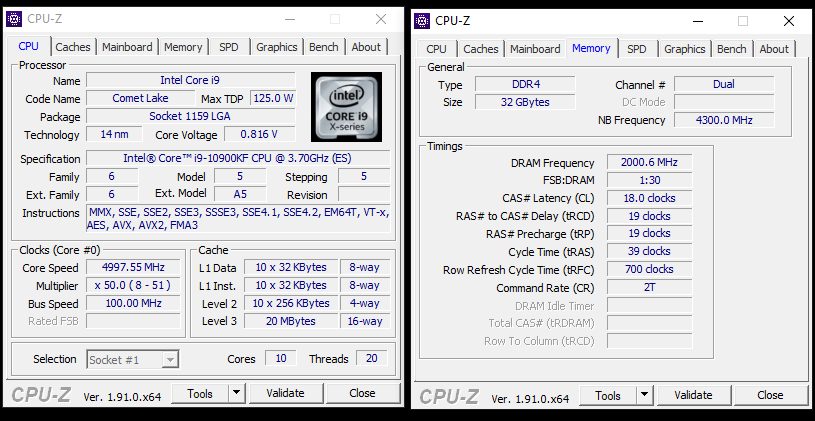
Core i9-10900KF@Boost CPU-Z資訊
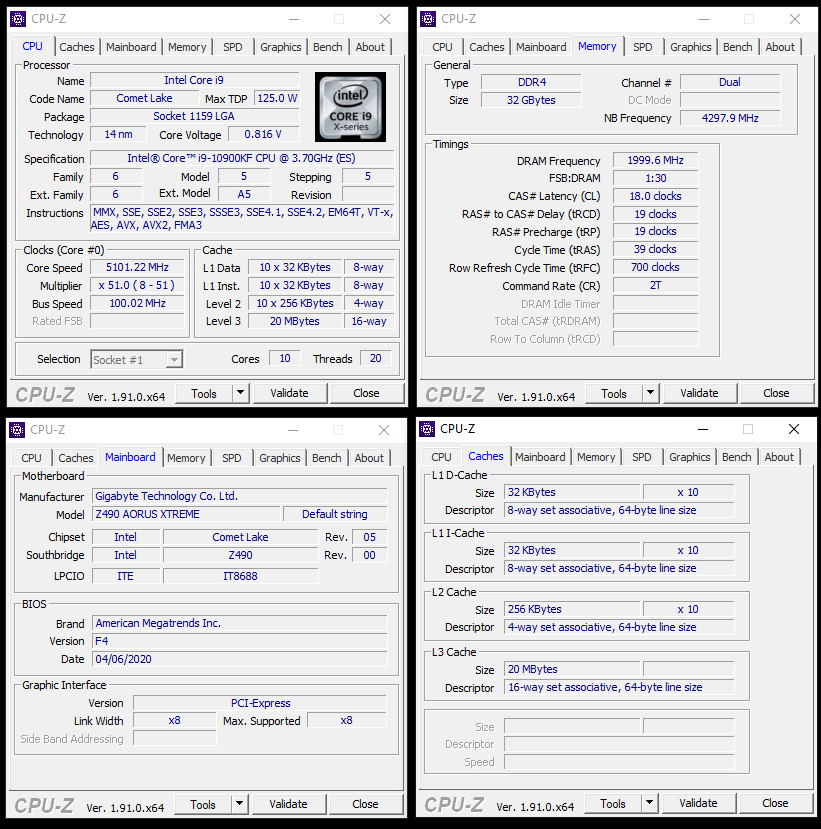
Core i9-10900K@Boost CPU-Z資訊
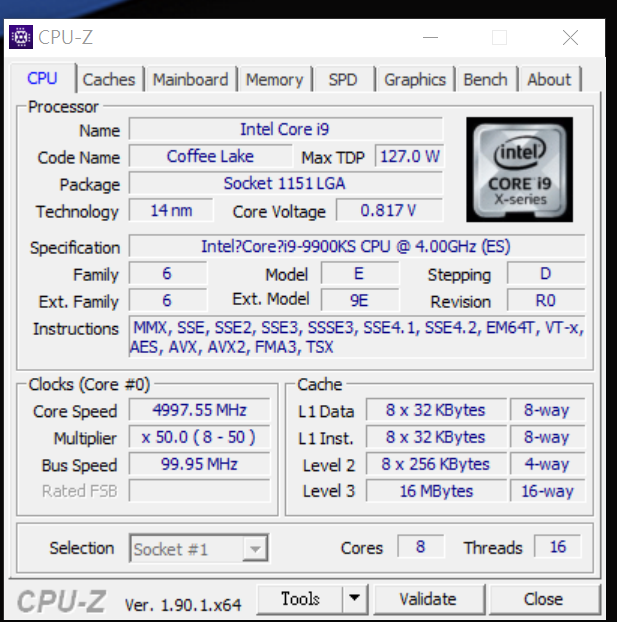
對照組 Intel Core i9-9900KS「Special Edition」CPU-Z資訊
Core i9-10900K 預設時的頻率
1.Core i9-10900K預設時待機頻率為 4.9~5.3GHz
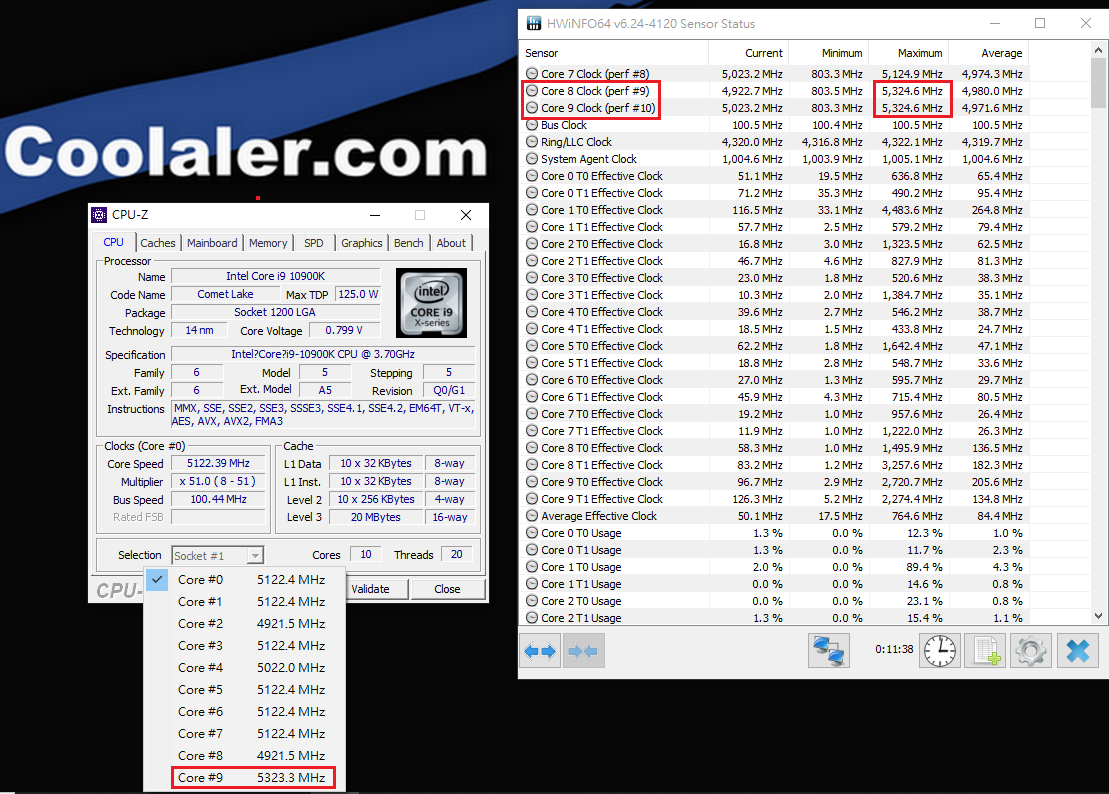
2.Core i9-10900K預設時單工負載時頻率為 4.9~5.3GHz
1.Cinebench R15 & R20 CPU Test
Cinebench是一個真實的跨平台測試套件,用於評估計算機的硬件功能,現有最新版本已至 R20版本,由於它是 以 Cinema 4D動畫製作軟體為基礎進行測試,所以能夠反應出多線程處理器與顯示卡面對實際應用軟體所能發揮的效能,且能在短時間內得知測試結果,是一個能快速得知是否能 All Core 5GHz的測試軟體
Cinebench Release 20的改進反映了近年來 CPU和渲染技術的整體進步,為 Cinema 4D利用多個 CPU核心和普通用戶可用的現代處理器功能提供了更準確的測量,最重要的是它是免費的

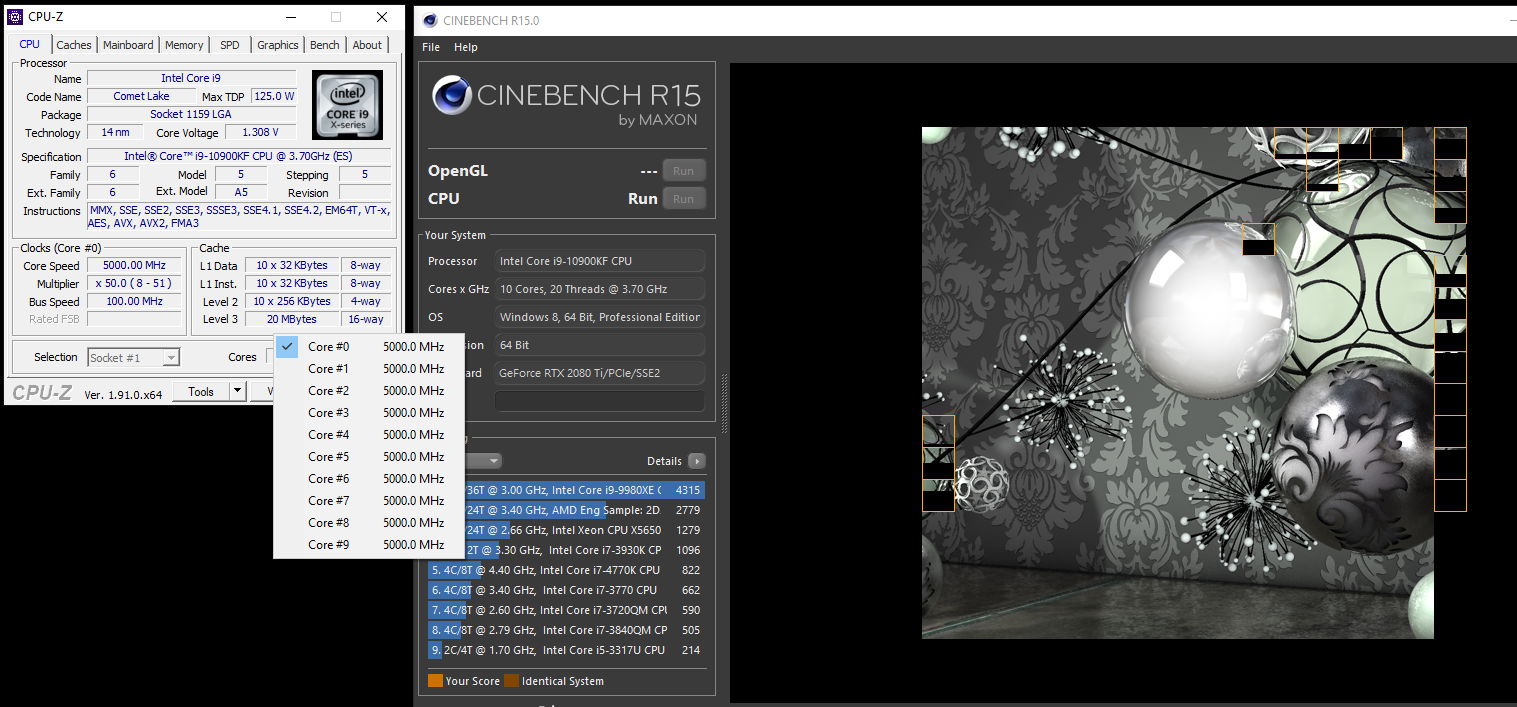
Cinebench R15 CPU test Results
在 Cinebench R15 CPU test過程中 10900KF@Boost 頻率維持在 All Core 4.9GHz

10900KF@Boost Cinebench R15 CPU test 2584cb

Cinebench R20 CPU test Results
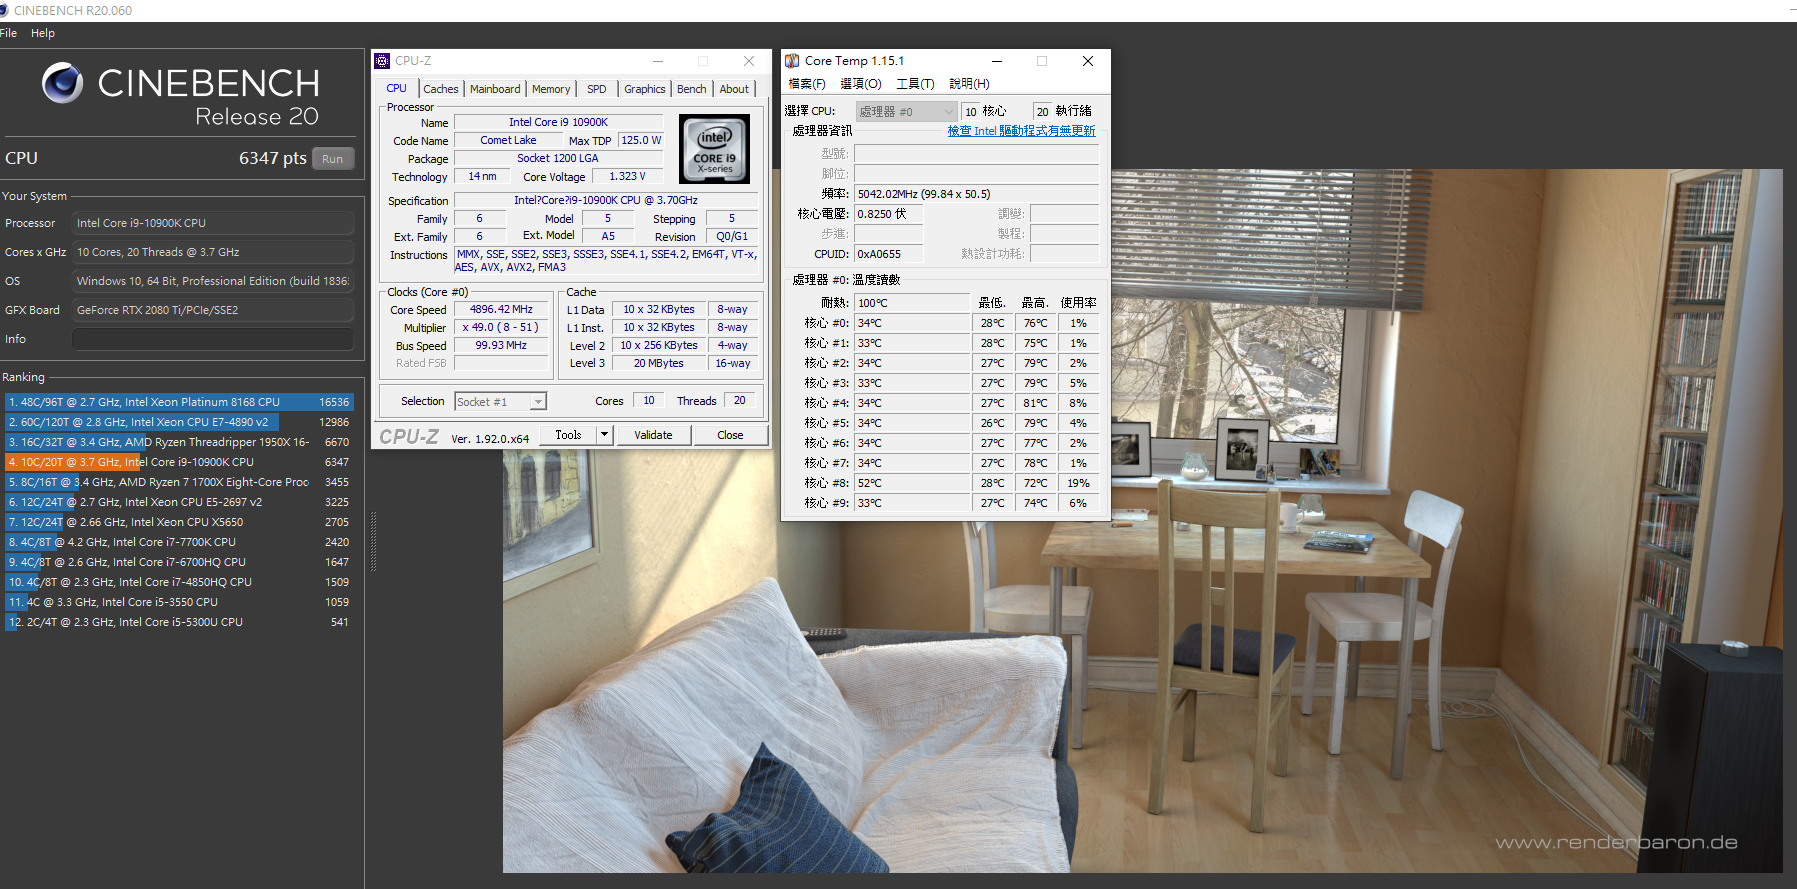
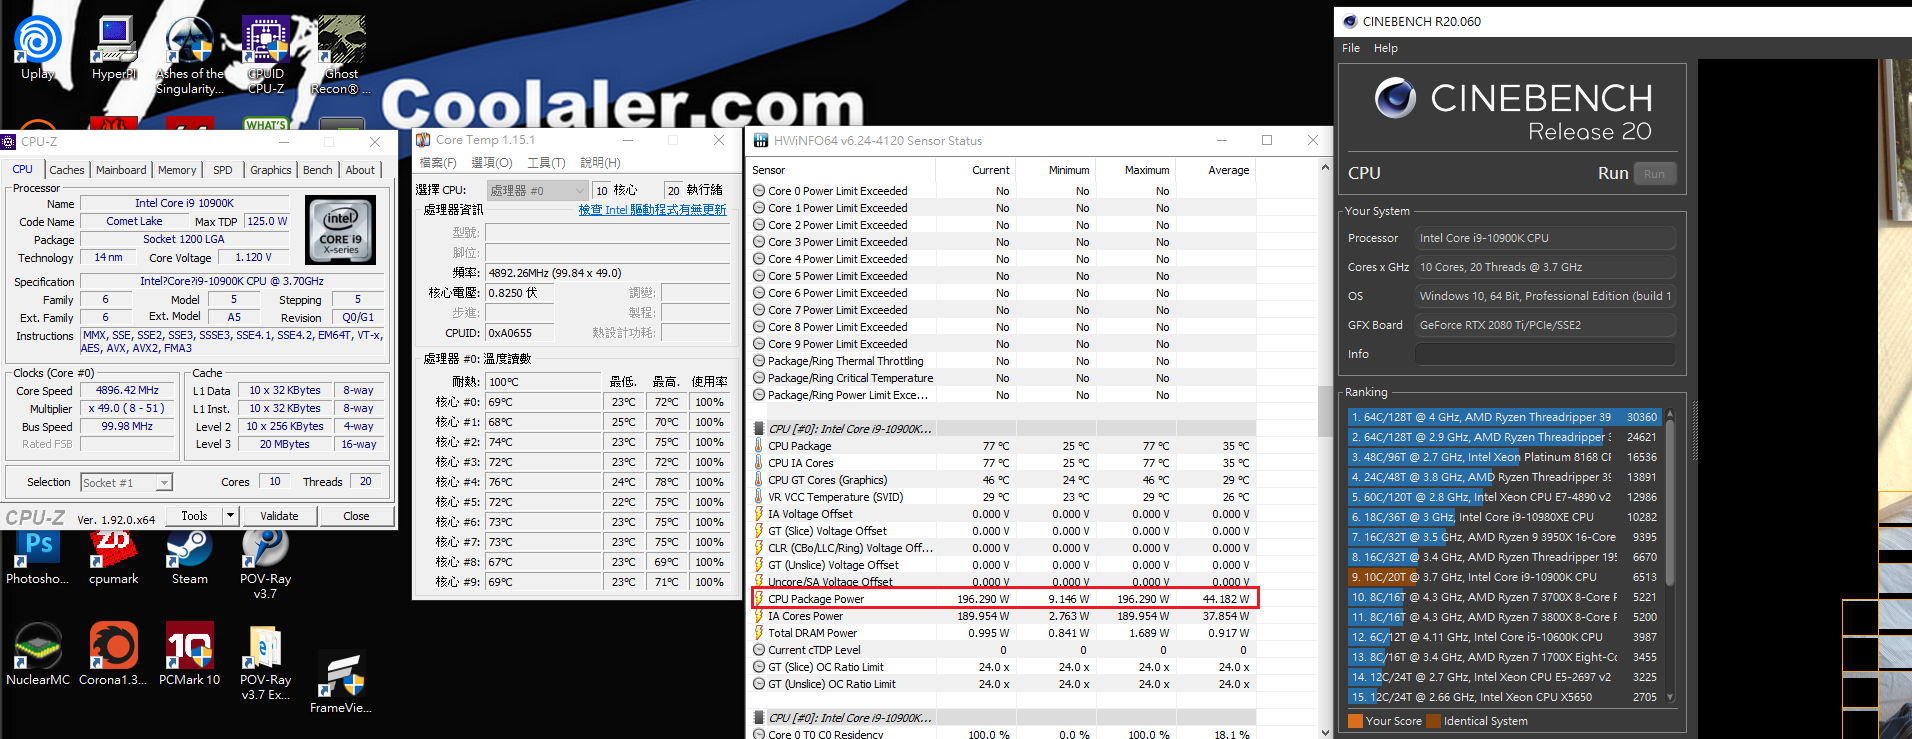
在 Cinebench R20 CPU test過程中 10900K@Boost 頻率維持在 All Core 4.9GHz
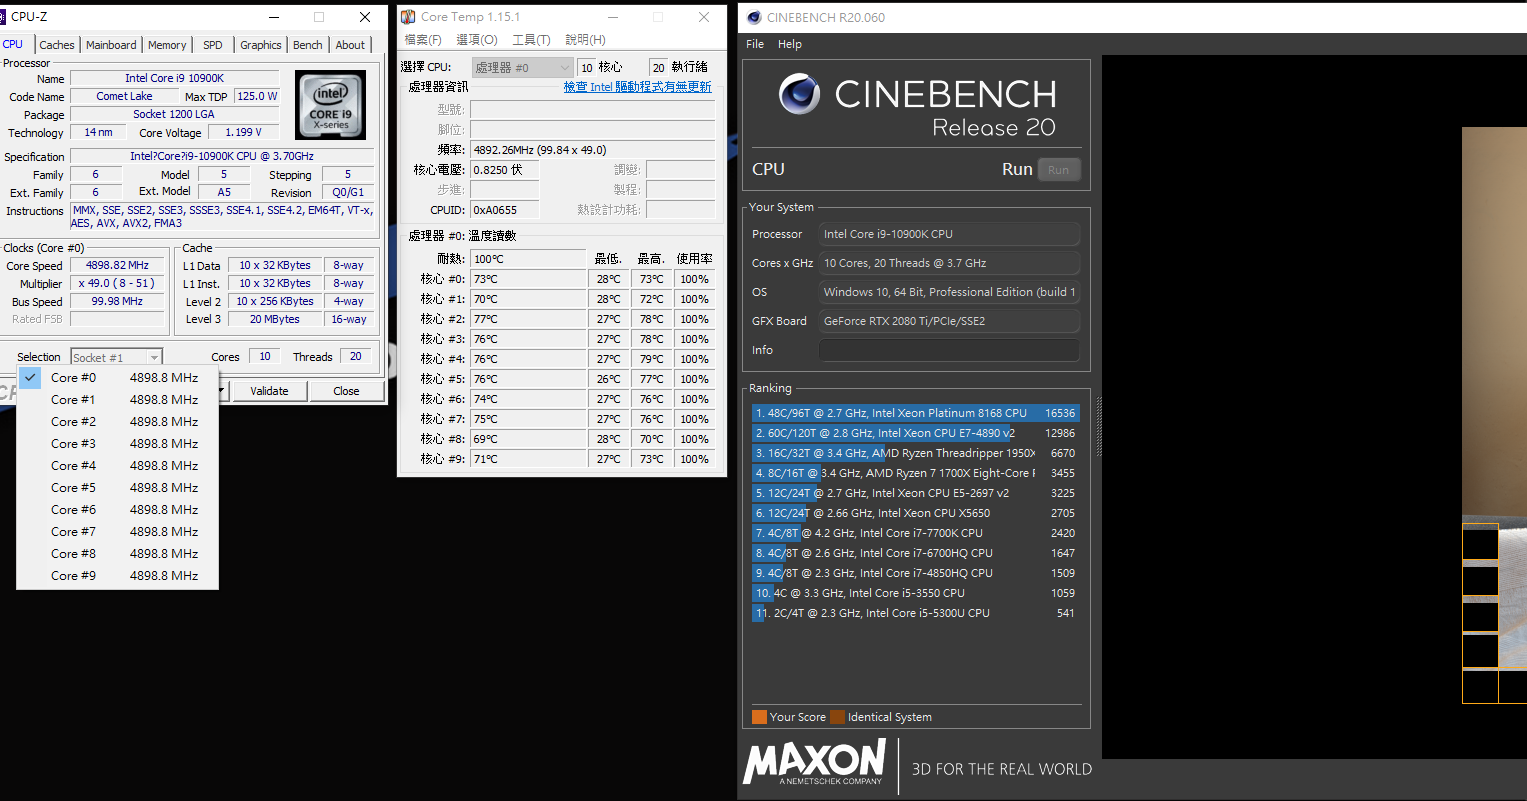
10900K@Boost Cinebench R20 CPU test 6347pts
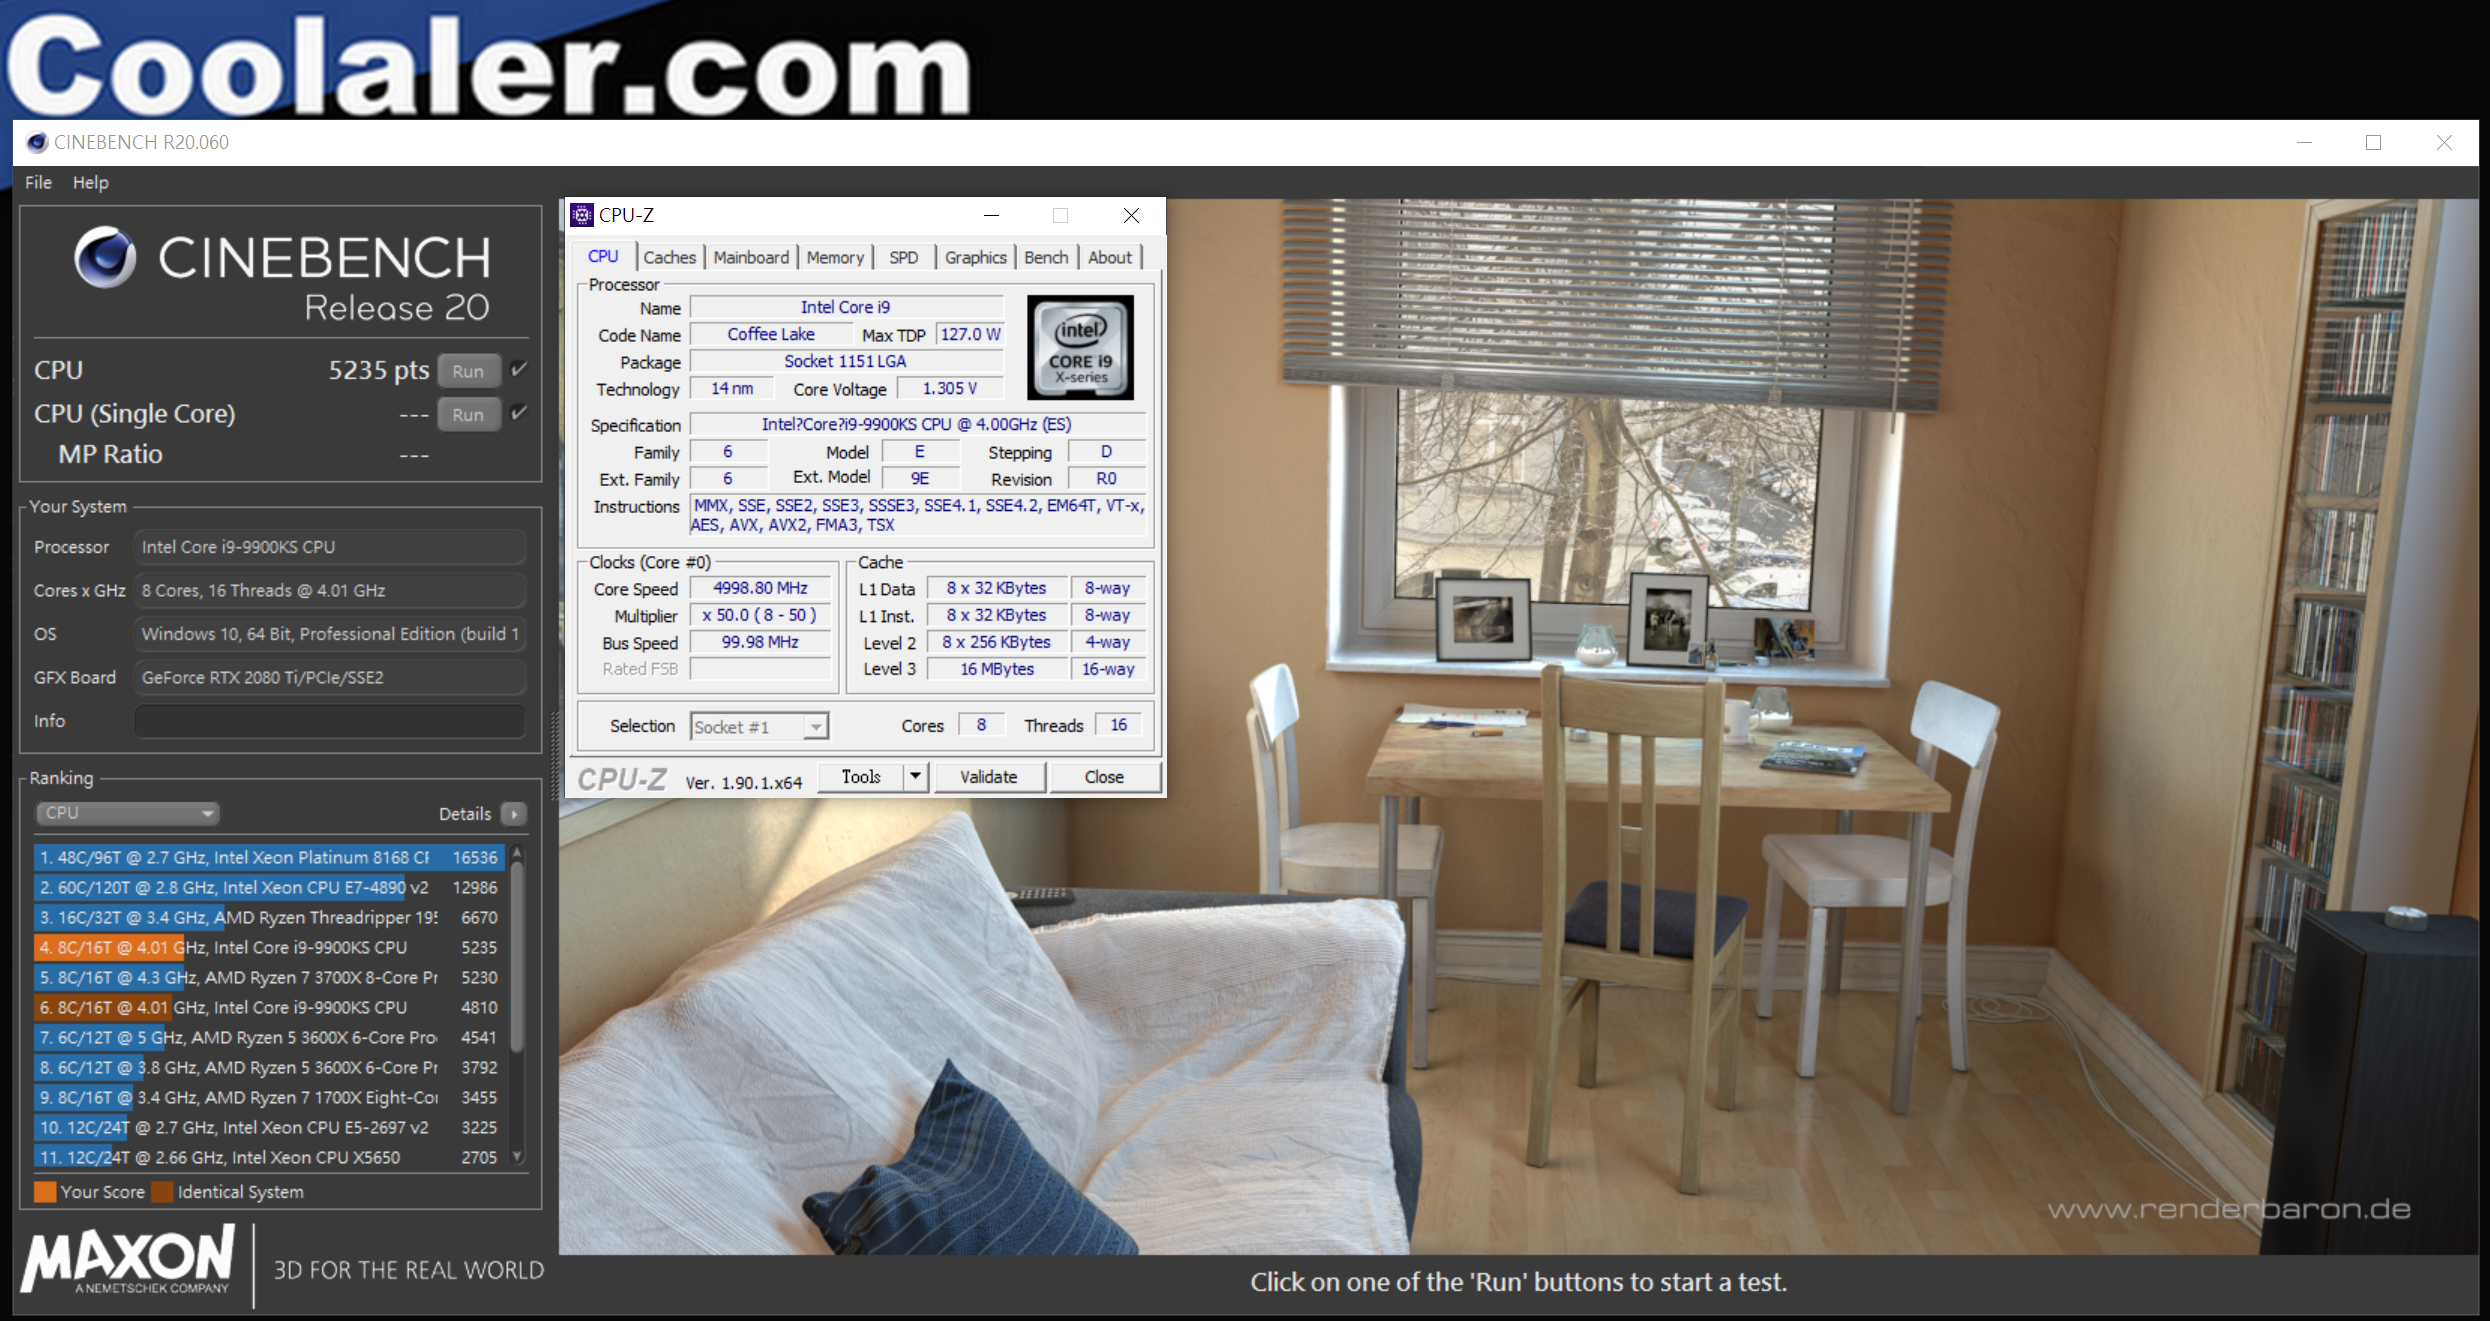
參考對照組 9900KS@Boost
9900KS@Boost Cinebench R20 CPU test 5235pts
2.wPrime 2.10 1024M Benchmark
wPrime是一款多線程浮點運算測試軟體,有 32M及 1024M兩種,設定在 1024M之測試對穩定度的要求更高,在多線程處理器上比開啟多個 Super Pi測試更方便精確
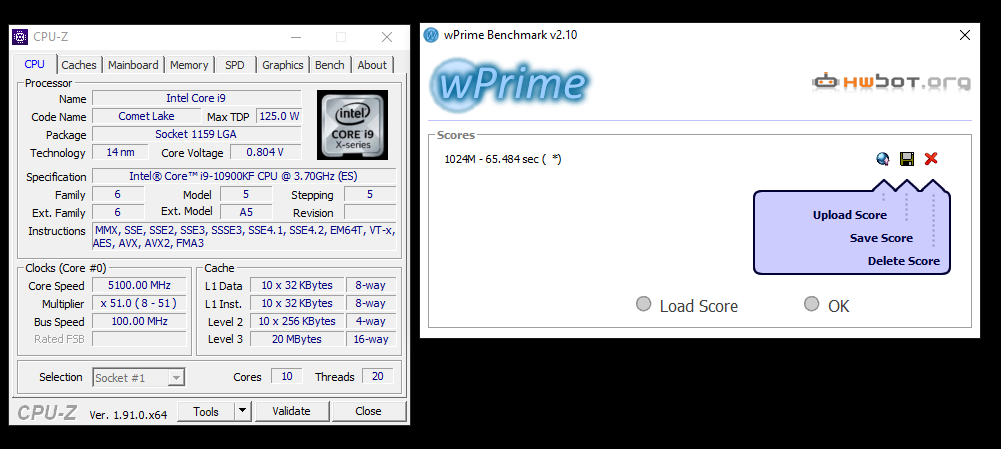
10900KF@Boost在 wPrime 2.10 1024M過程中 10900KF All Core頻率維持在 4.9GHz
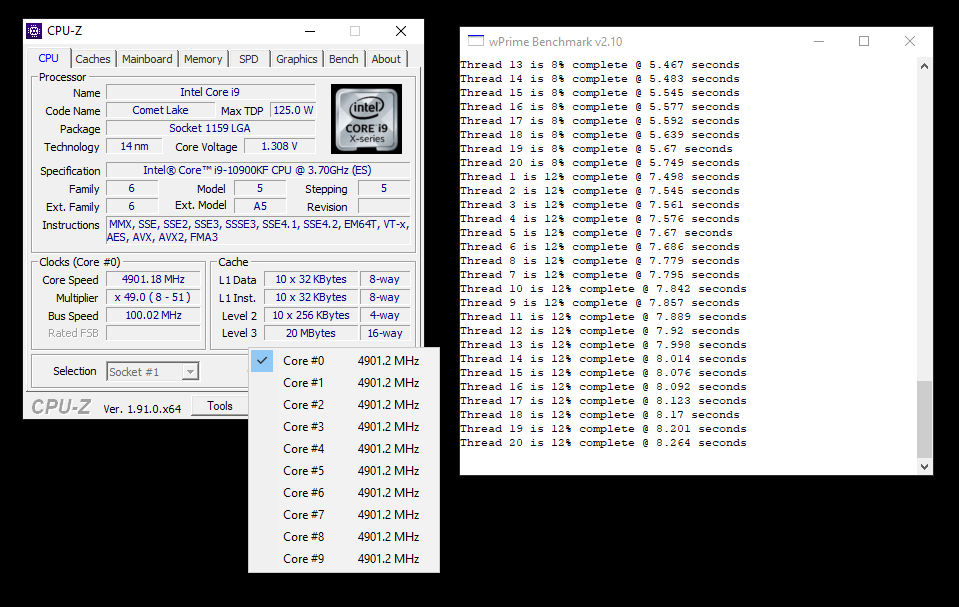
10900K@Boost wPrime 2.10 1024M 65.484s
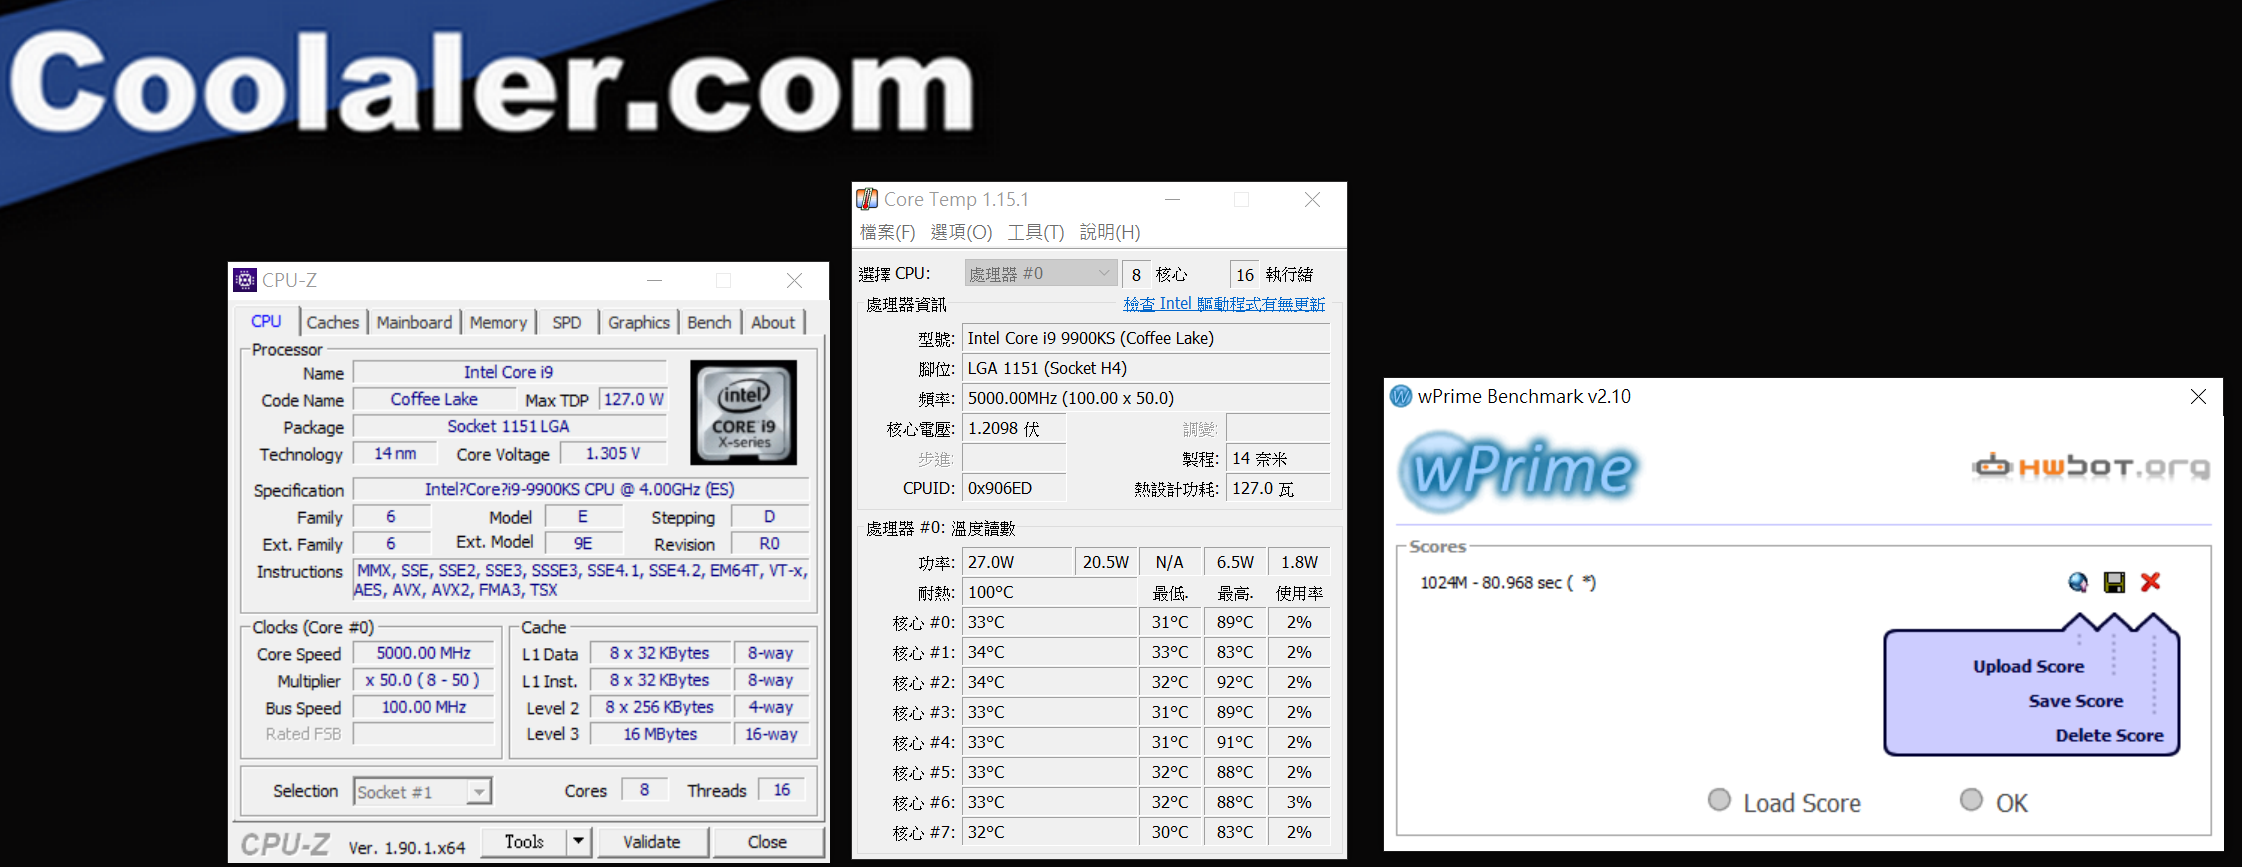
參考對照組 9900KS@Boost
9900KS@Boost wPrime 2.10 1024M 80.968s
3.CPU-Z Bench
CPU-Z為一個中央處理器、記憶體及主機板資訊的 Windows軟體,在近年新增了 Bench item,提供處理器的快速簡單測試
10900K@Boost CPU-Z Bench測試中頻率 4.9~5.3GHz
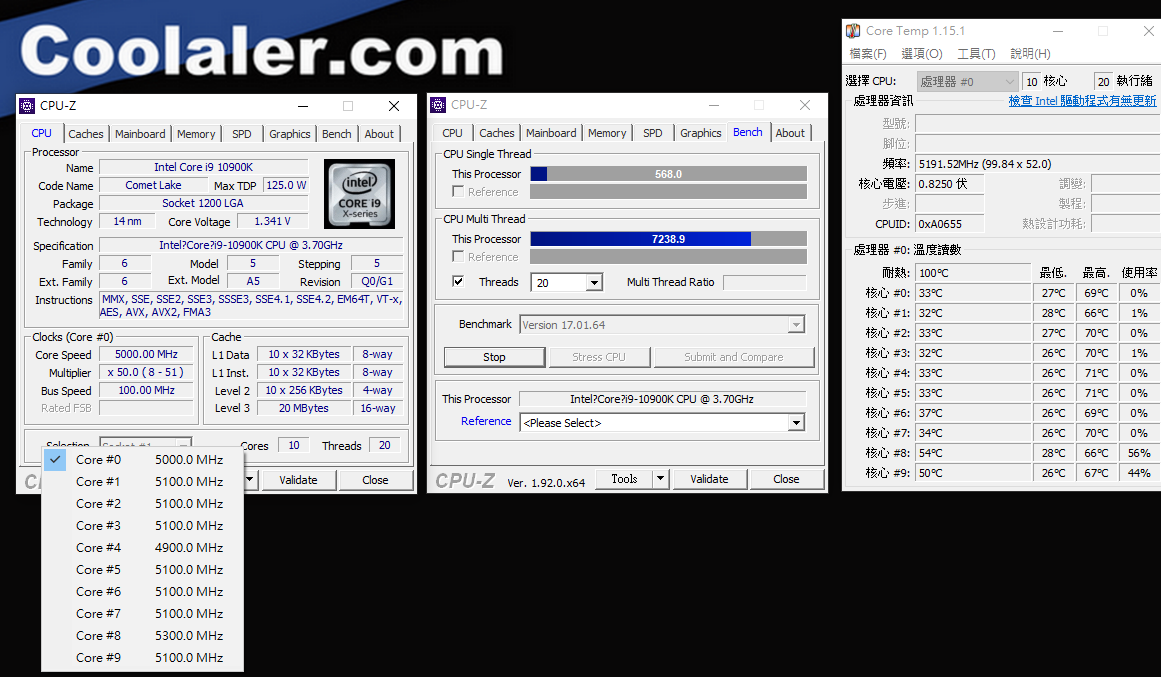
10900K@Boost CPU-Z Bench Single Thread 591.0Multi Thread 7333.8
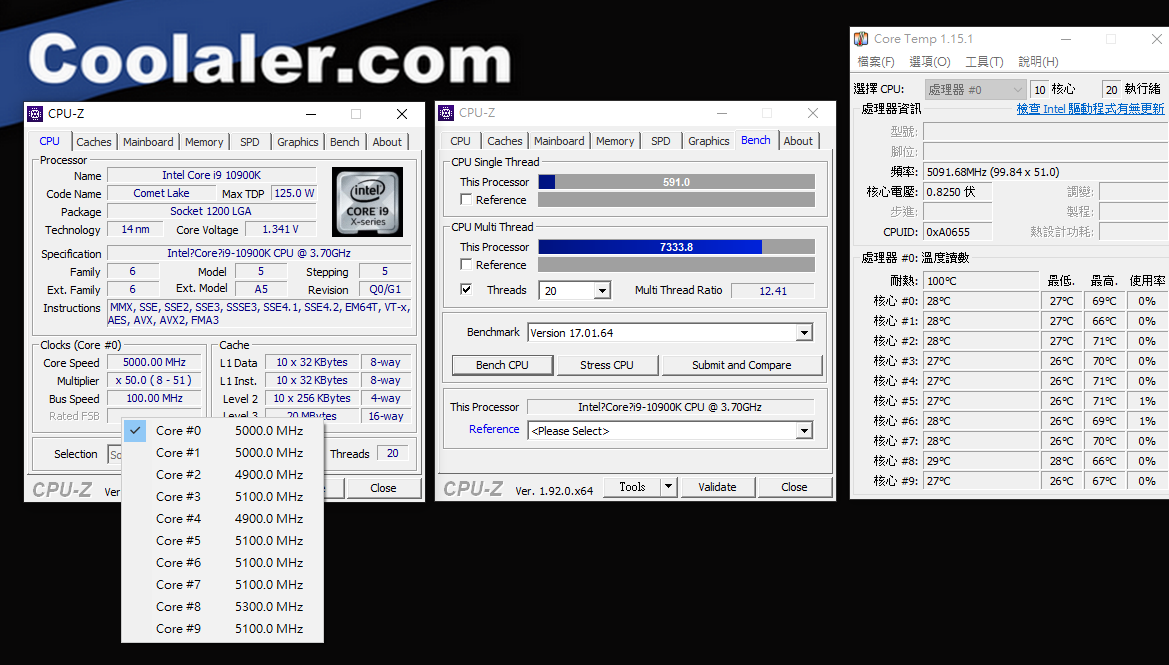
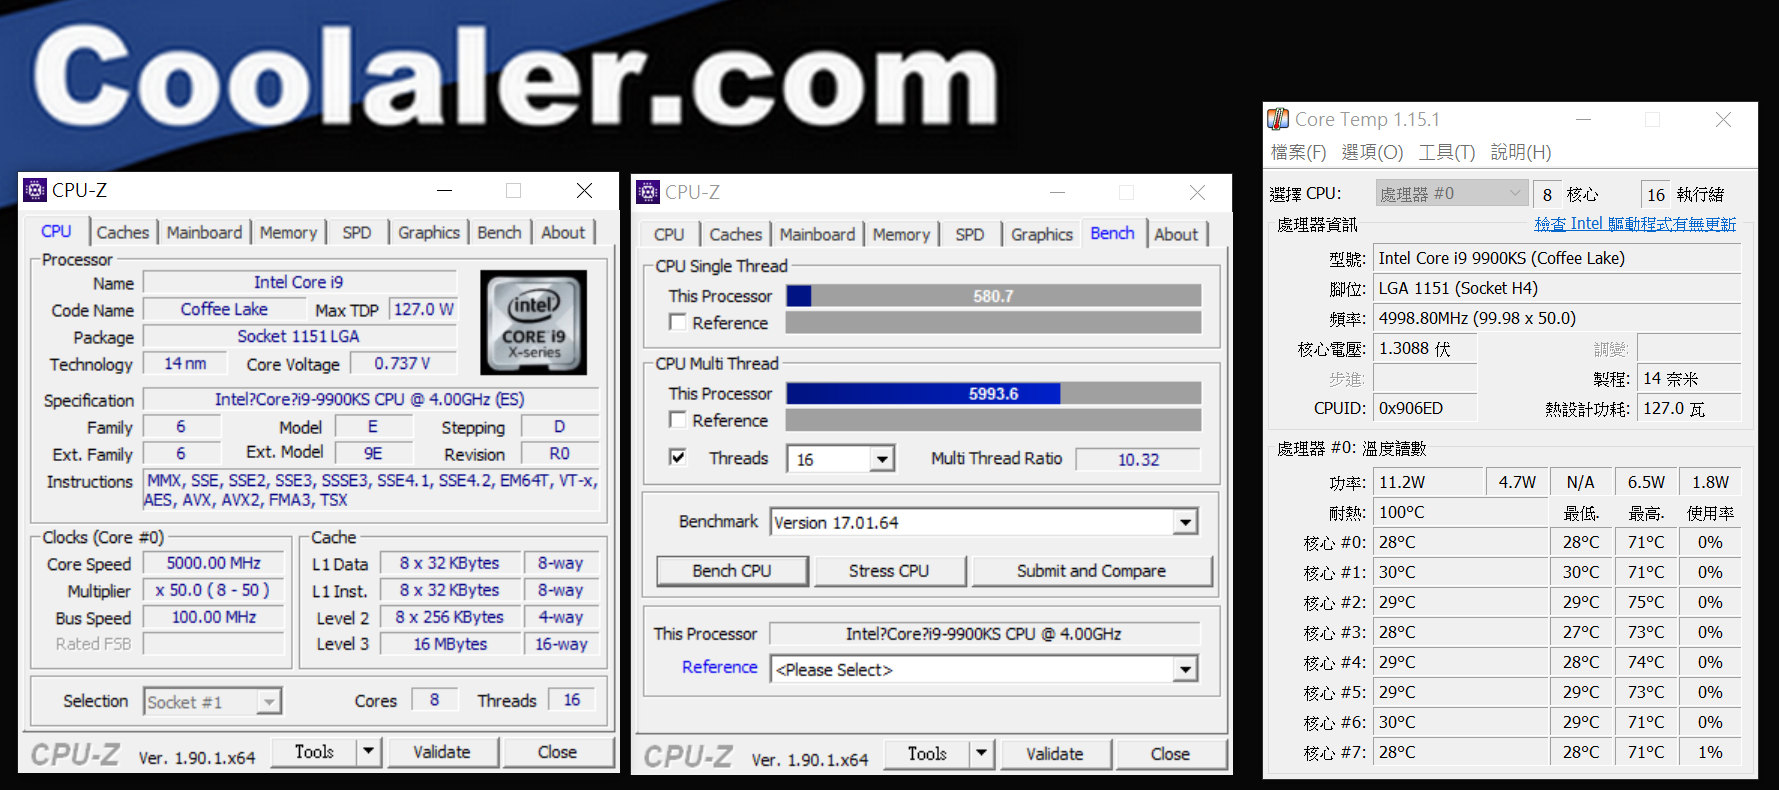
參考對照組 9900KS@Boost CPU-Z Bench Single Thread 580.7 Multi Thread 5993.7
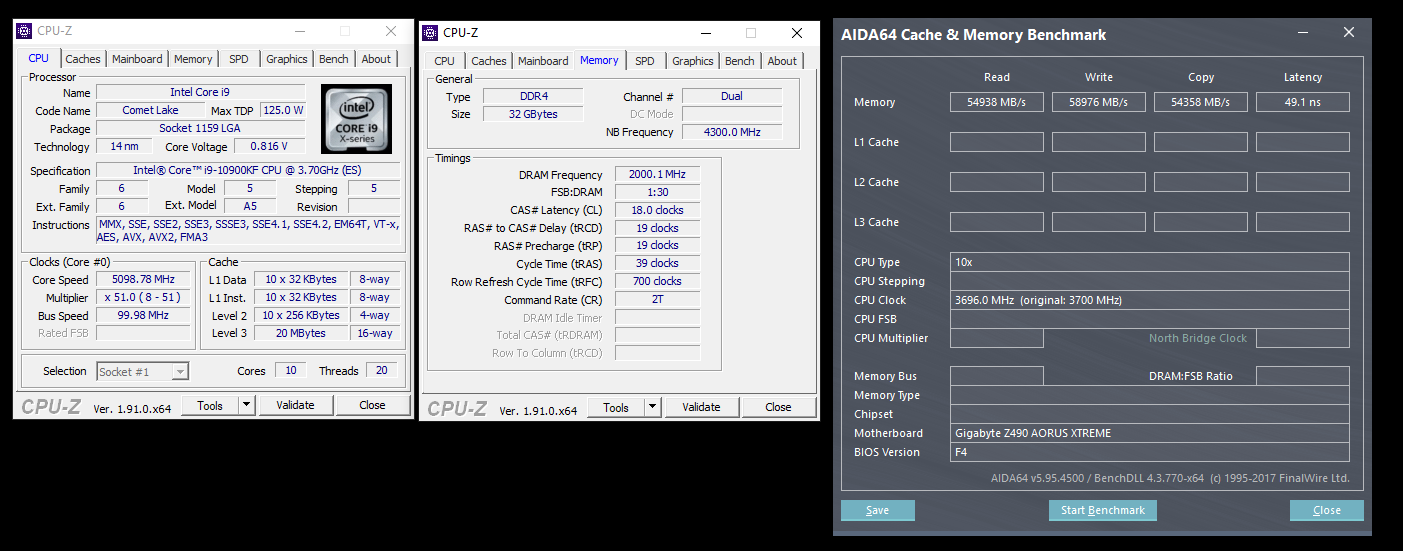
4.AIDA64 Cache & Memory Benchmark
AIDA64 Cache & Memory Benchmark可測量 CPU高速緩存和系統內存的帶寬和延遲。通過雙擊窗口中的任何矩形,列或行,我們可以單獨啟動基準測試或基準測試類型。例如,如果我們雙擊 “Memory”,則只會運行系統內存讀取,寫入,複製和延遲基準測試,即只執行給定行中的操作。同樣,如果我們雙擊 “Read”,則只會對所有內存類型運行讀取基準測試,即只執行給定列中的操作。如果我們雙擊任何矩形,則只會運行選定的單個基準
右鍵單擊 “Start Benchmark”按鈕將打開一個上下文菜單,我們可以在其中選擇運行所有基準測試或僅運行內存或緩存基準測試
10900KF@Boost & DDR4 4000C18 AIDA64 Cache & Memory Benchmark測試中 頻率為 All Core 5.1GHz(9 Core)
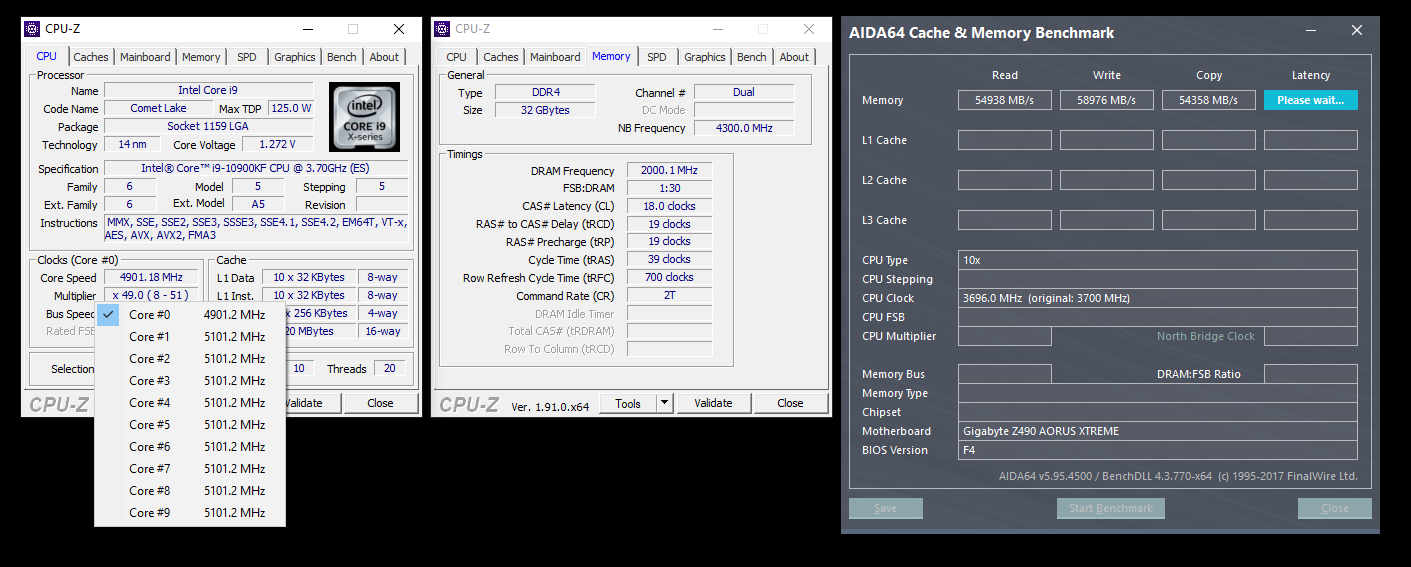
10900KF@Boost & DDR4 4000C18 AIDA64 Cache & Memory Benchmark
Read.54,938MB/s
Write.58,976MB/s
Copy.54,358MB/s
Latency 49.1ns
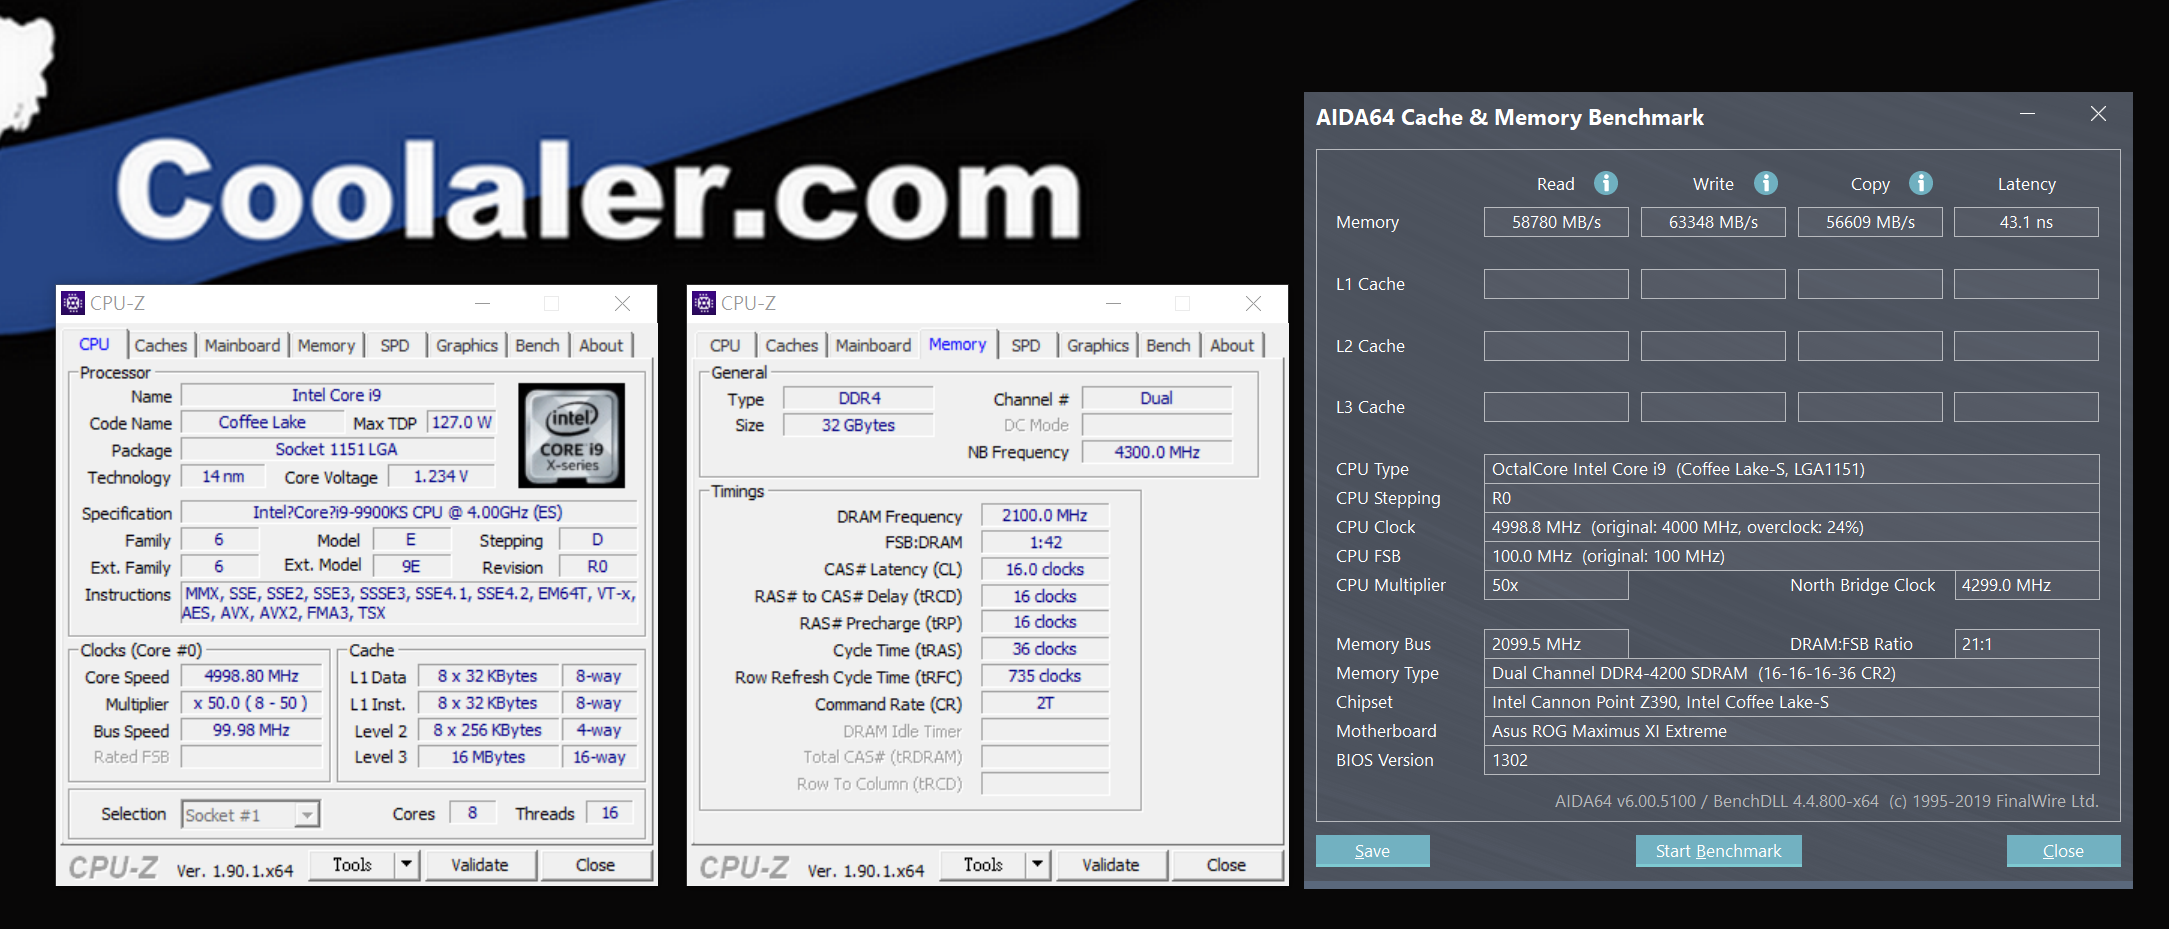
參考對照組 9900KS@Boost
9900KS@Boost & DDR4 4200C16 AIDA64 Cache & Memory Benchmark
Read.58,780Mb/s
Write.63,348Mb/s
Copy.56,609Mb/s
Latency 43.1ns
10900K@Boost Creation Benchmark
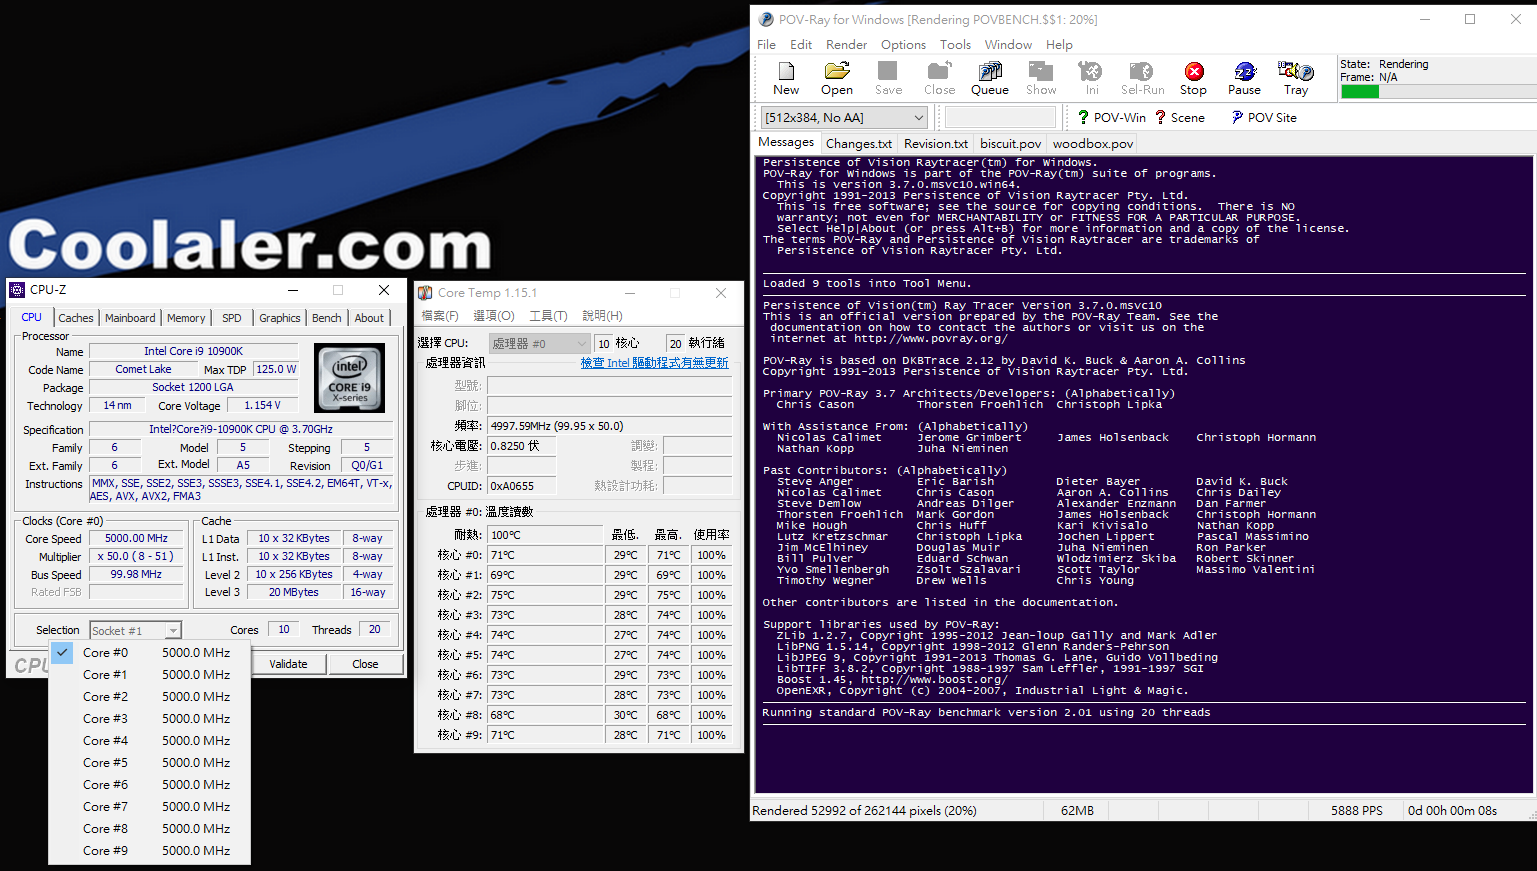
5.POV-Ray Benchmark
POV-Ray全名是 Persistence of Vision Raytracer,是一個使用光線跟蹤繪製三維圖像的開放原始碼自由軟體。運行 POV腳本語言。它是基於 DKBTrace來開發的,DKBTrace是由 David Kirk Buck和 Aaron A. Collins編寫在 Amiga上的。POV-Ray早期也受到了 Polyray raytracer作者 Alexander Enzmann的幫助。很多漂亮的圖片就是由 POV-Ray來製作的

10900K@Boost POV-Ray Benchmark 測試頻率在 All Core 4.9GHz

10900K@Boost POV-Ray Benchmark Results 888.66s

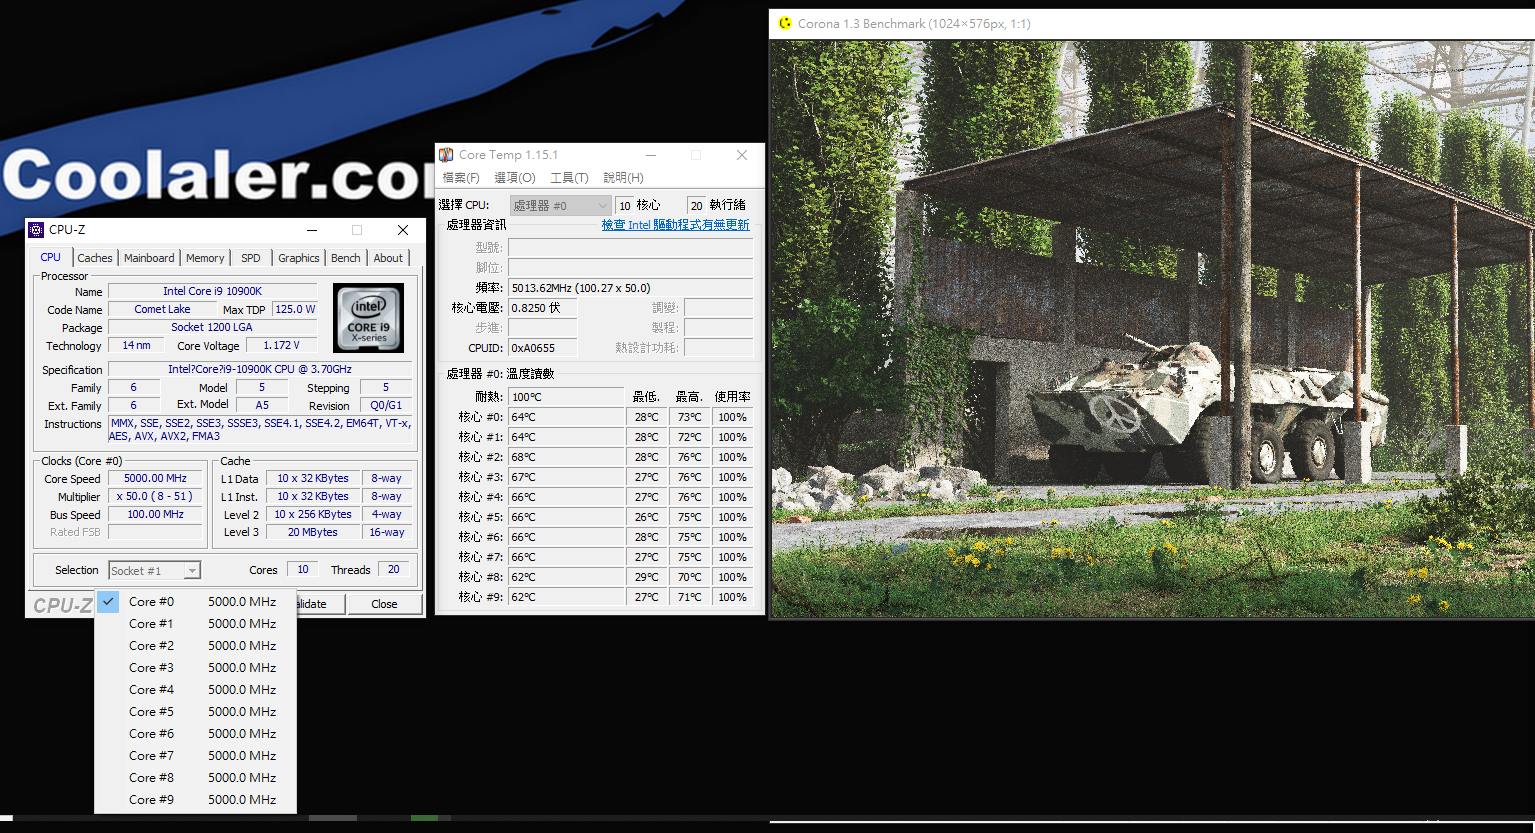
6.Corona Benchmark
Corona是由 Corona Labs Inc.在 2009年中開發的軟件開發套件 ,而 Corona Benchmark則是渲染引擎的測試軟體,它可以構建 iOS ,Android和 Kindle的 2D 移動應用程序,Windows和 OS X的桌面應用程序以及Apple TV,Fire的聯網電視應用程序電視和 Android電視
Corona使用位於 C ++ / OpenGL之上的集成 Lua構建圖形應用程序。 該軟件具有兩種操作模式:Corona Simulator和Corona Native。 使用 Corona Simulator,可以直接從 Corona Simulator構建應用程序。 Corona Native允許您將 Lua代碼和資產集成到 Xcode或 Android Studio項目中,以構建您的應用並包含本機功能

10900K@Boost Corona Benchmark測試頻率在 All Core 4.9GHz

10900K@Boost Corona Benchmark Result 6,466,330rays/s

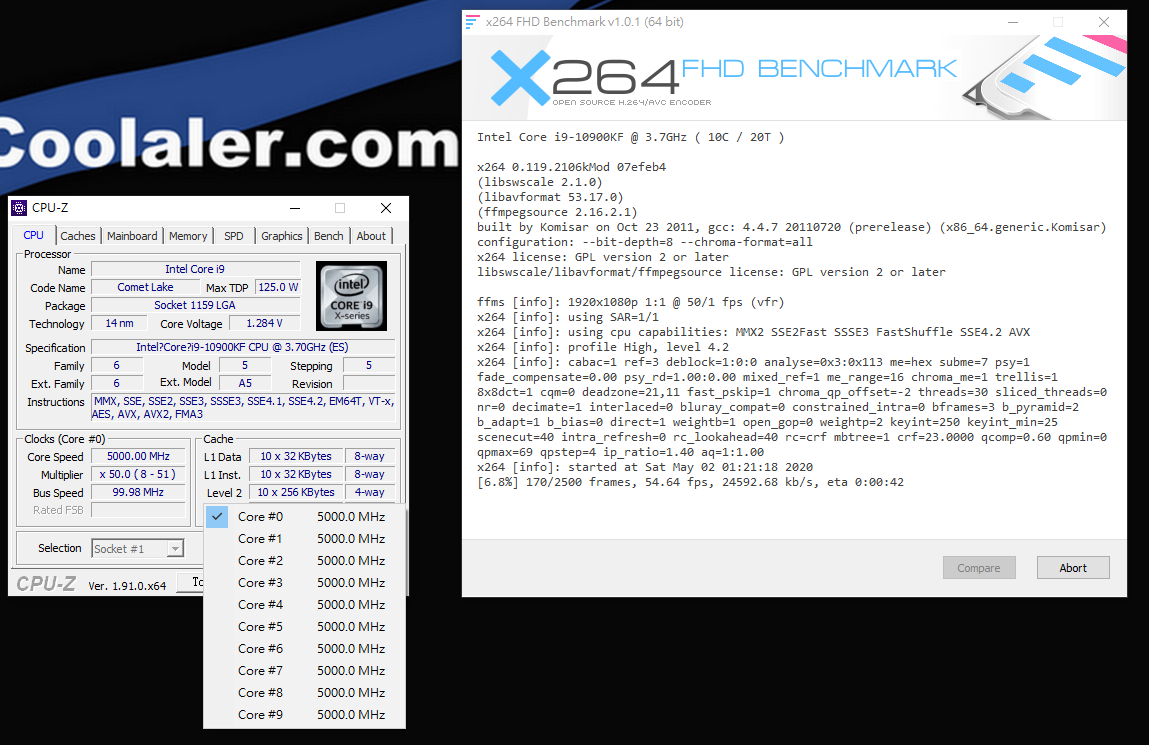
7.X264 FHD Benchmark
X264 FHD Benchmark是一套可以同時測試浮點運算及多媒體的轉檔效能的測試軟體,勉強設定下的處理器頻率與電壓將很難完成測試
10900K@Boost X264 FHD Benchmark測試頻率在 All Core 4.9GHz

10900K@Boost X264 FHD Benchmark Score 67.49fps

8.V-ray Benchmark
V-Ray Benchmark是一款免費的獨立應用程式,可幫助您測試硬件渲染的速度。基準測試包括兩個測試場景:一個用於 V-Ray,另一個用於 V-Ray GPU,具體取決於您要測量的渲染引擎
借助V-Ray Next Benchmark,您可以快速輕鬆地評估運行V-Ray Next的機器性能。了解您的計算機如何與其他人一起排名並了解不同的硬件如何影響您的渲染速度。使用V-Ray Next Benchmark,您可以測試系統的功率和性能,並將組件推向極限

10900K@Boost V-ray Benchmark測試頻率在 All Core 4.9GHz

10900K@Boost V-ray Benchmark 51s

9.WinRAR Benchmark
WinRAR為常用壓縮,支援多線程軟體,內建測試程式,其演算法由作者尤金·羅謝爾研發,享有原創專利
10900K@All Core 5GHz WinRAR測試頻率在 All Core 4.9GHz

10900K@Boost WinRAR 39,826KB/s

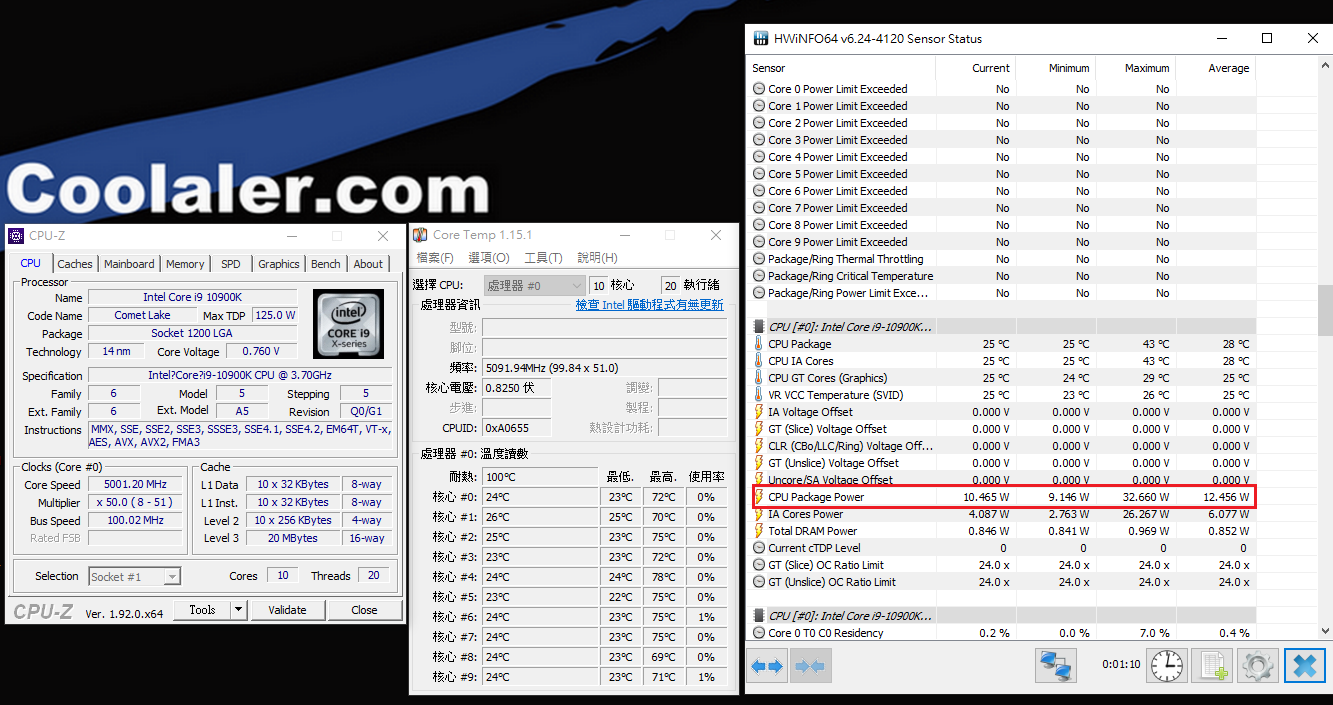
10..CPU Package Power
10900K@default
a.Idle:10.465W
b.Cinebench R20 CPU Test Running: 196.29W
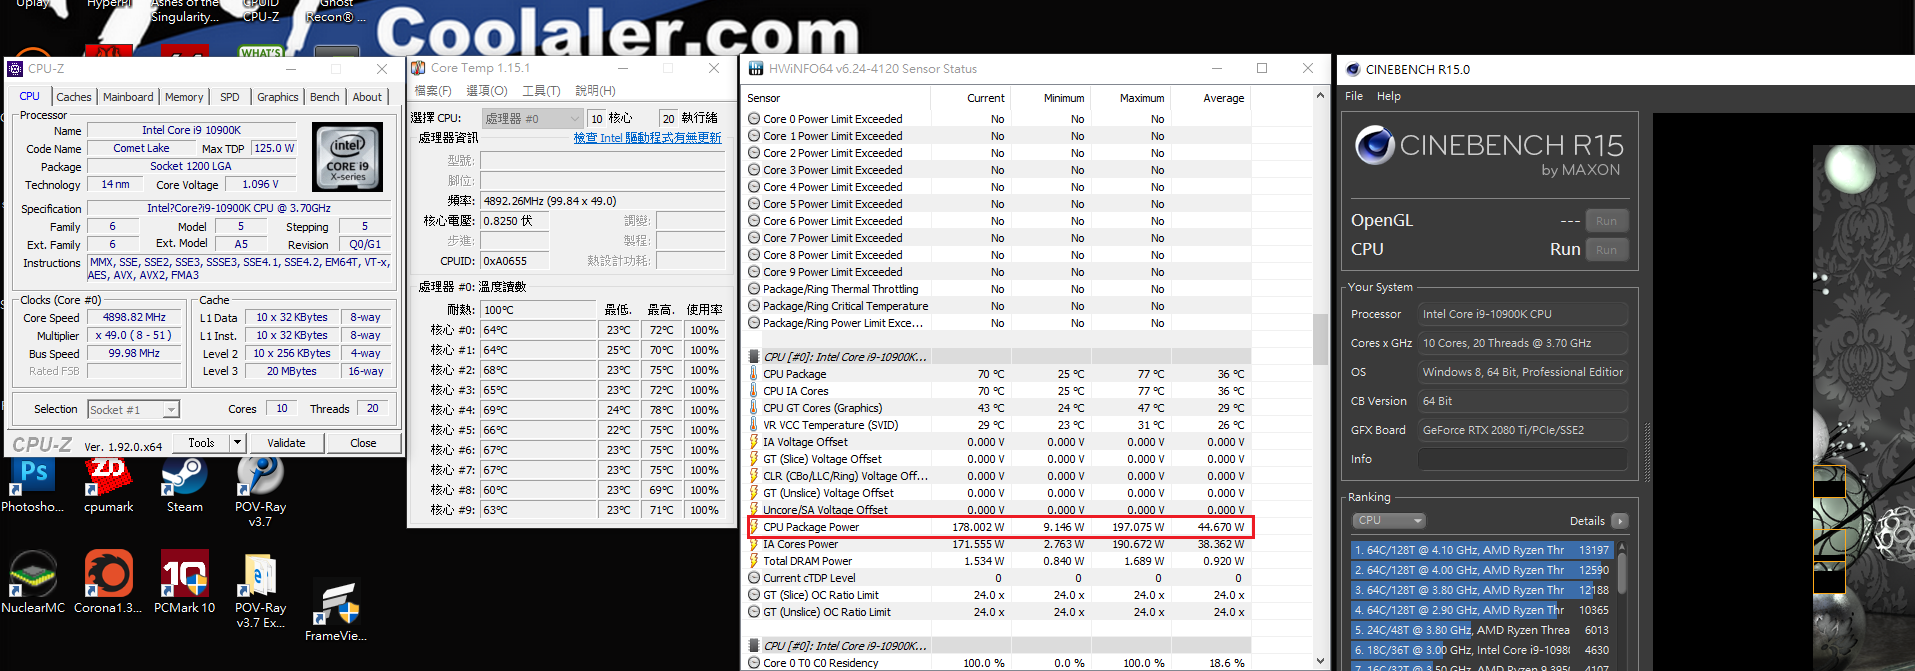
c.Cinebench R25 CPU Test Running: 178.002W
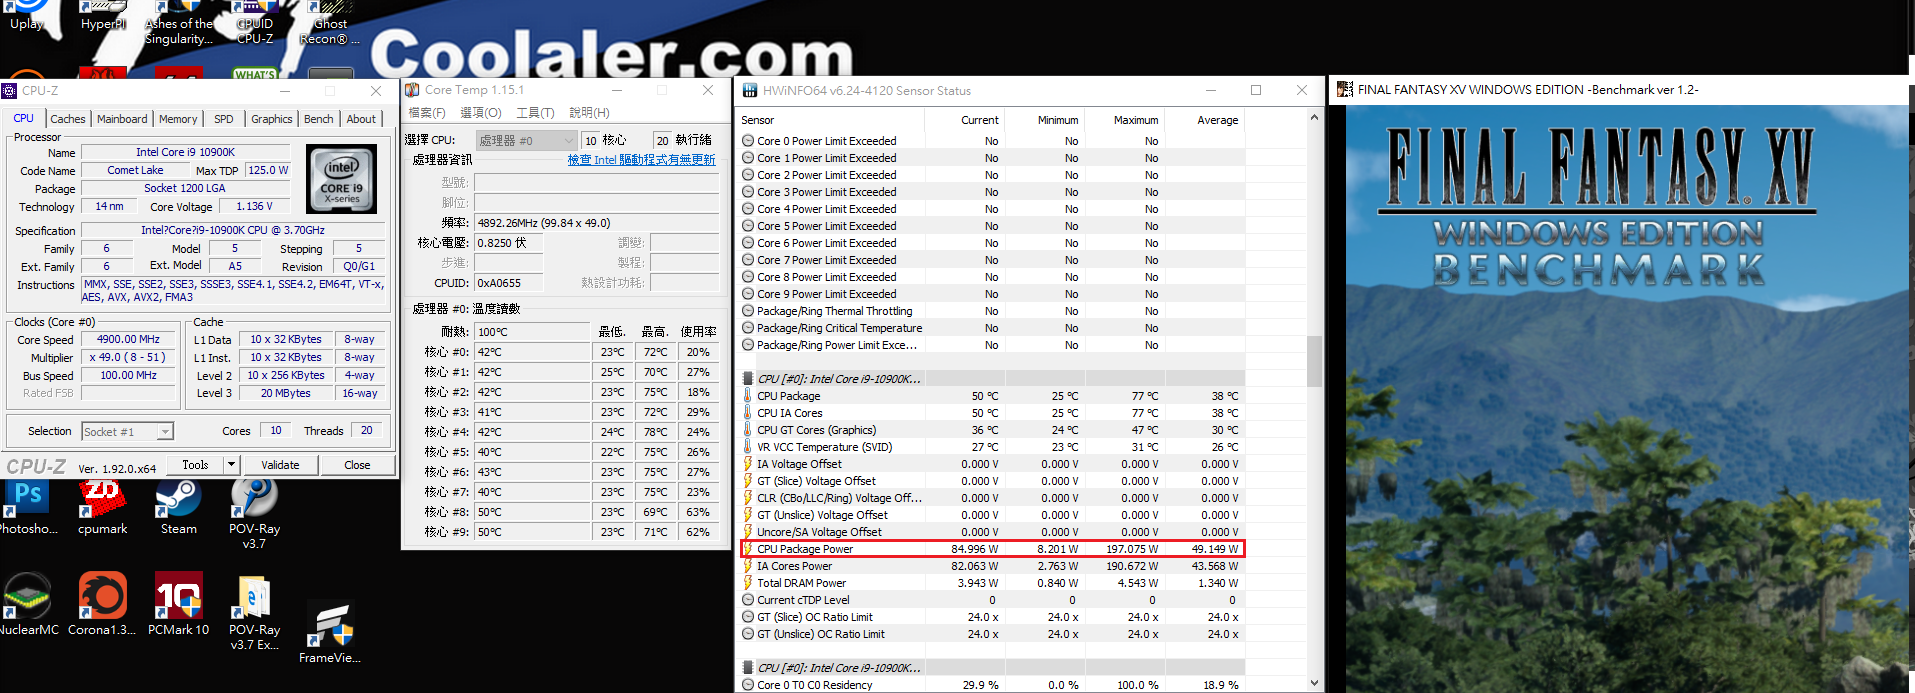
d.Final Fantasy XV Benchmark 4K Running: 84.996W
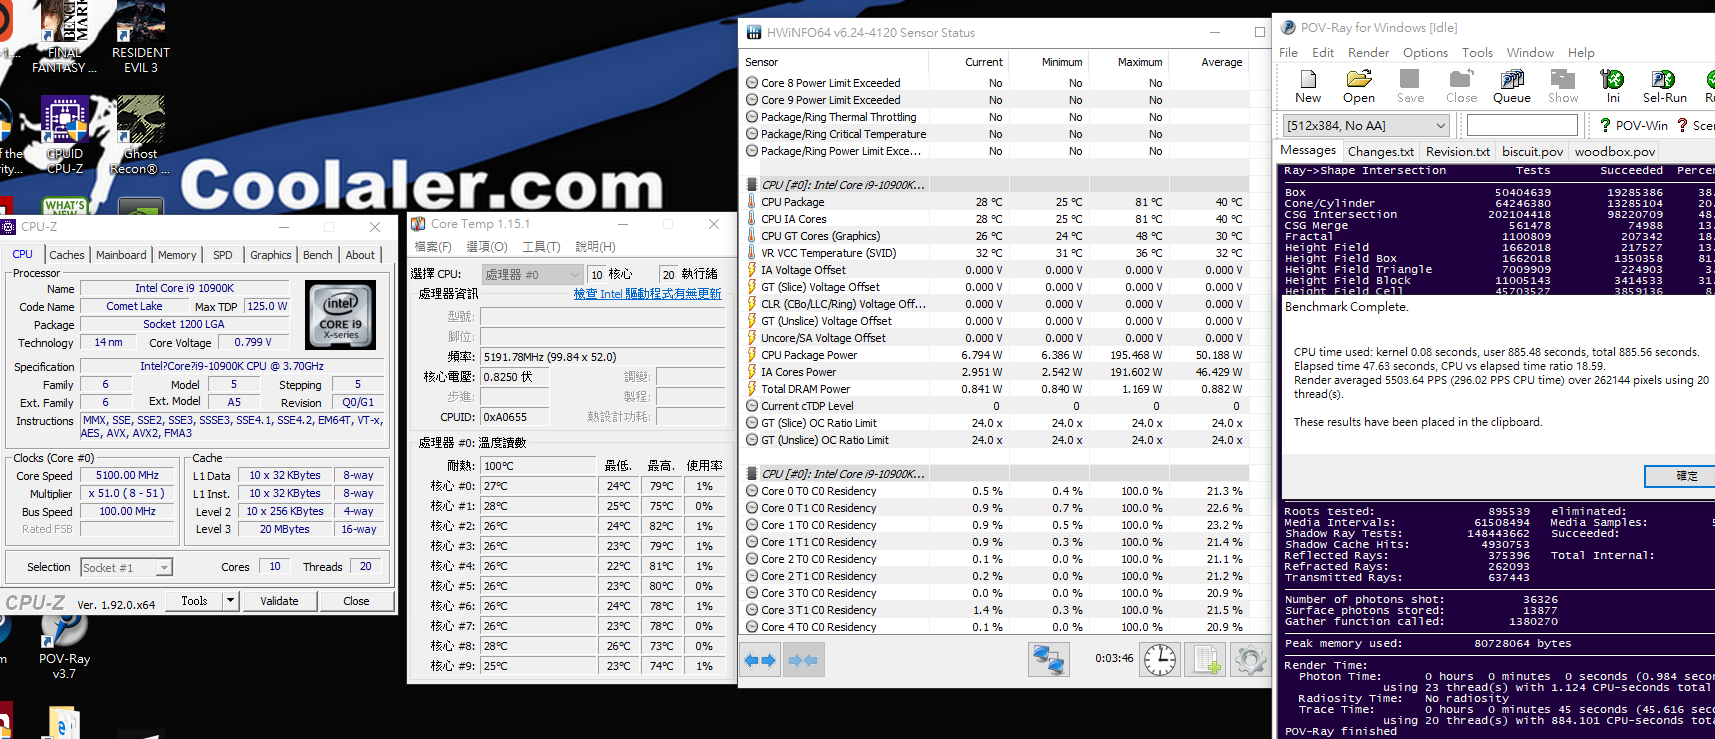
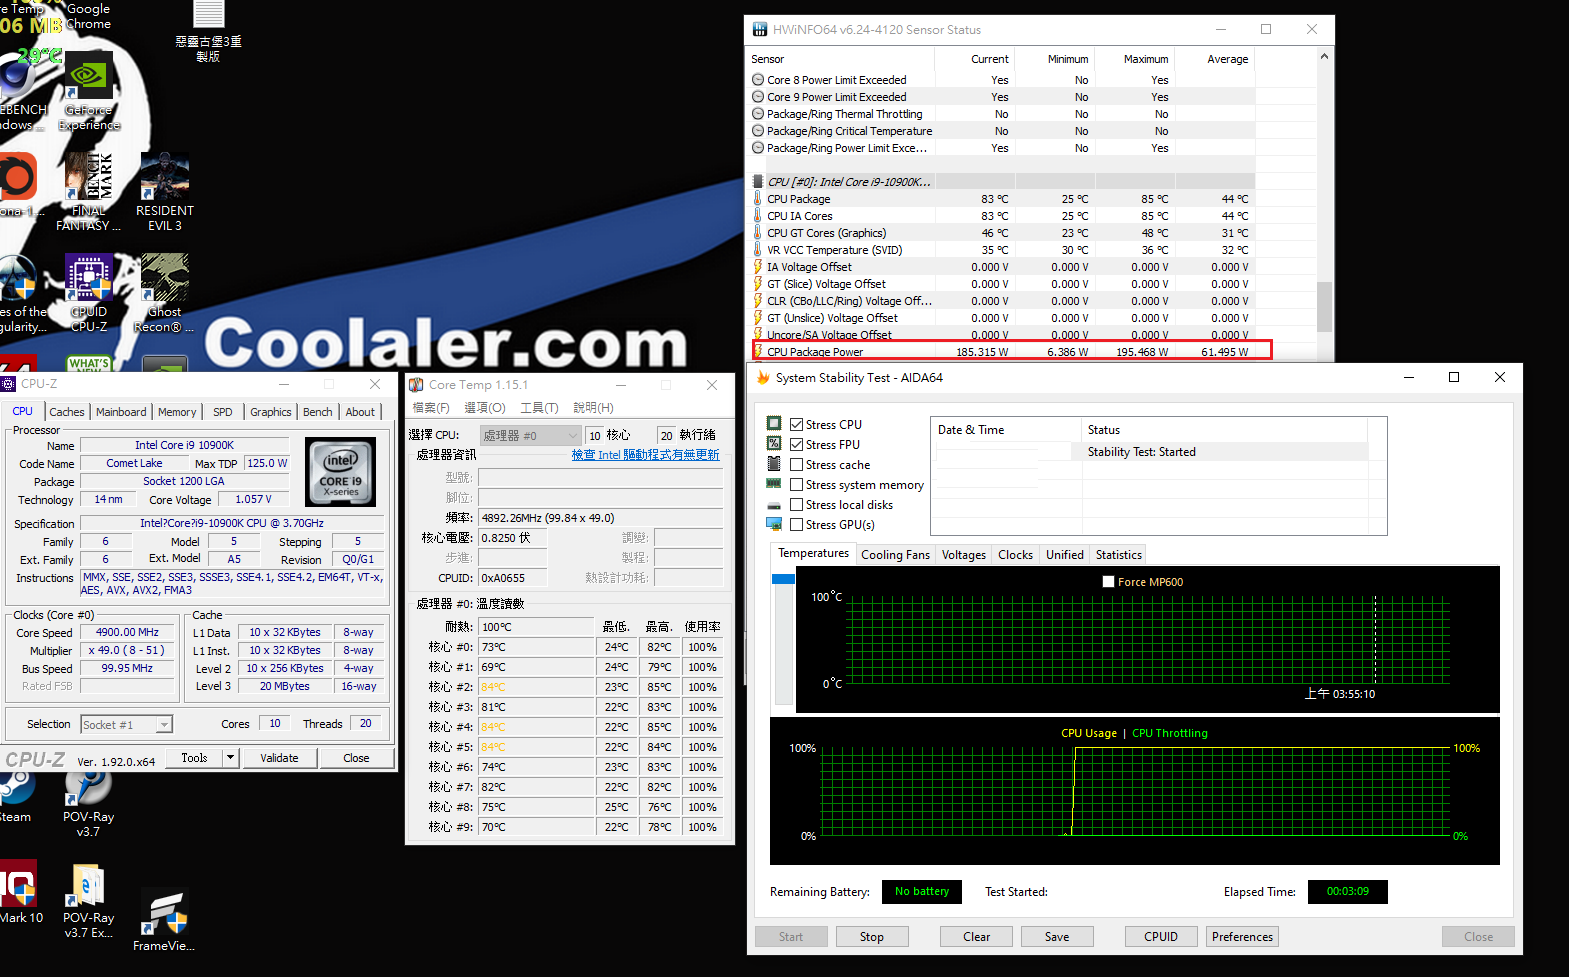
e. POV-Ray Benchmark Running: 195.468W
f. AIDA64 Strees CPU & FPU Test Benchmark Running: 185.35W
B.All Core 5GHz
10900KF@All Core 5GHz CPU-Z
10900K@All Core 5GHz CPU-Z
1.Cinebench R15 & R20 CPU Test
Cinebench是一個真實的跨平台測試套件,用於評估計算機的硬件功能,現有最新版本已至 R20版本,由於它是 以 Cinema 4D動畫製作軟體為基礎進行測試,所以能夠反應出多線程處理器與顯示卡面對實際應用軟體所能發揮的效能,且能在短時間內得知測試結果,是一個能快速得知是否能 All Core 5GHz的測試軟體
Cinebench Release 20的改進反映了近年來 CPU和渲染技術的整體進步,為 Cinema 4D利用多個 CPU核心和普通用戶可用的現代處理器功能提供了更準確的測量,最重要的是它是免費的
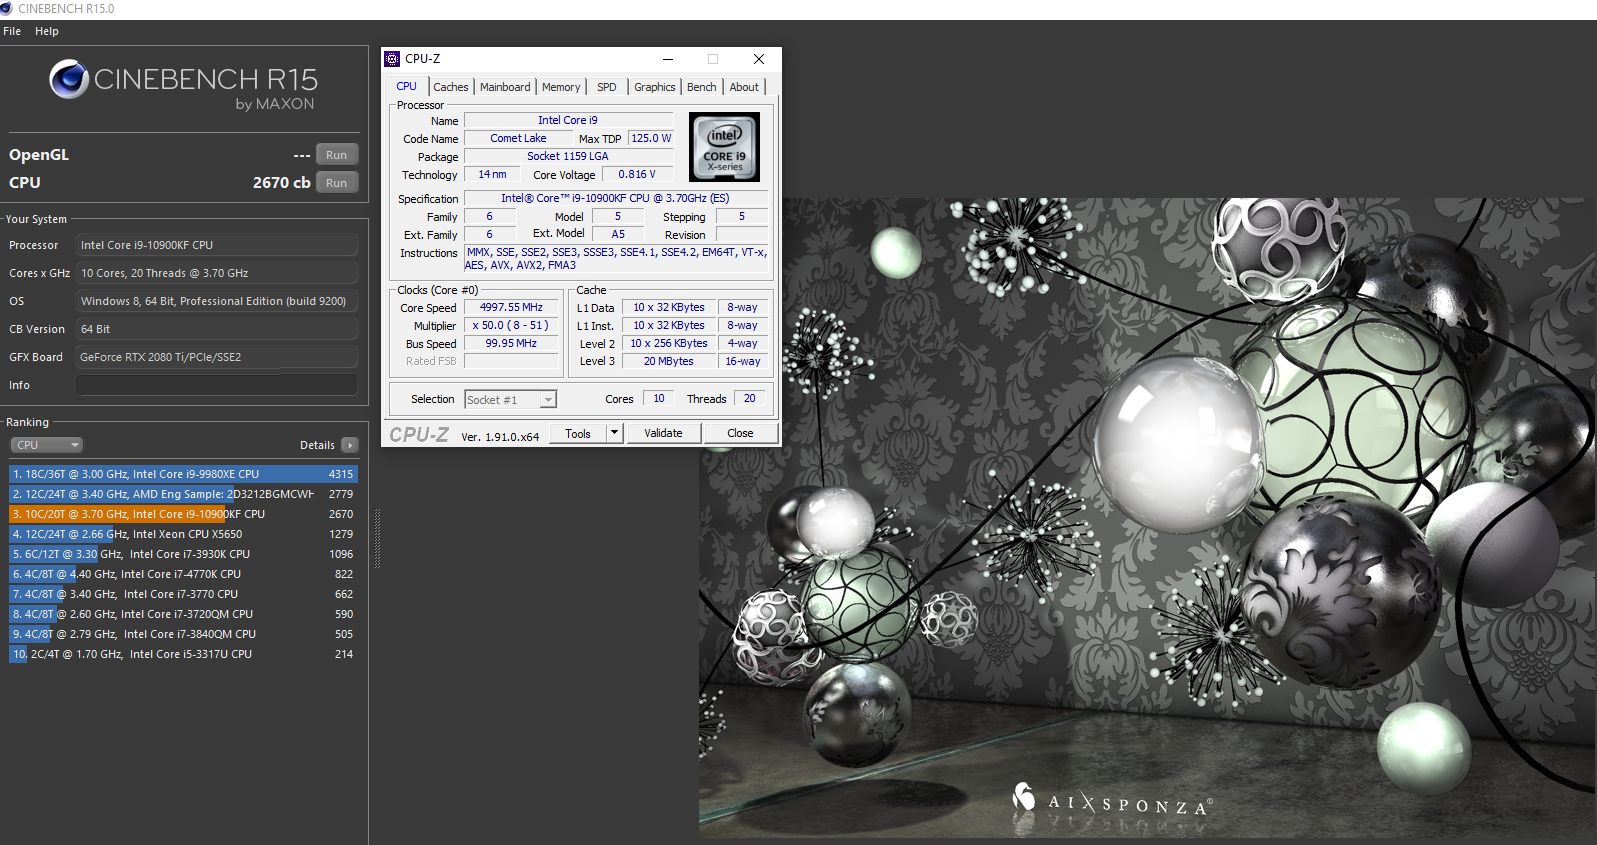
10900KF@All Core 5GHz Cinebench R15 CPU Test測試不掉頻 測試中電壓為 1.308V,溫度最高 71度
Cinebench R15 CPU test Results
10900KF@All Core 5GHz Cinebench R15 CPU Test測試 2670cb
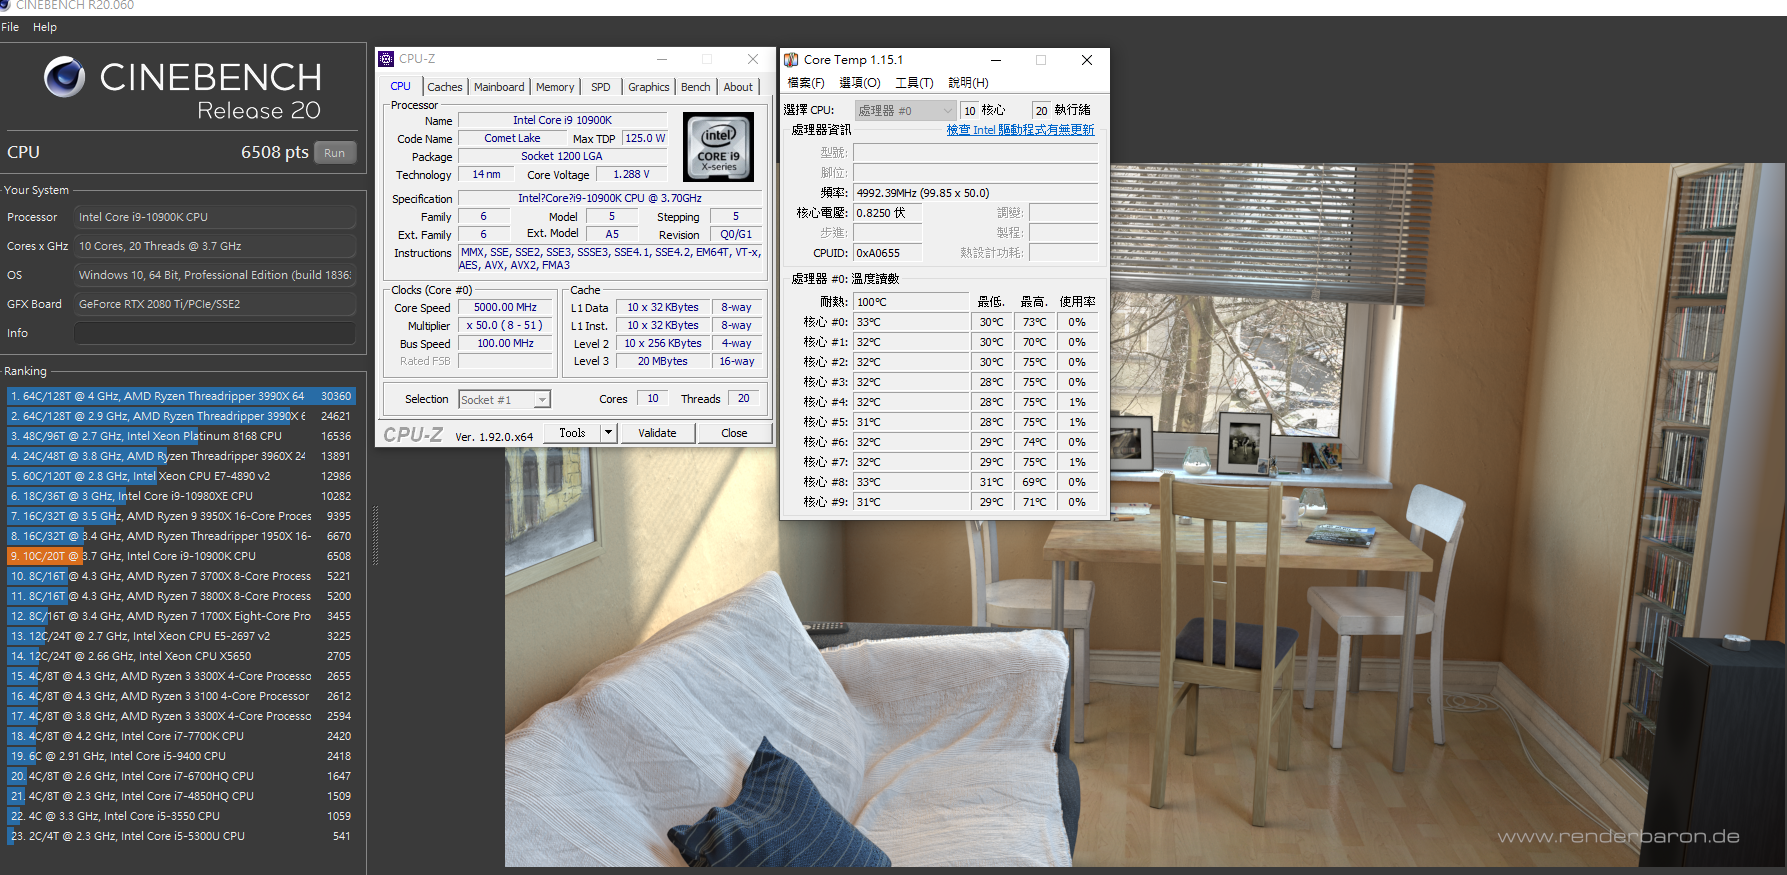
Cinebench R20 CPU test Results
Cinebench R20 CPU Test
10900K@All Core 5GHz Cinebench R20 CPU Test測試不掉頻 測試中電壓為 1.154V,測試溫度最高 75度

10900K@All Core 5GHz Cinebench R20 CPU Test測試 6508pts
2.wPrime 2.10 1024M Benchmark
wPrime是一款多線程浮點運算測試軟體,有 32M及 1024M兩種,設定在 1024M之測試對穩定度的要求更高,在多線程處理器上比開啟多個 Super Pi測試更方便精確
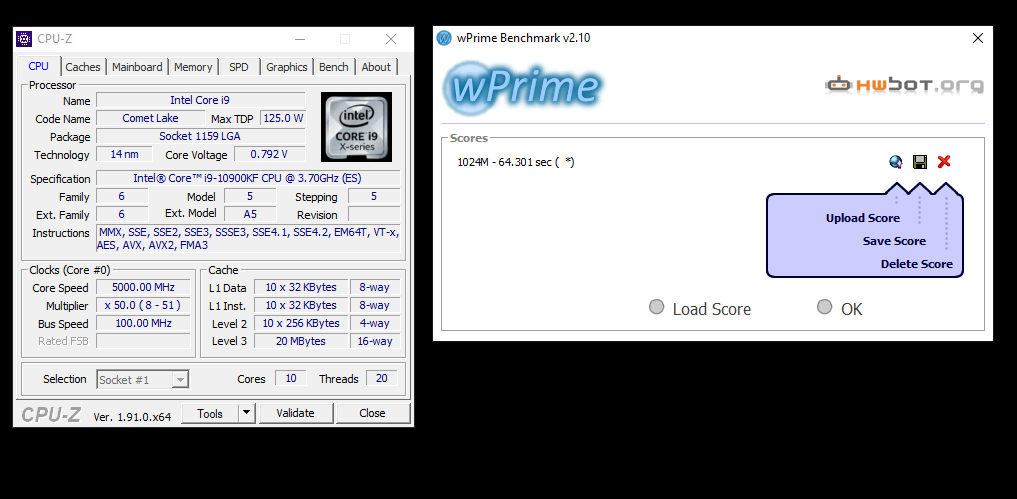
wPrime 2.10 1024M Results
10900KF@All Core 5GHz wPrime 2.10 1024M測試不掉頻 測試中電壓為 1.332V,
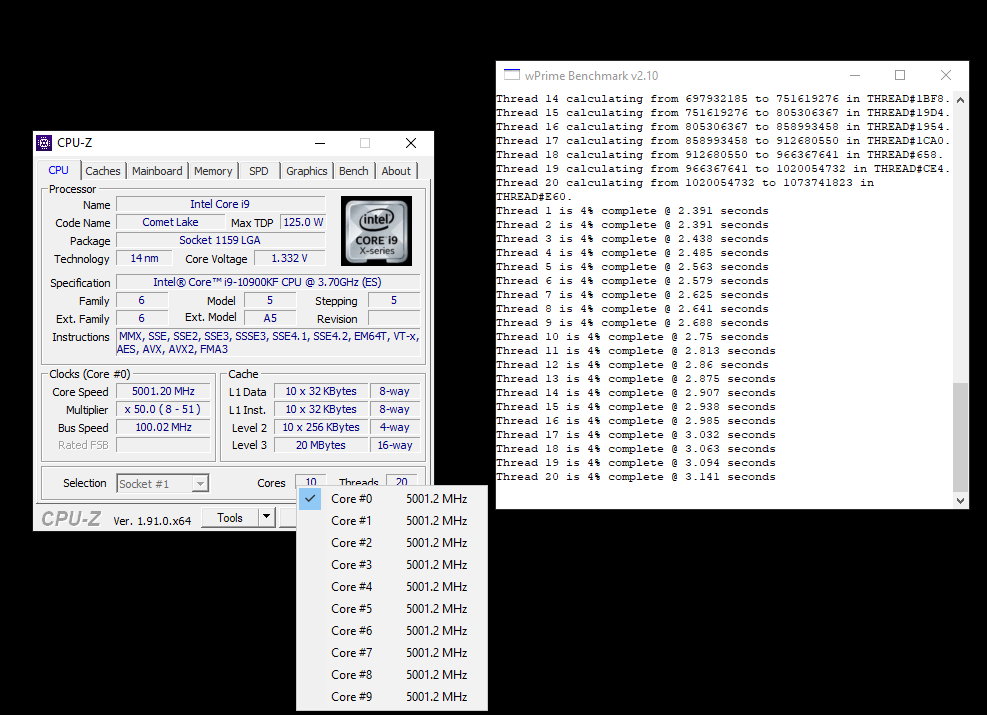
10900KF@All Core 5GHz wPrime 2.10 1024M測試 64.301s
3.CPU-Z Bench
CPU-Z為一個中央處理器、記憶體及主機板資訊的 Windows軟體,在近年新增了 Bench item,提供處理器的快速簡單測試
CPU-Z Bench Results
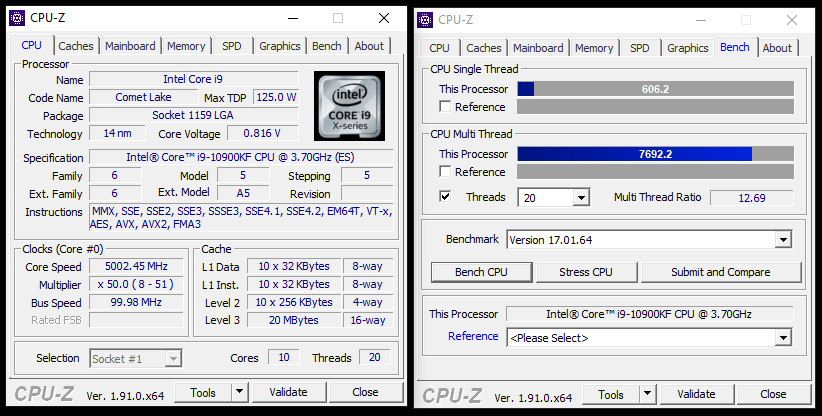
10900KF@All Core 5GHz CPU-Z Bench測試中全程不掉頻 測試中電壓為 1.248V
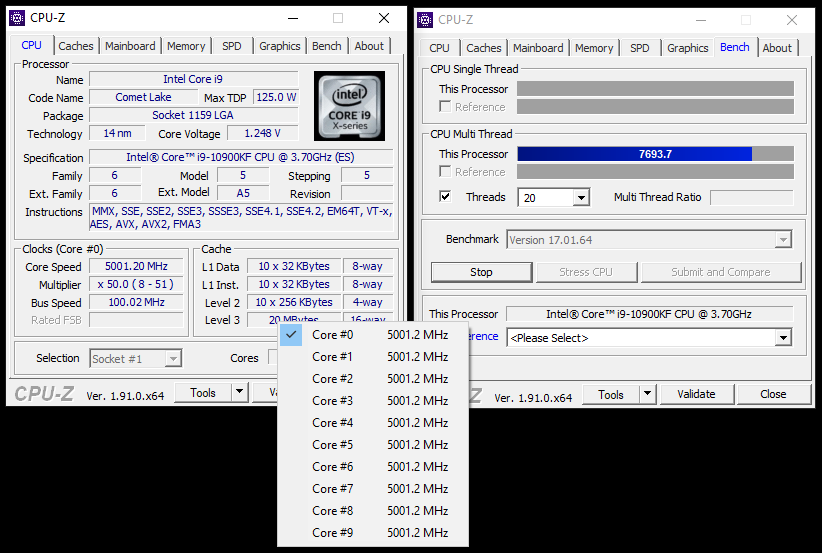
10900KF@All Core 5GHz CPU-Z Bench Single Thread 606.2 Multi Thread 7692.2
4.AIDA64 Cache & Memory Benchmark
AIDA64 Cache & Memory Benchmark可測量 CPU高速緩存和系統內存的帶寬和延遲。通過雙擊窗口中的任何矩形,列或行,我們可以單獨啟動基準測試或基準測試類型。例如,如果我們雙擊 “Memory”,則只會運行系統內存讀取,寫入,複製和延遲基準測試,即只執行給定行中的操作。同樣,如果我們雙擊 “Read”,則只會對所有內存類型運行讀取基準測試,即只執行給定列中的操作。如果我們雙擊任何矩形,則只會運行選定的單個基準
右鍵單擊 “Start Benchmark”按鈕將打開一個上下文菜單,我們可以在其中選擇運行所有基準測試或僅運行內存或緩存基準測試
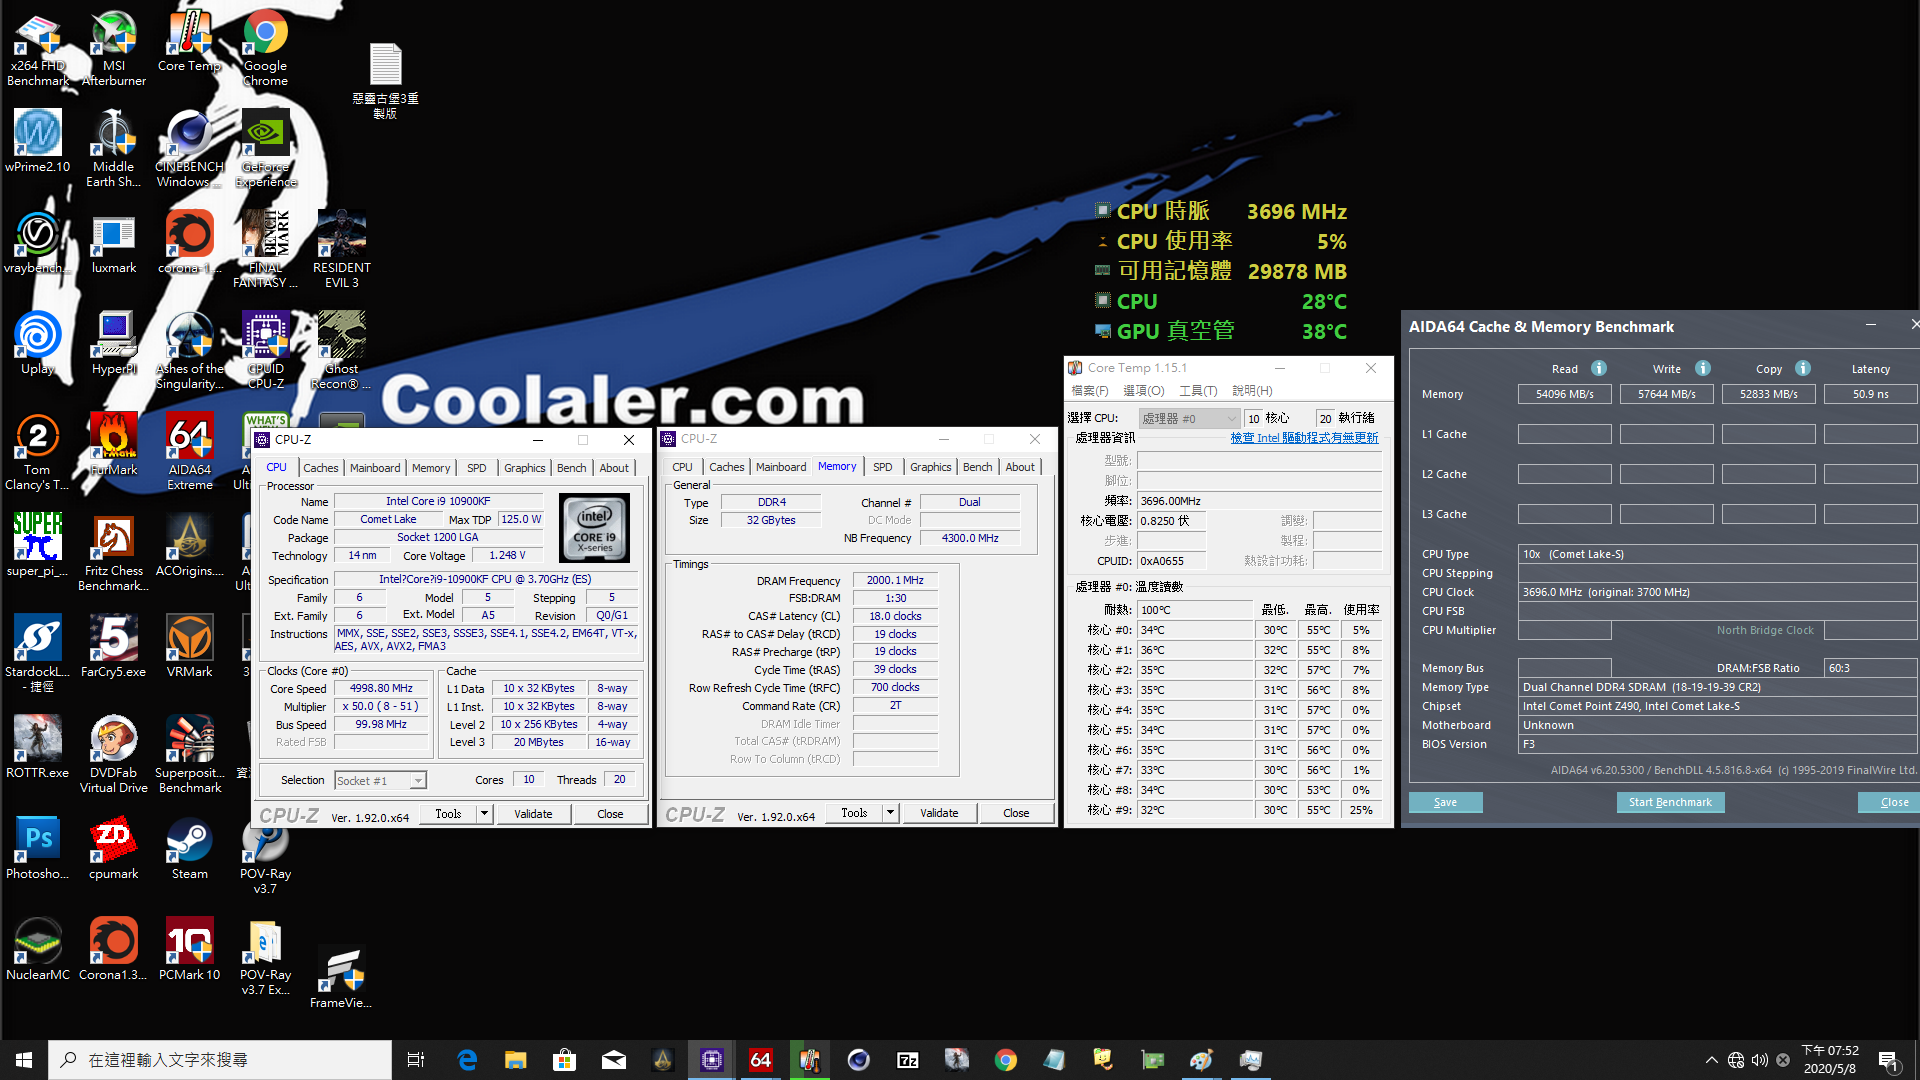
10900KF@All Core 5GHz& DDR4 4000C18 AIDA64 Cache & Memory Benchmark測試中不掉頻
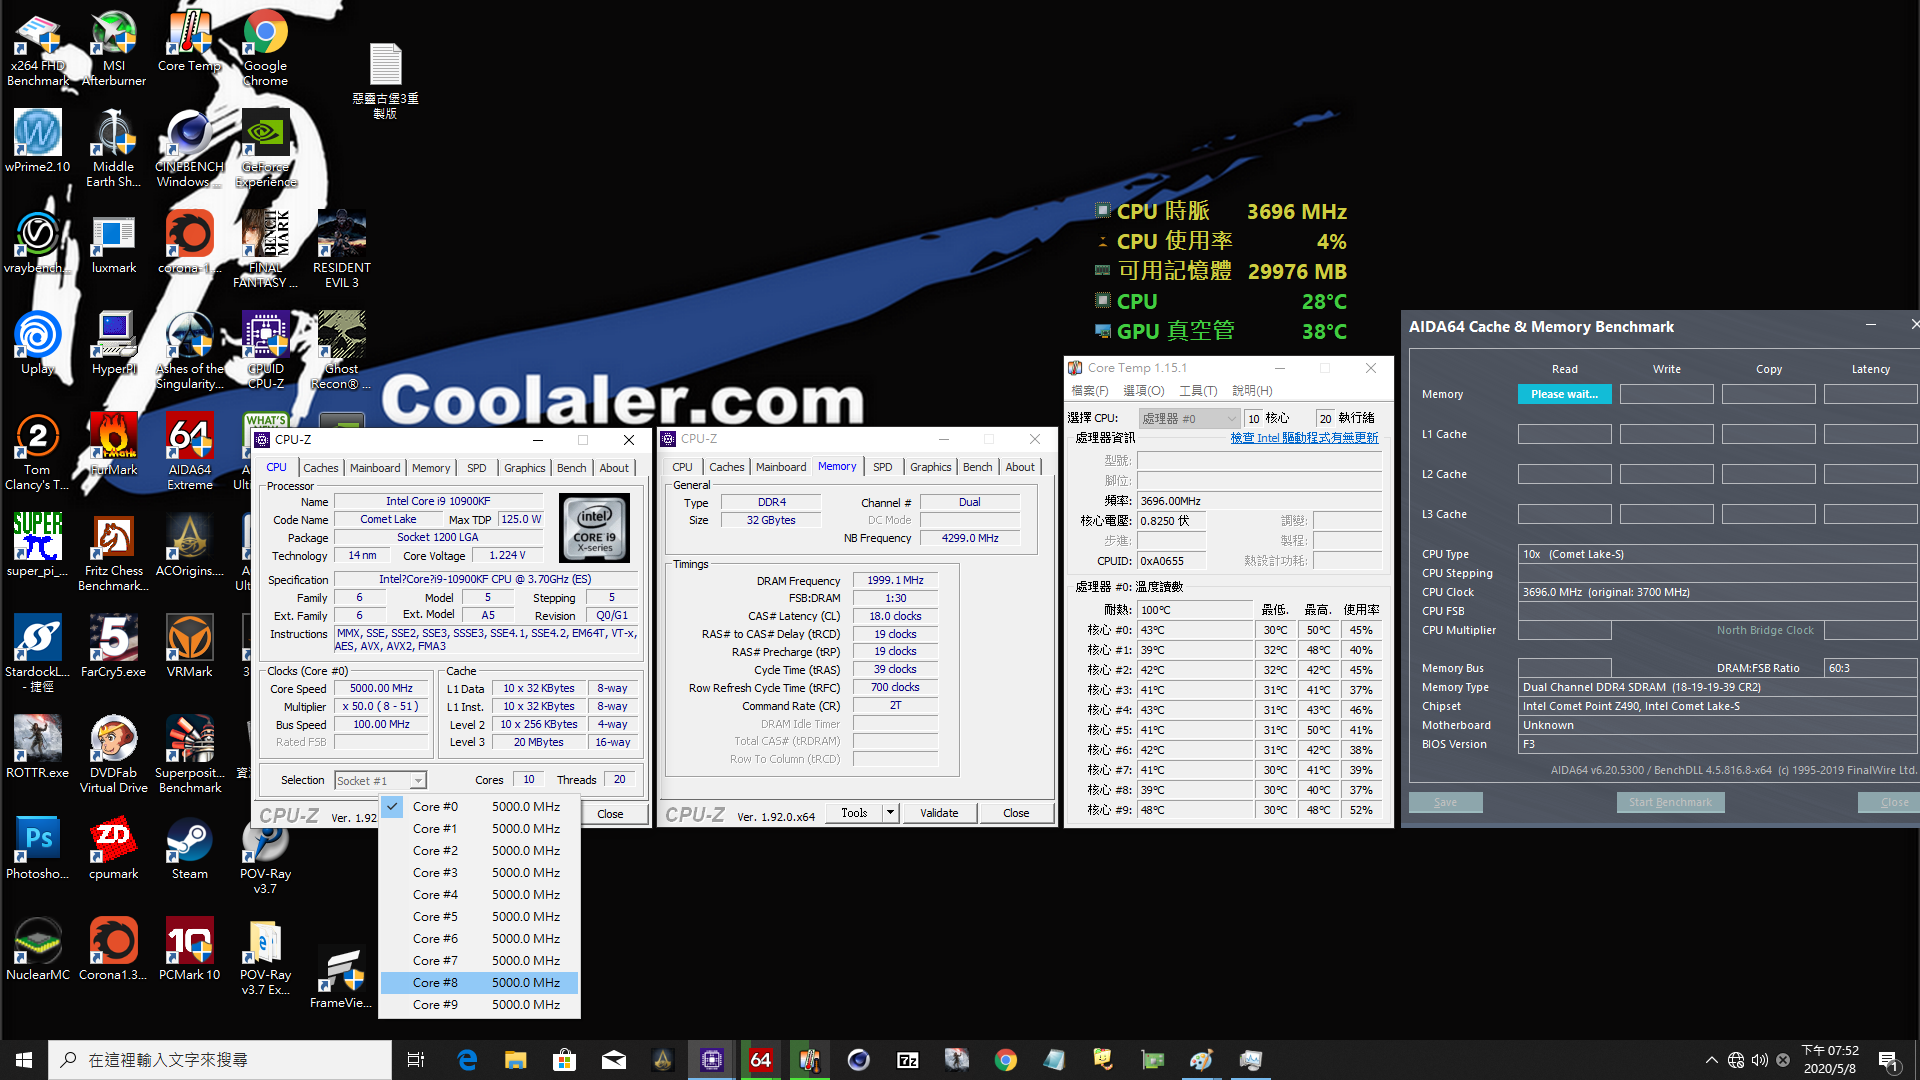
10900KF@All Core 5GHz & DDR4 4000C18 AIDA64 Cache & Memory Benchmark
Read.54.096MB/s
Write.57.644MB/s
Copy.52.833MB/s
Latency 50.9ns
Creation Benchmark
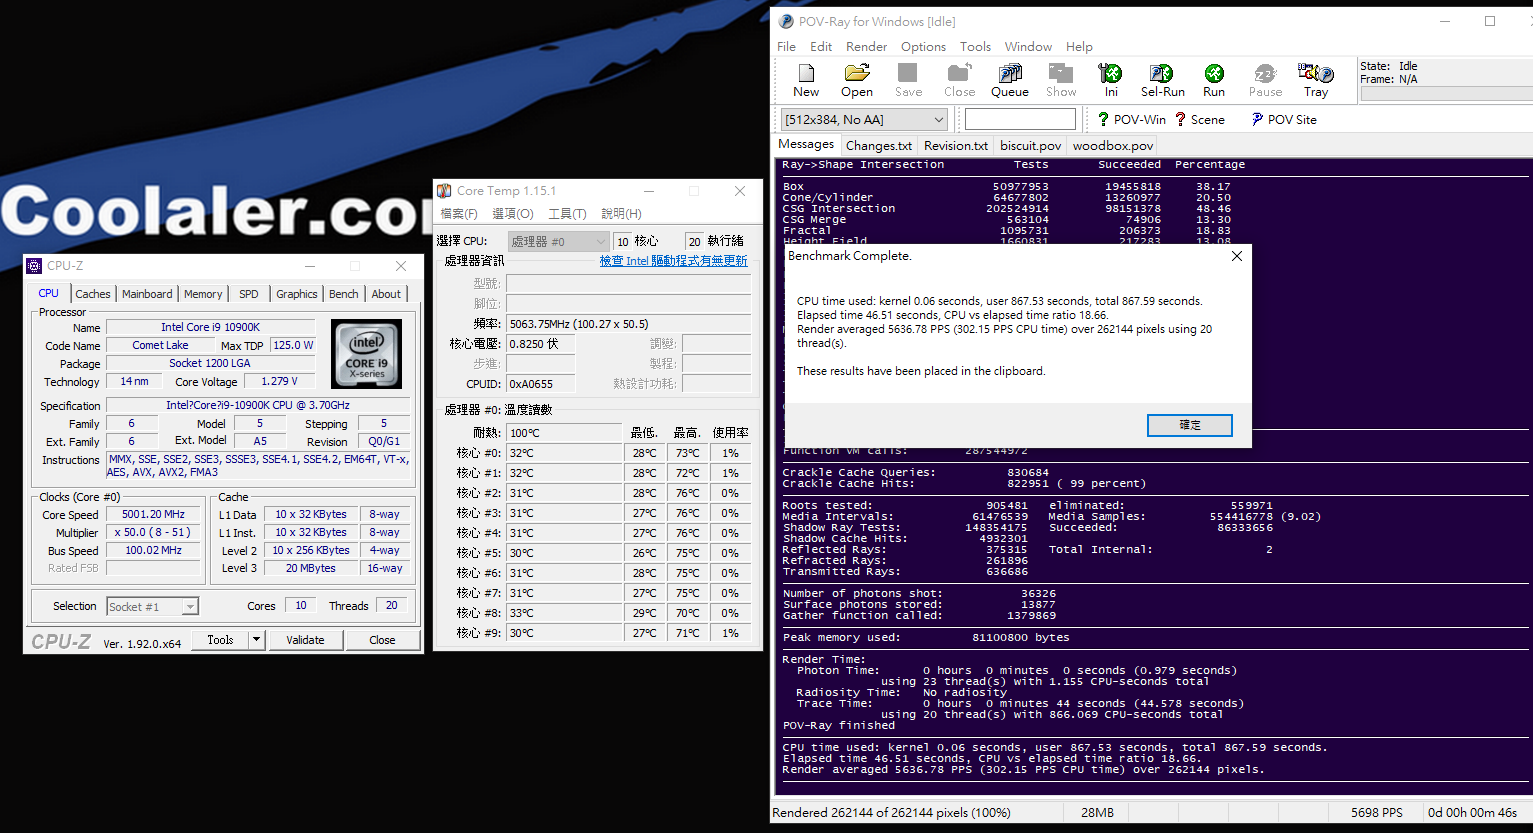
5.POV-Ray Benchmark
POV-Ray全名是 Persistence of Vision Raytracer,是一個使用光線跟蹤繪製三維圖像的開放原始碼自由軟體。運行 POV腳本語言。它是基於 DKBTrace來開發的,DKBTrace是由 David Kirk Buck和 Aaron A. Collins編寫在 Amiga上的。POV-Ray早期也受到了 Polyray raytracer作者 Alexander Enzmann的幫助。很多漂亮的圖片就是由 POV-Ray來製作的
10900K@All Core 5GHz POV-Ray Benchmark 測試不掉頻
10900K@All Core 5GHz POV-Ray Benchmark Results 867.59s
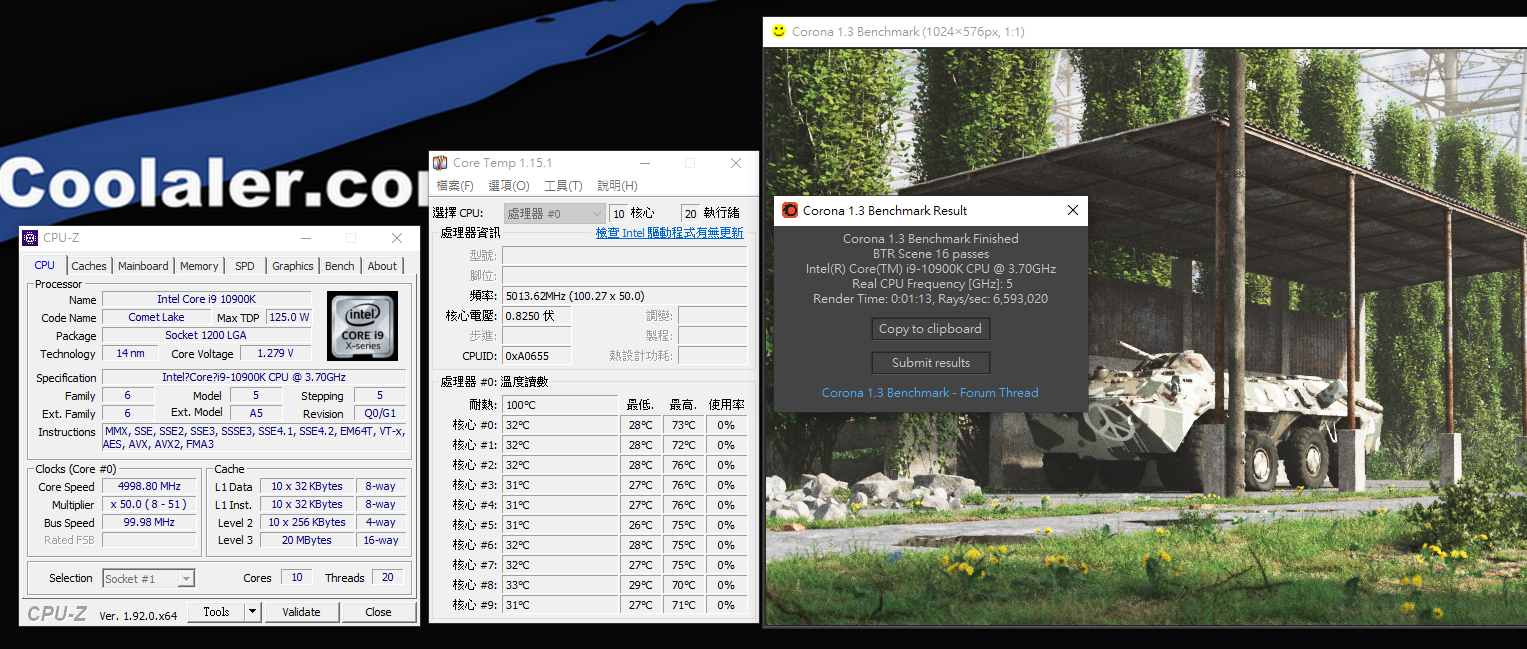
6.Corona Benchmark
Corona是由 Corona Labs Inc.在 2009年中開發的軟件開發套件 ,而 Corona Benchmark則是渲染引擎的測試軟體,它可以構建 iOS ,Android和 Kindle的 2D 移動應用程序,Windows和 OS X的桌面應用程序以及Apple TV,Fire的聯網電視應用程序電視和 Android電視
Corona使用位於 C ++ / OpenGL之上的集成 Lua構建圖形應用程序。 該軟件具有兩種操作模式:Corona Simulator和Corona Native。 使用 Corona Simulator,可以直接從 Corona Simulator構建應用程序。 Corona Native允許您將 Lua代碼和資產集成到 Xcode或 Android Studio項目中,以構建您的應用並包含本機功能
10900KF@All Core 5GHz Corona Benchmark測試不掉頻
10900KF@All Core 5GHz Corona Benchmark Result 6,593,020rays/s
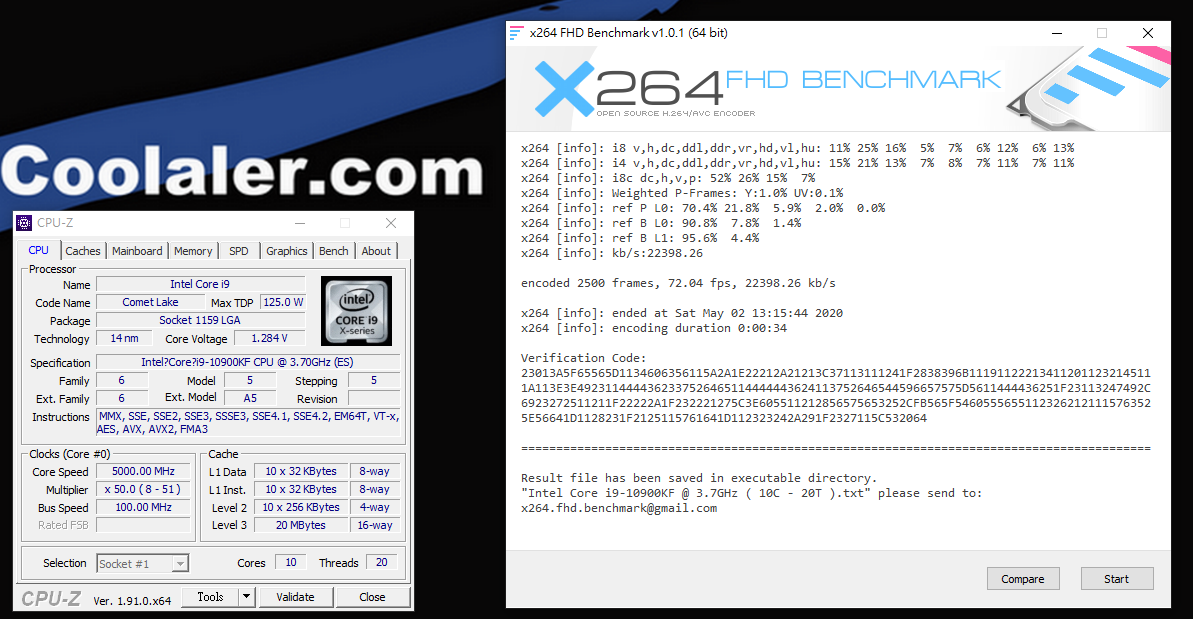
7.X264 FHD Benchmark
X264 FHD Benchmark是一套可以同時測試浮點運算及多媒體的轉檔效能的測試軟體,勉強設定下的處理器頻率與電壓將很難完成測試
10900KF@All Core 5GHz X264 FHD Benchmark測試不掉頻
10900KF@All Core 5GHz X264 FHD Benchmark Score 72.04fps
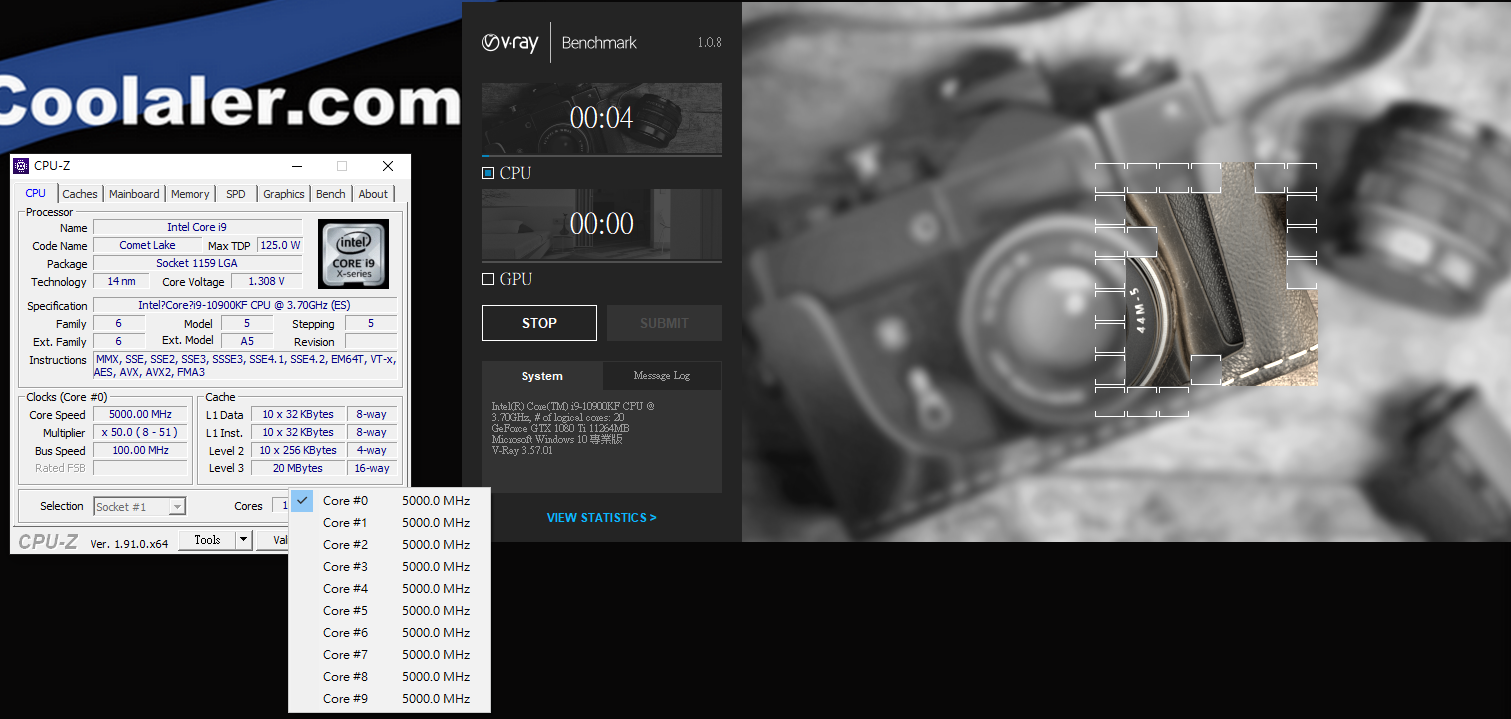
8.V-ray Benchmark
V-Ray Benchmark是一款免費的獨立應用程式,可幫助您測試硬件渲染的速度。基準測試包括兩個測試場景:一個用於 V-Ray,另一個用於 V-Ray GPU,具體取決於您要測量的渲染引擎
借助V-Ray Next Benchmark,您可以快速輕鬆地評估運行V-Ray Next的機器性能。了解您的計算機如何與其他人一起排名並了解不同的硬件如何影響您的渲染速度。使用V-Ray Next Benchmark,您可以測試系統的功率和性能,並將組件推向極限
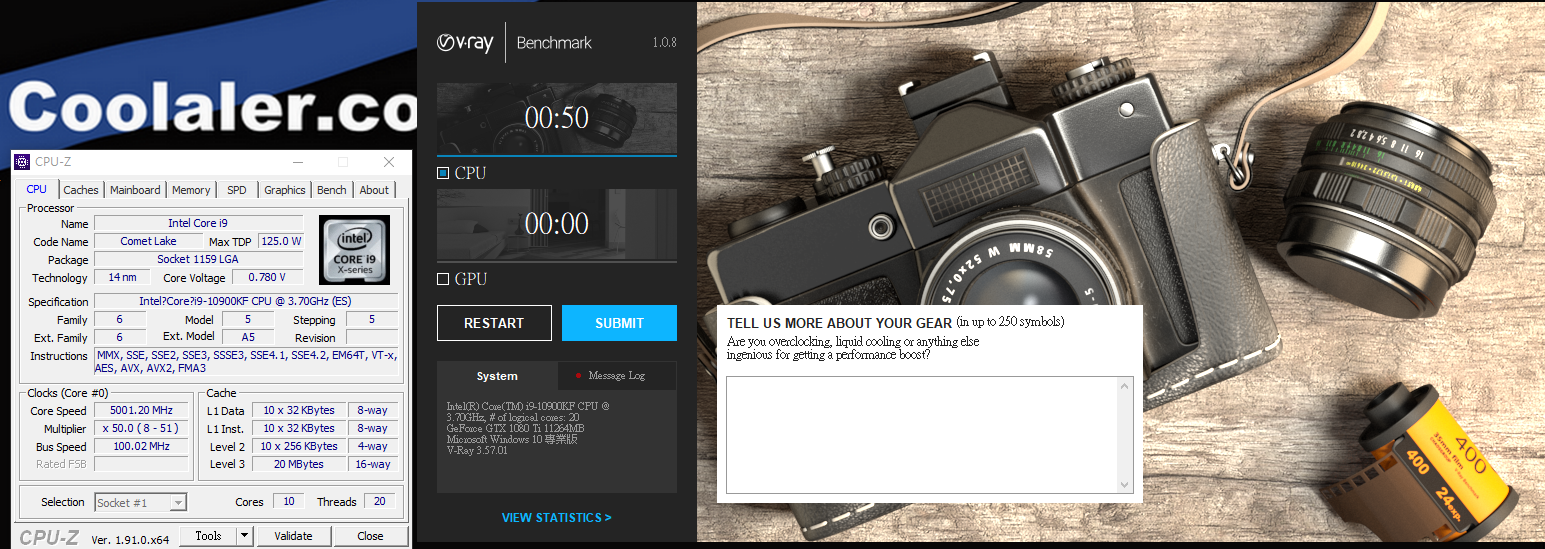
10900KF@All Core 5GHz V-ray Benchmark測試不掉頻
10900KF@All Core 5GHz V-ray Benchmark 50s
9.WinRAR Benchmark
WinRAR為常用壓縮,支援多線程軟體,內建測試程式,其演算法由作者尤金·羅謝爾研發,享有原創專利
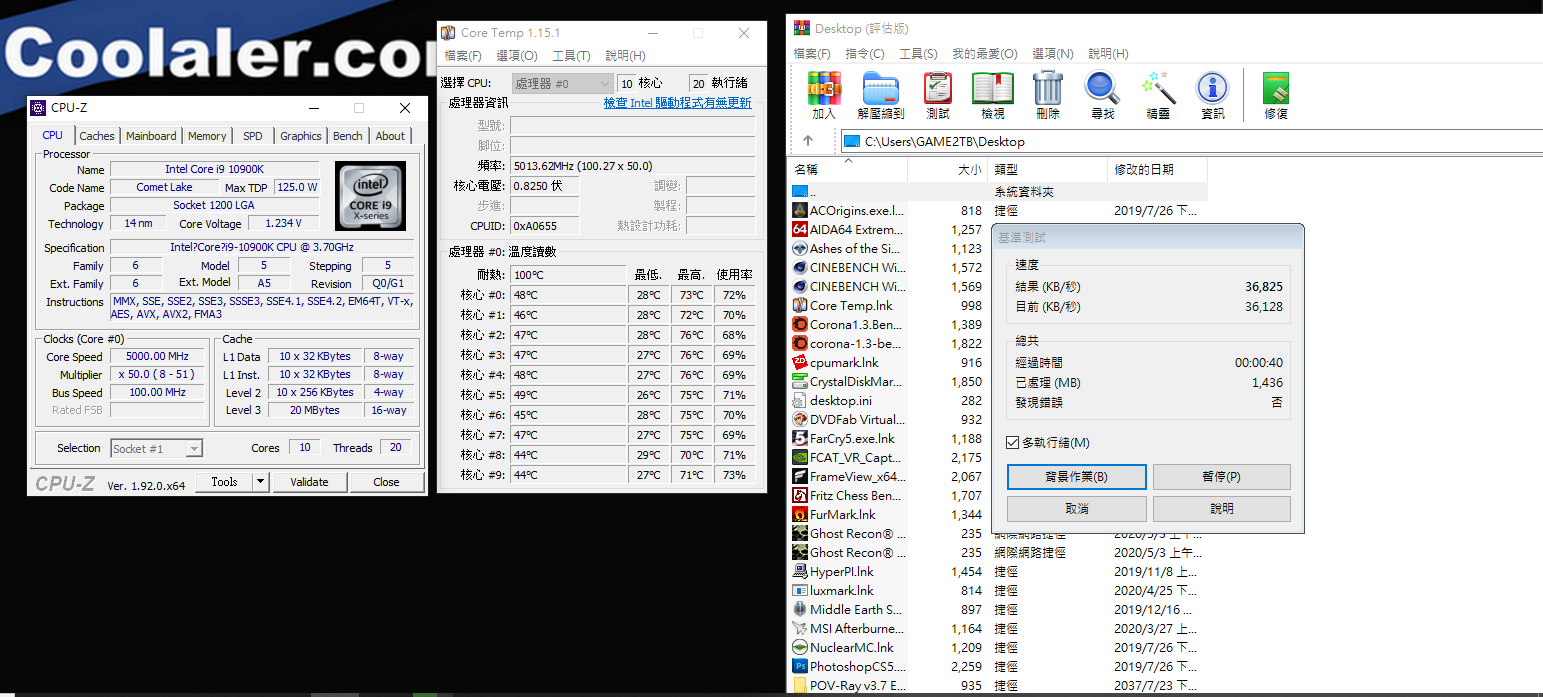
10900K@All Core 5GHz WinRAR測試不掉頻
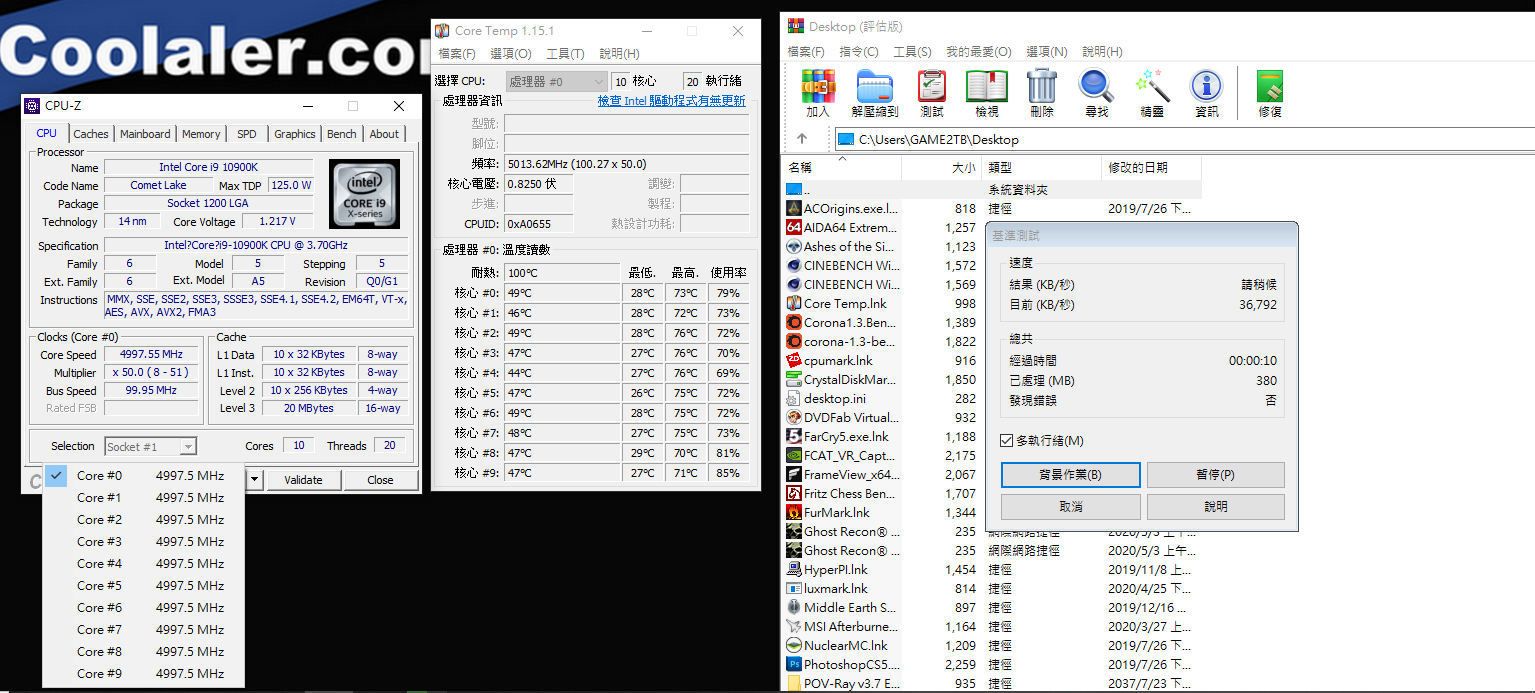
10900K@All Core 5GHz WinRAR 36,825KB/s
10.CPU Package Power
10900K@All Core 5GHz
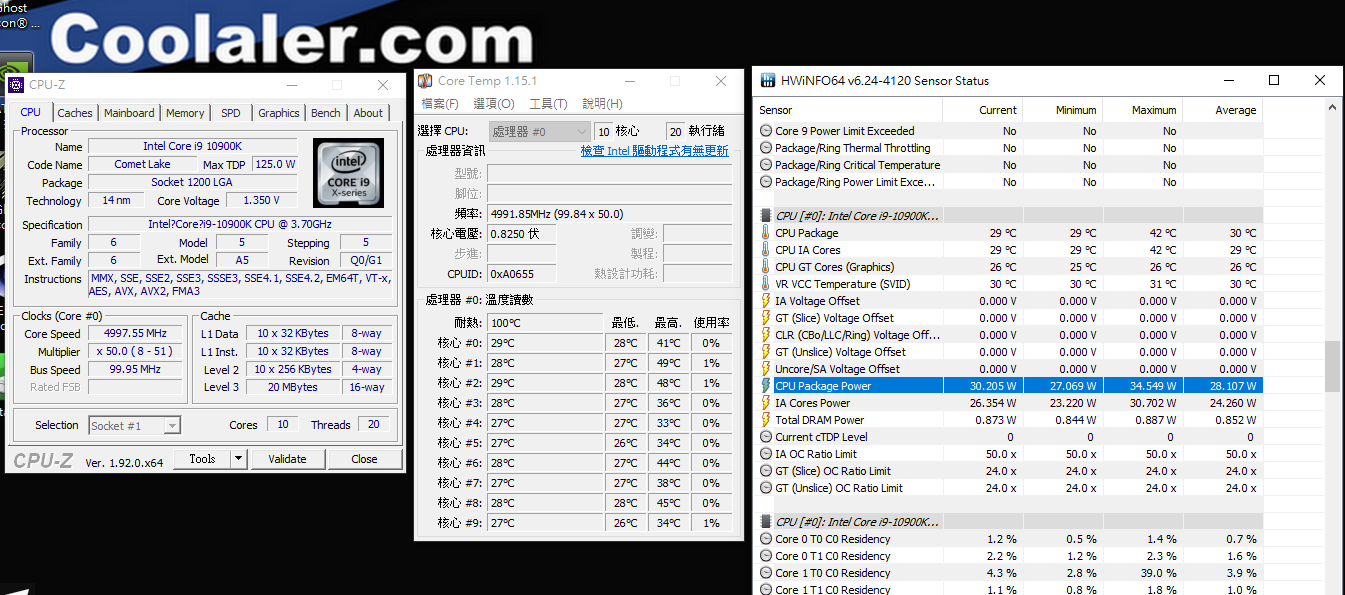
a.Idle:30.205W
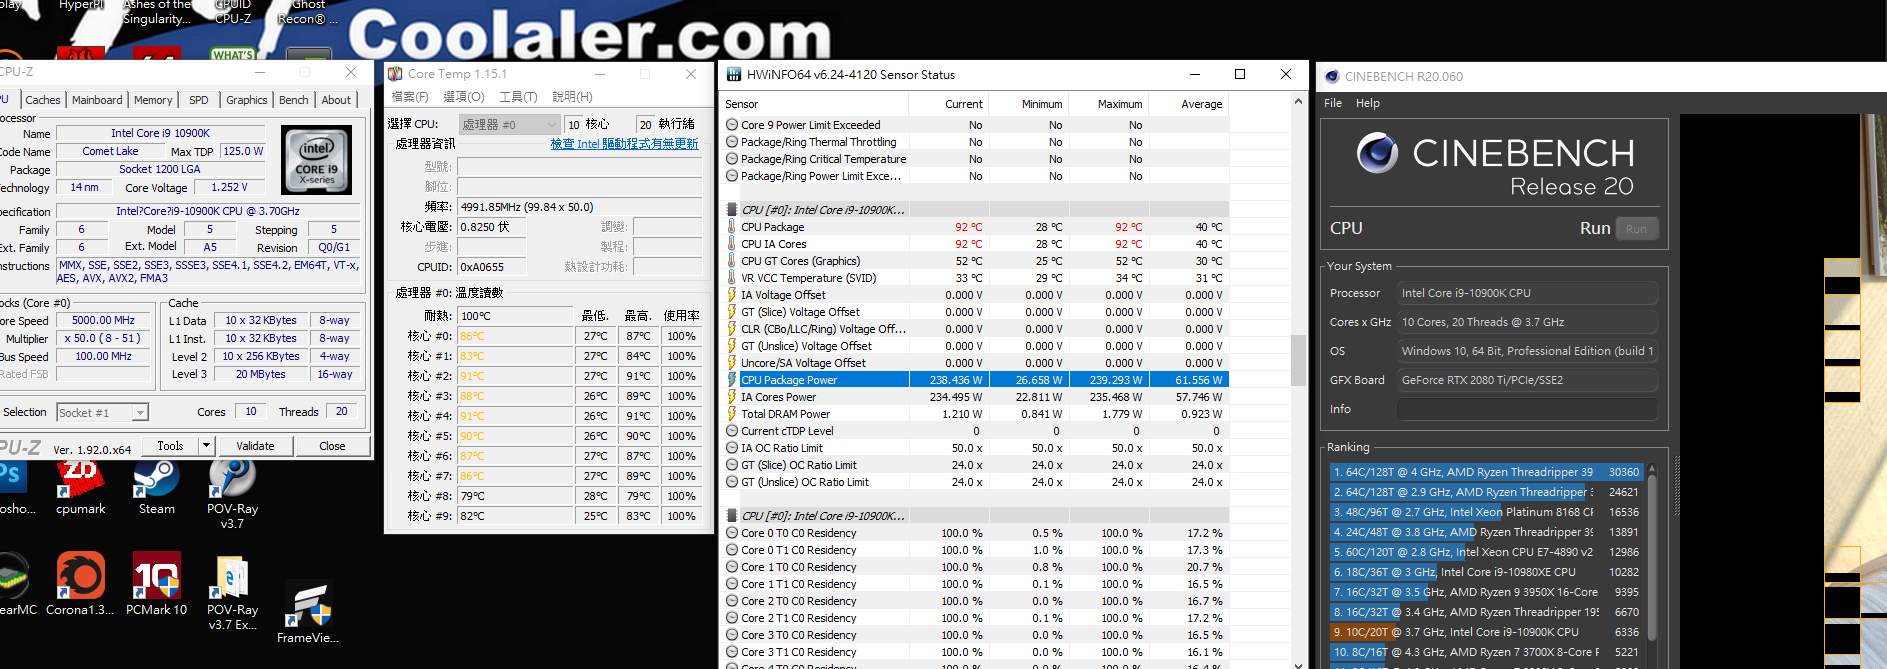
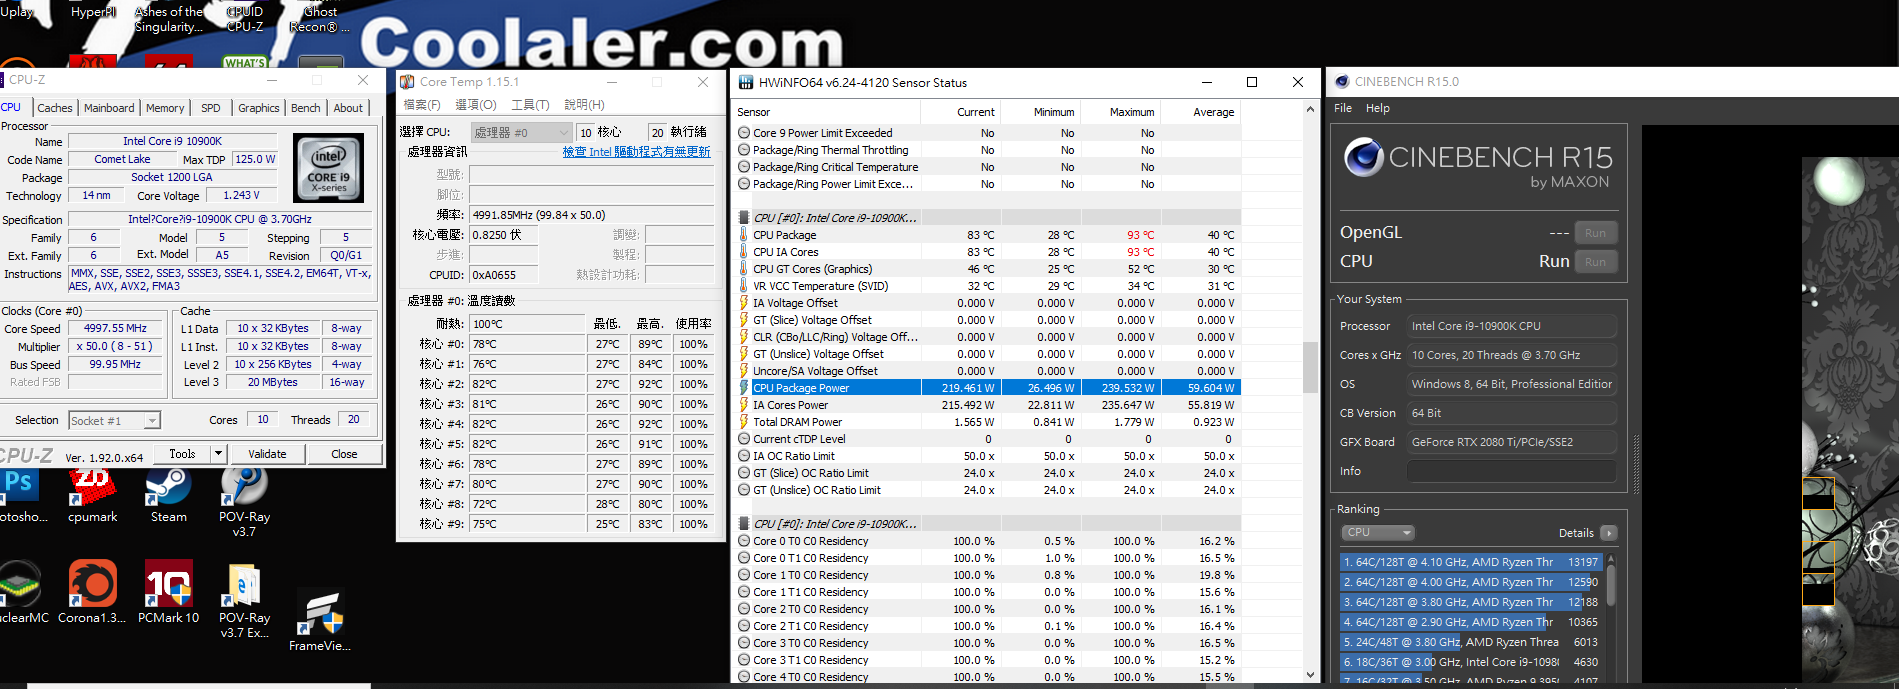
b.Cinebench R20 CPU Test Running: 239.293W
c.Cinebench R15 CPU Test Running: 219.461W
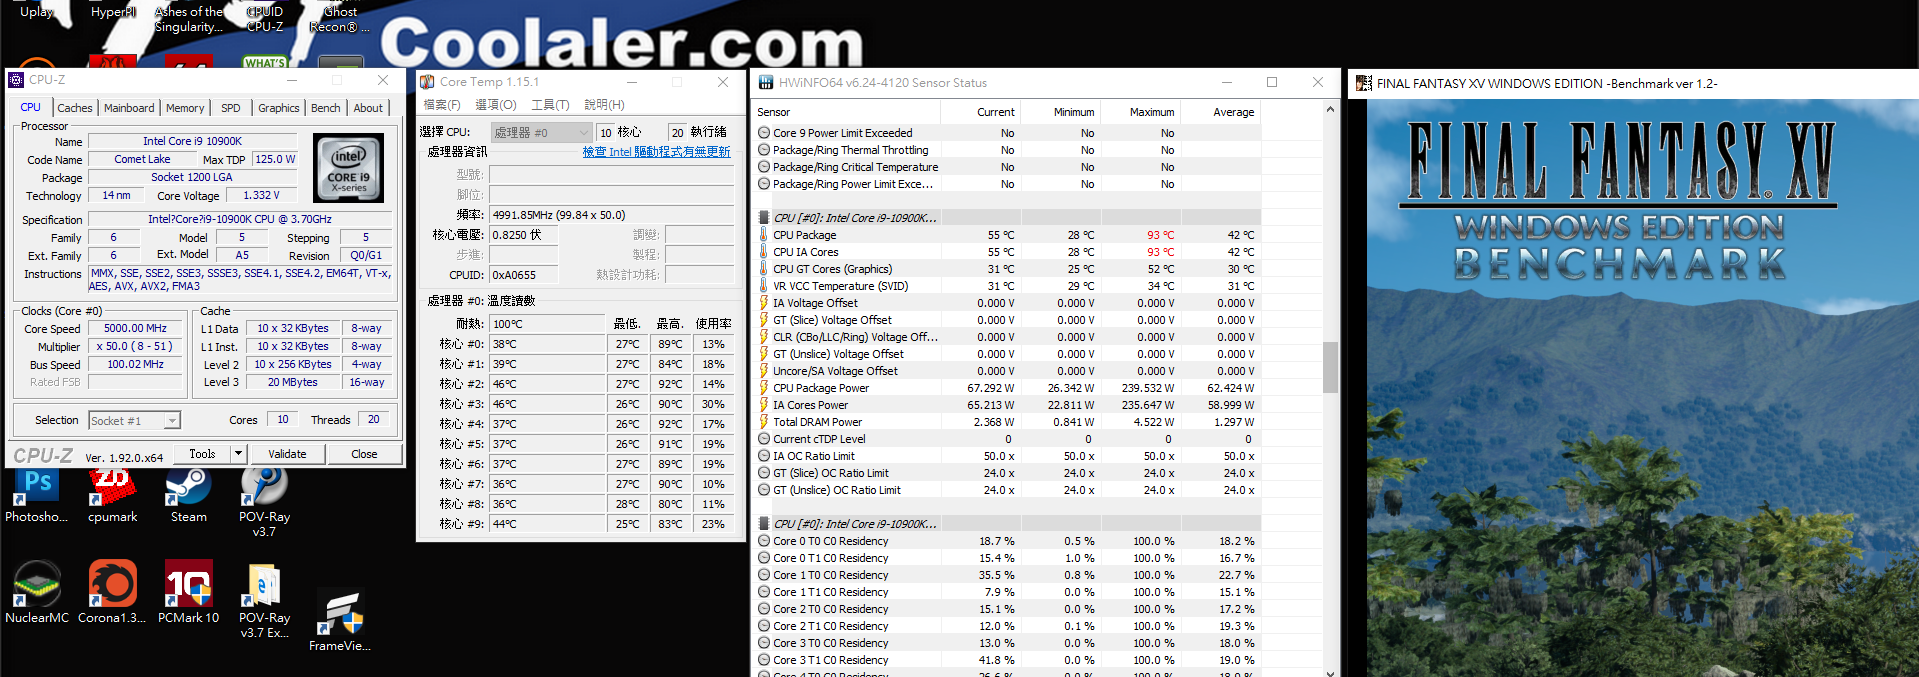
d.Final Fantasy XV Benchmark 4K Running:67.292W
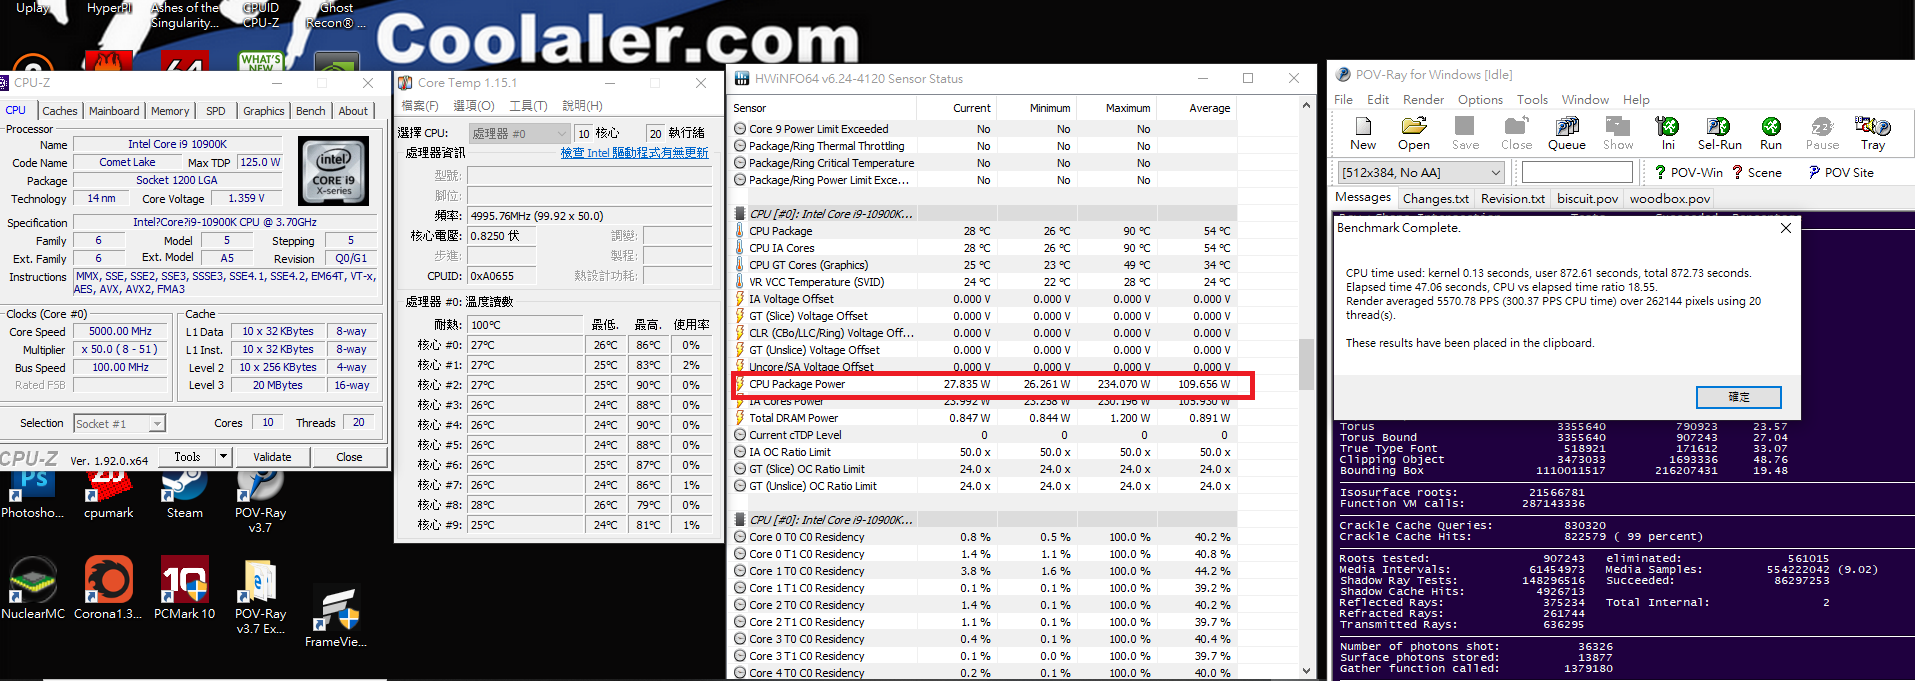
e. POV-Ray Benchmark Running: 234.070W
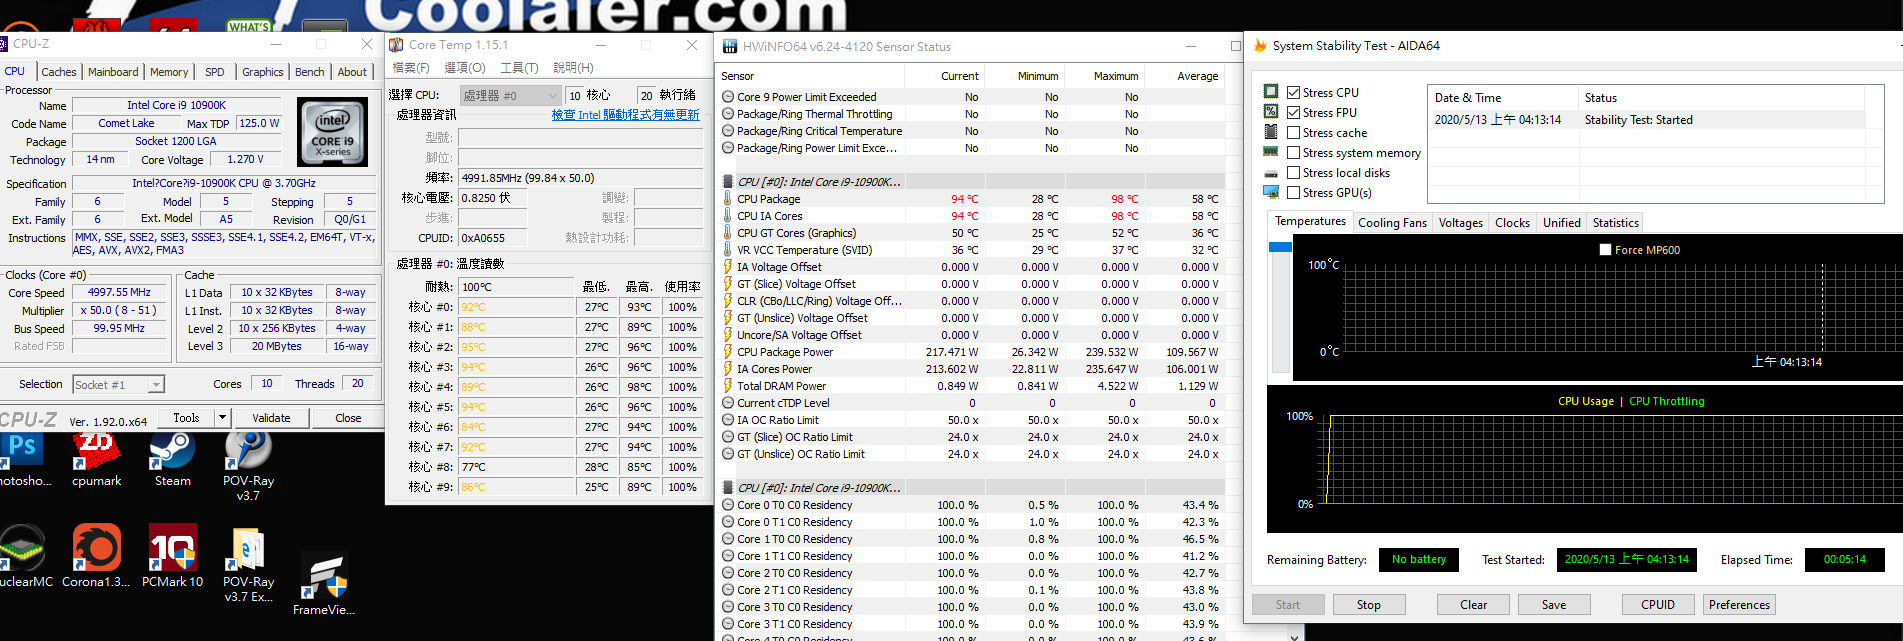
f. AIDA64 Strees CPU & FPU Test Benchmark Running: 239.532W
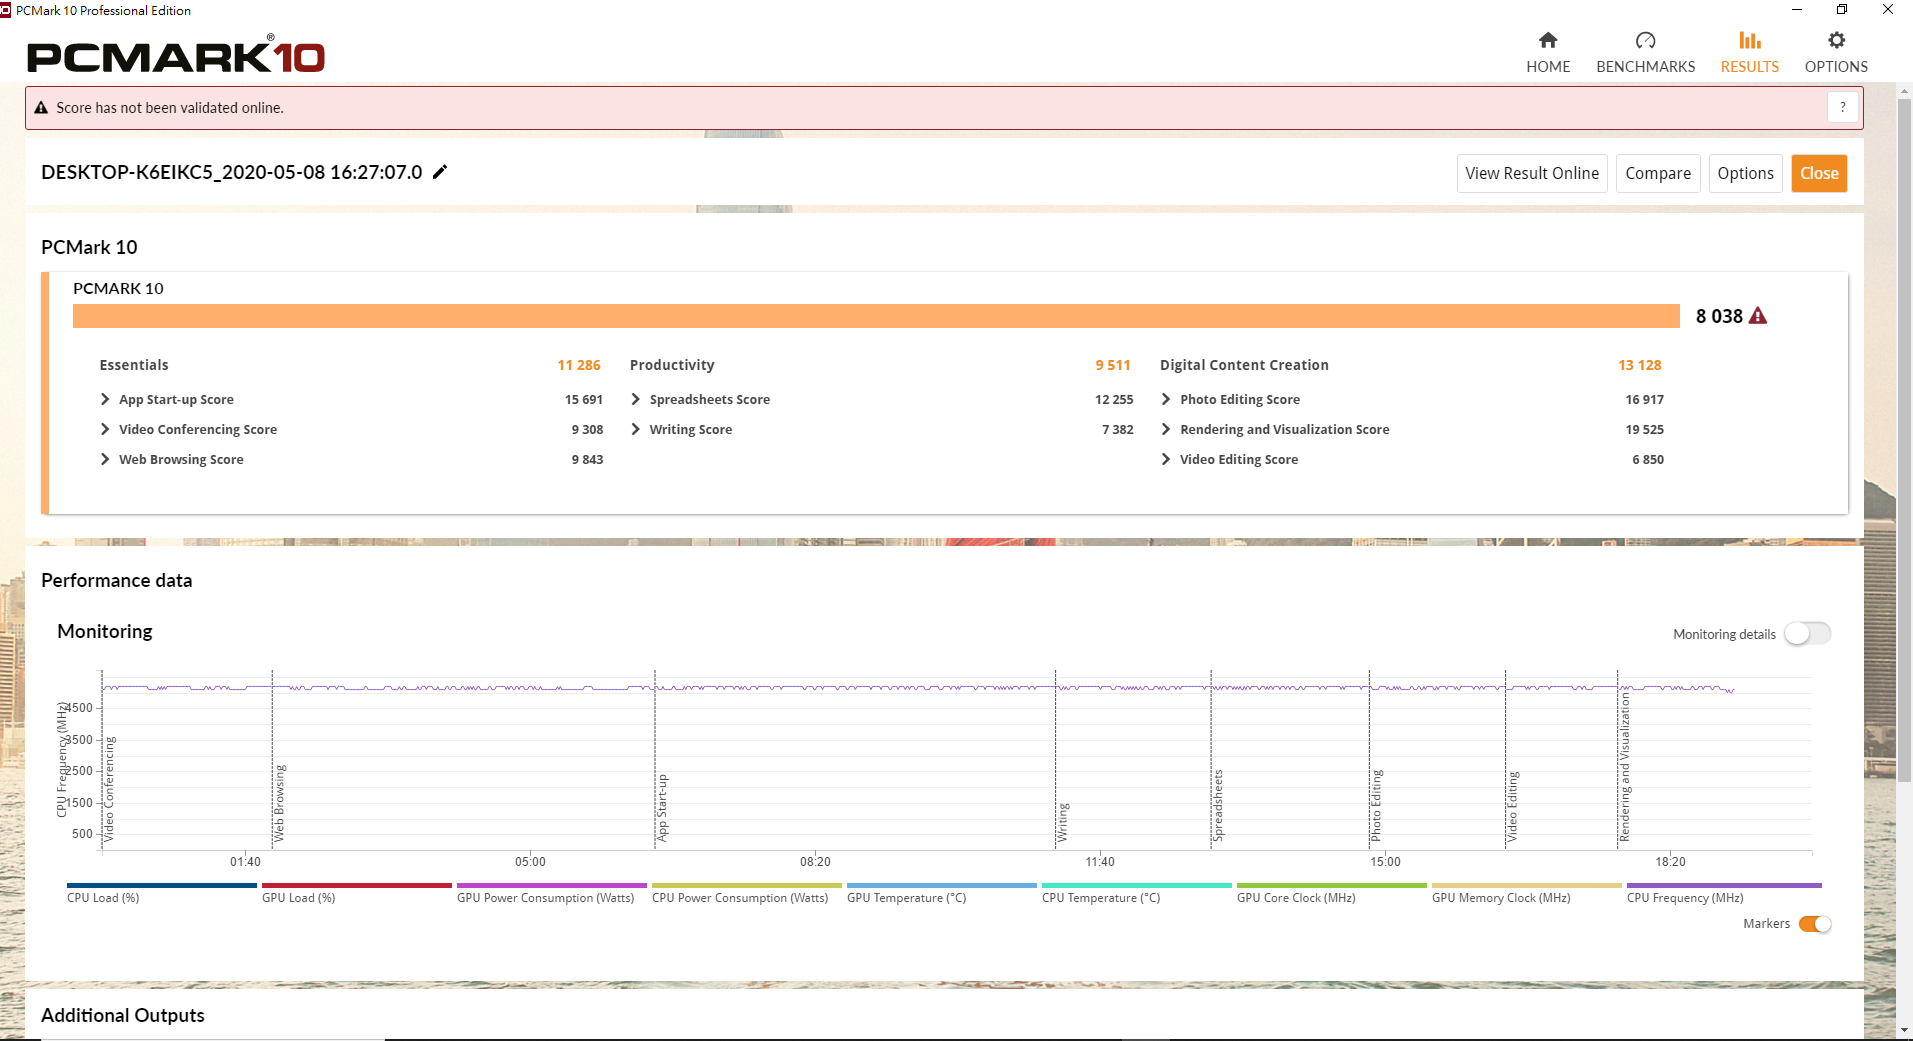
C.PCMark 10
PCMark是由 UL開發的計算機基準測試工具用於在系統和組件級別測試 PC的性能,而 PCMark 10是 Windows PC 的系統基準,其測試重點是當今辦公室內常用的各種編輯軟體,它提供了三類的工作負載
1.「Essentials」 包括 Web瀏覽,視頻會議和應用程序啟動時間
2.「Productivity」包括基於電子表格和寫作的測試
3.「Digital Content Creation」包括照片編輯,視頻編輯以及渲染和可視化測試
PCMark 10 Bench Results
Core i9-10900K綜合分數 8038分 Essentials」11286分,「Productivity」9511分,Digital Content Creation」13128分
D.Gaming Benchmark
10900K vs 10600K vs 10980XE vs 9900KS vs 3700X 1080P Gaming Compare (10980XE & 3700X測試連結)
10900K vs 10600K vs 10980XE vs 9900KS vs 3900X vs 3700X@4K Gaming Compare (10980XE & 3900X & 3700X測試連結)
10900K vs 10600K vs 10980XE vs 9900KS vs 3970X vs 3960X vs 3900X vs 3700X@1080P Gaming Compare (3970X vs 3960X測試連結)
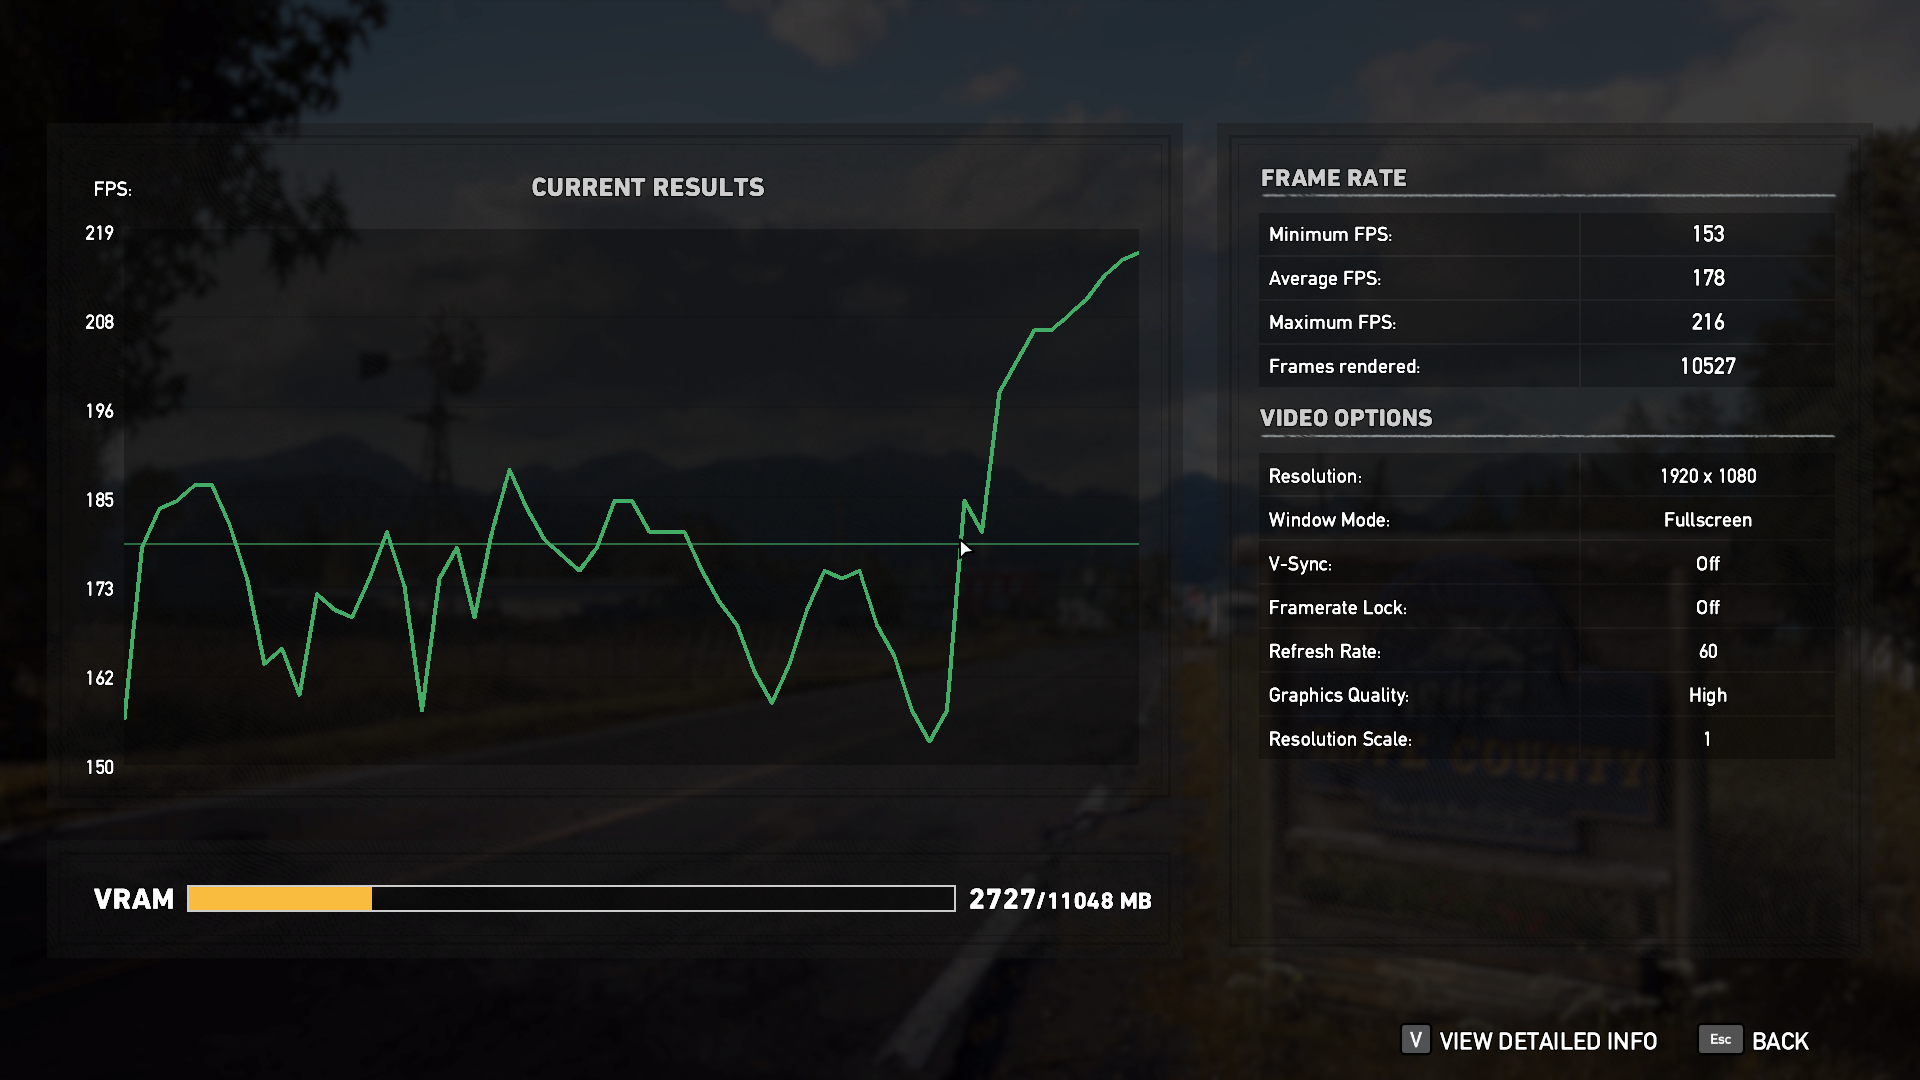
a.Far Cry 5 Benchmark
Far Cry 5《極地戰嚎5》是一個自帶 Benchmark的新遊戲,是由育碧蒙特婁、育碧多倫多開發和育碧軟體發行的開放世界第一人稱動作冒險遊戲

Far Cry 5 Setting


Far Cry 5 Benchmark 1080P Ave Results
10900K@All Core 5GHz Far Cry 5 Benchmark Ave 178fps
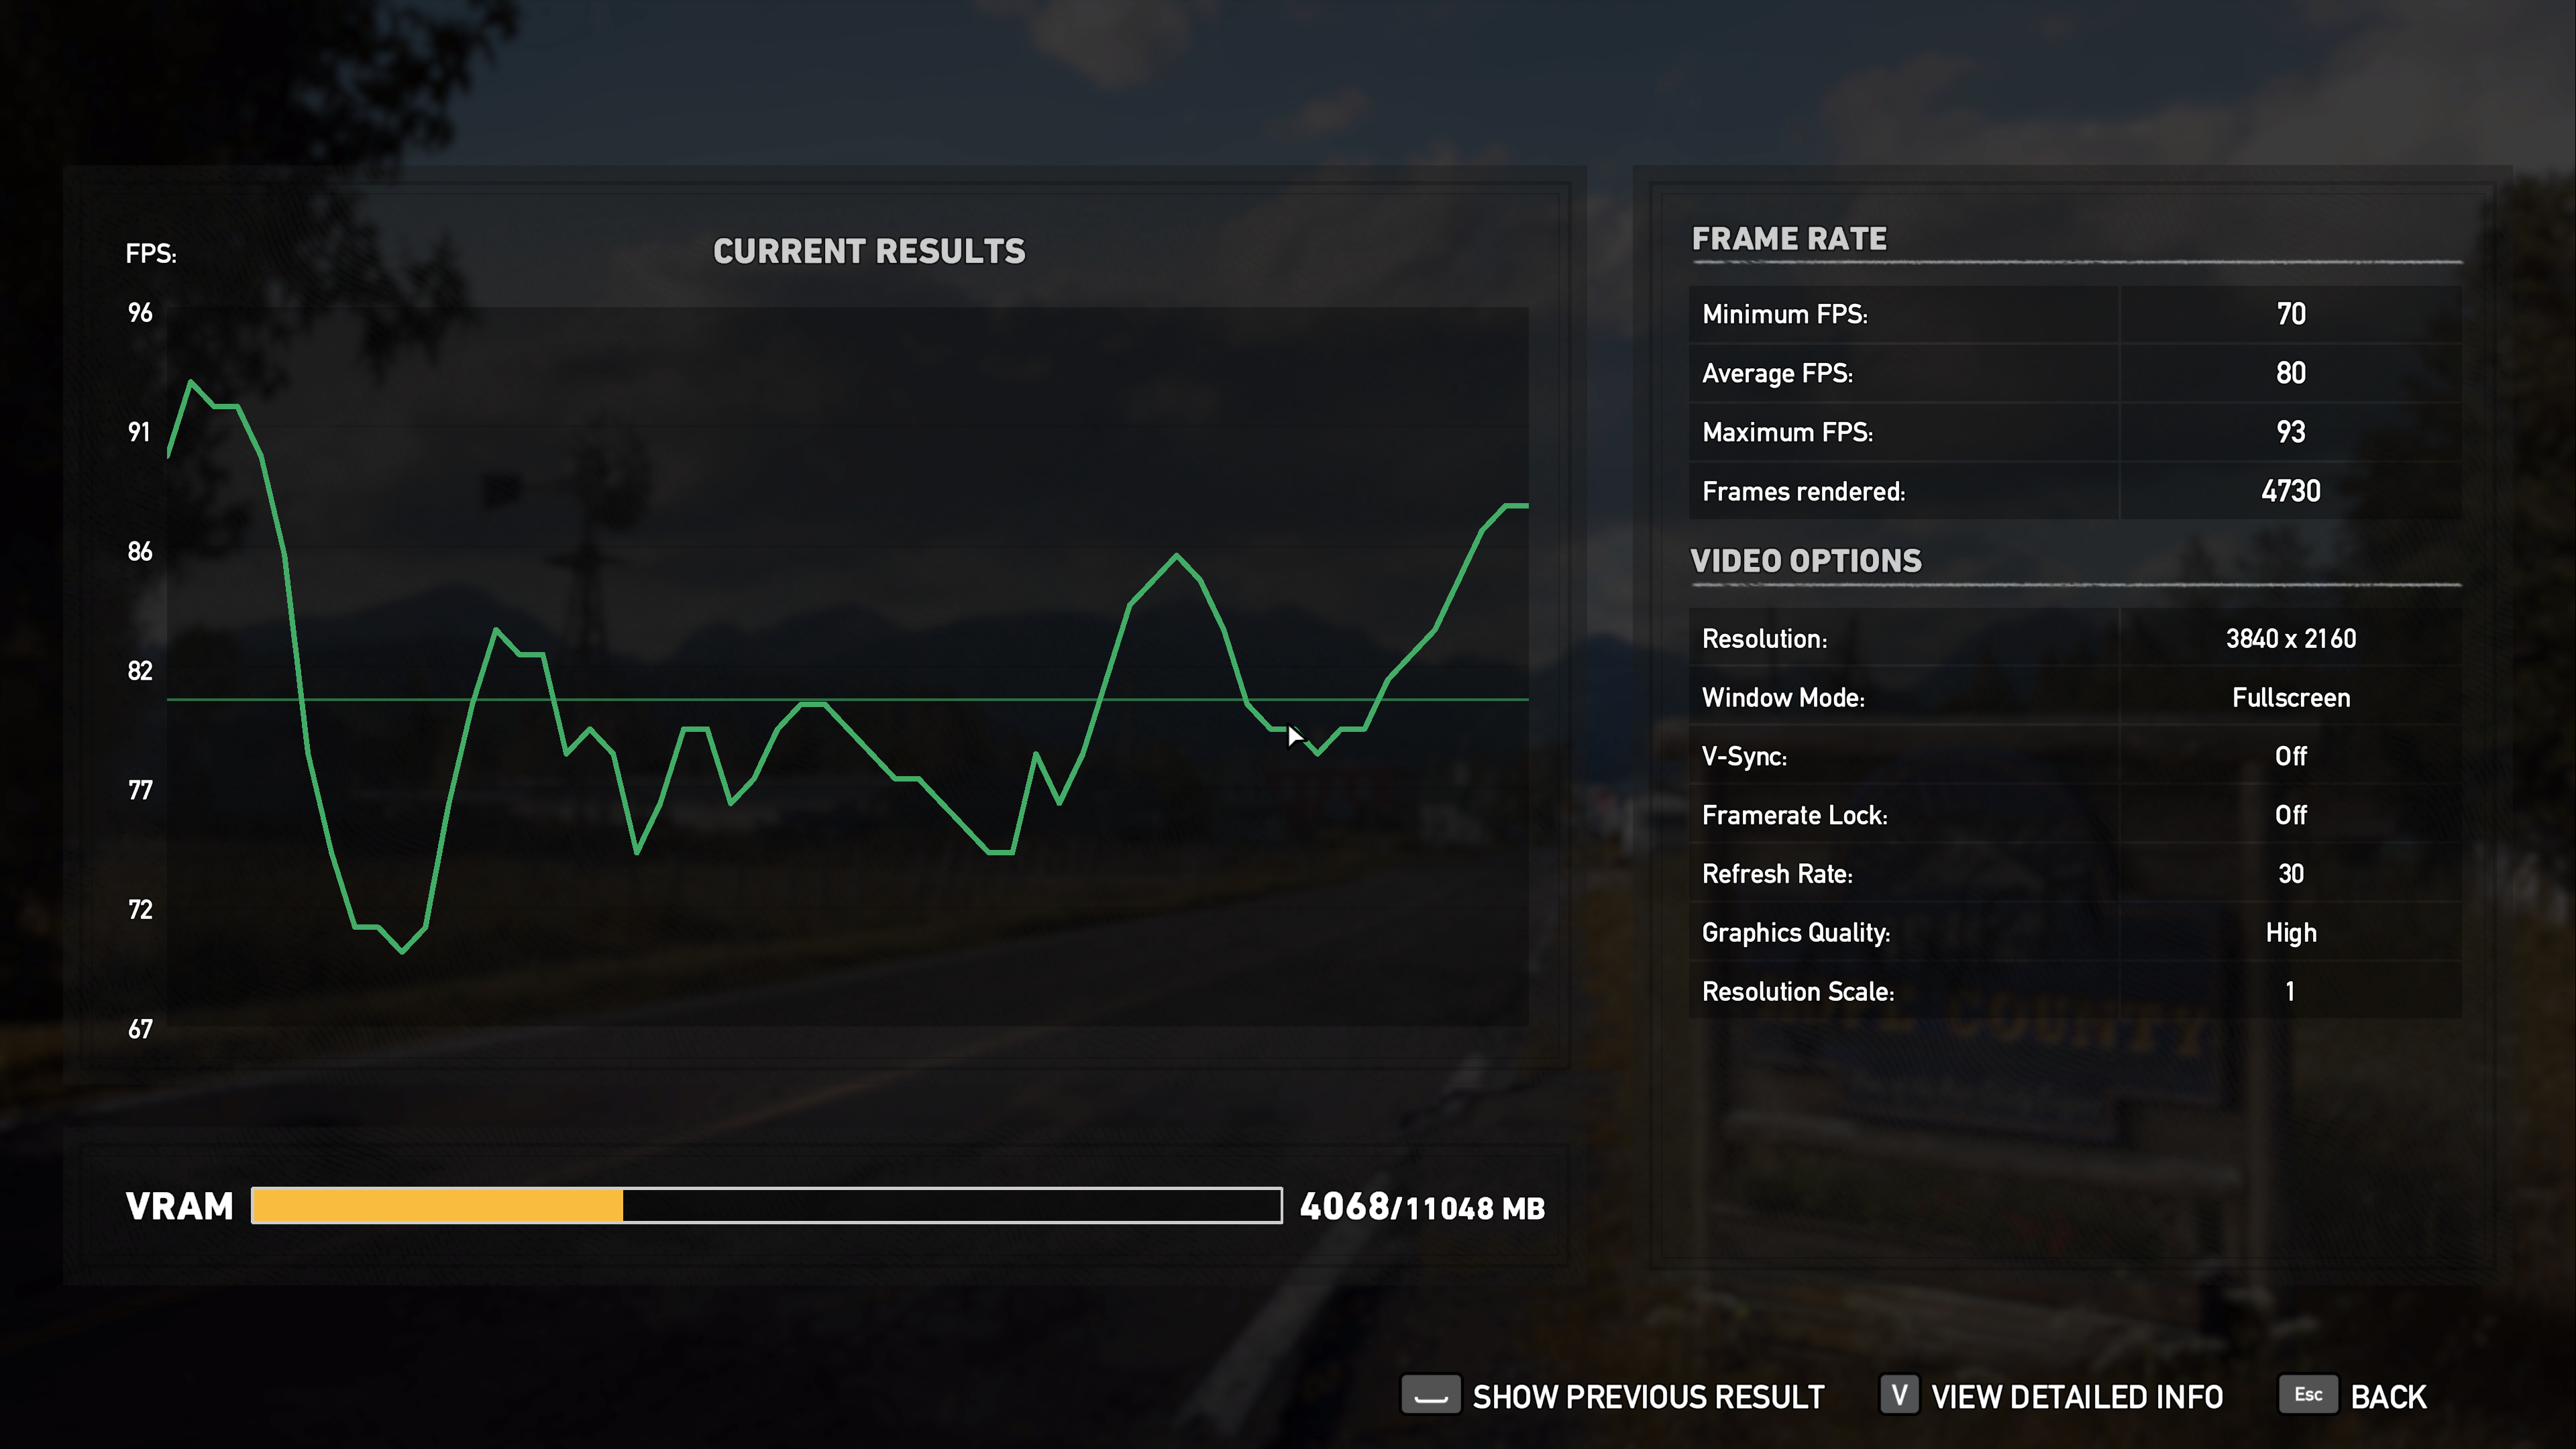
Far Cry 5 Benchmark 4K Ave Results
10900K@All Core 5GHz Far Cry 5 Benchmark Ave 80ps
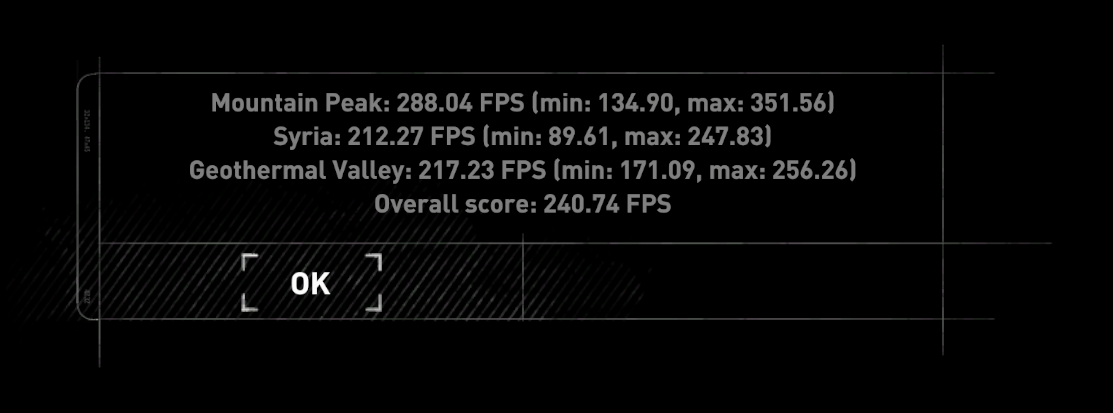
b.Rise of the Tomb Raider Benchmark
Rise of the Tomb Raider Benchmark《古墓奇兵:崛起》
Rise of the Tomb Raider《古墓奇兵:崛起》,是一款由晶體動力開發,微軟工作室和史克威爾艾尼克斯合作發行的動作冒險遊戲,同樣自帶測試軟體,本作是 2013年《古墓奇兵》的續作

Rise of the Tomb Raider Benchmark 1080P Overall fps Results
Core i9-10900K@All Core 5GHz:240.74FPS
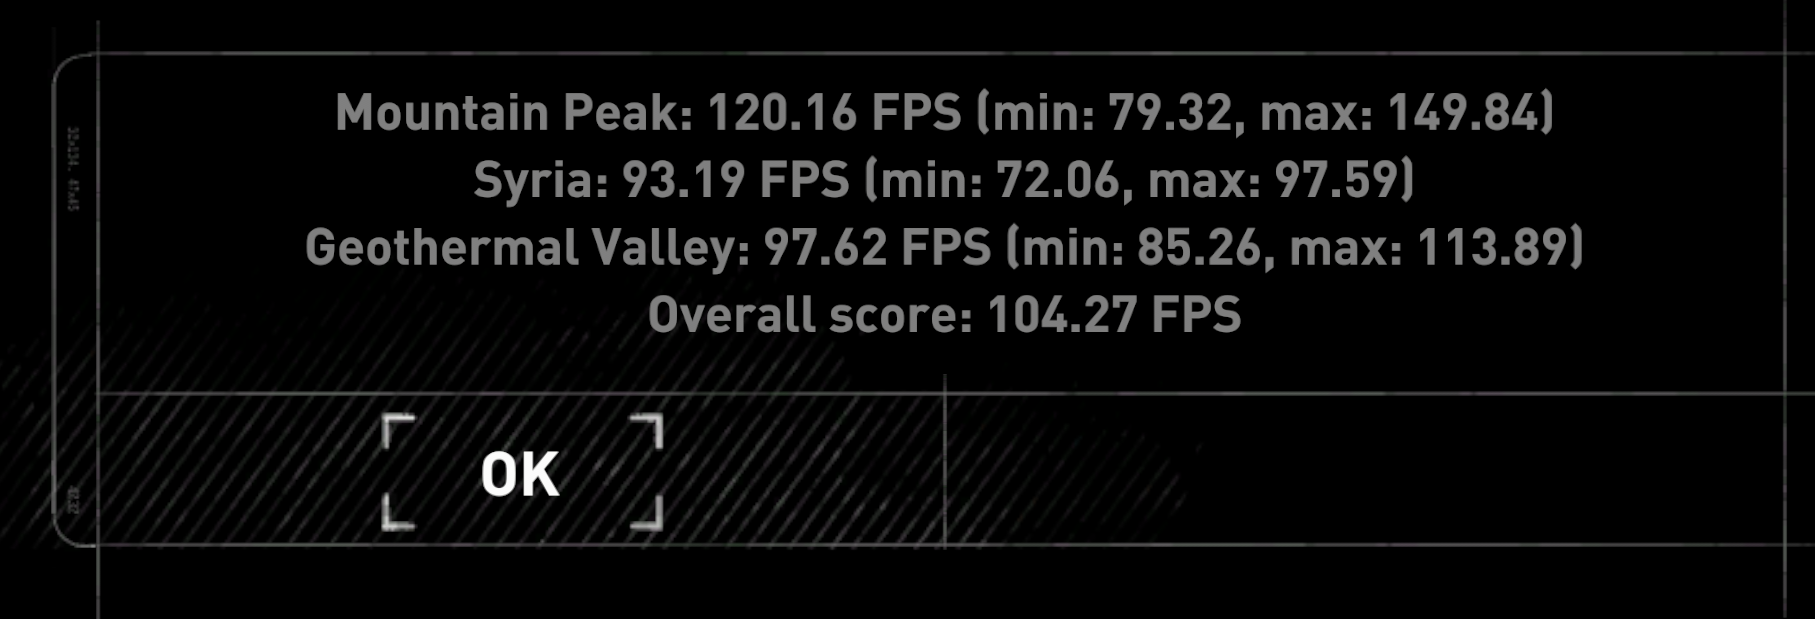
Rise of the Tomb Raider Benchmark 4K Overall fps Results
Core i9-10900K@All Core 5GHz:104.27FPS
c.Assassin's Creed Origins Benchmark
Assassin's Creed Origins《刺客教條:起源》中國大陸譯作「刺客信條:起源」)是一部由育碧蒙特婁開發由育碧公司發行的動作冒險遊戲
本作是刺客教條主系列的第十部作品,也是系列首次把時間線推前到刺客教條初代以前,同樣也自帶有測試軟體,遊戲的舞台是在托勒密王朝埃及豔后統治下的埃及,玩家所操控的角色是一位隸屬於法老的護衛,稱為守護者(Medjai),來自錫瓦(Siwa)名為巴耶克(Bayek)的埃及刺客

Assassin's Creed Origins Setting

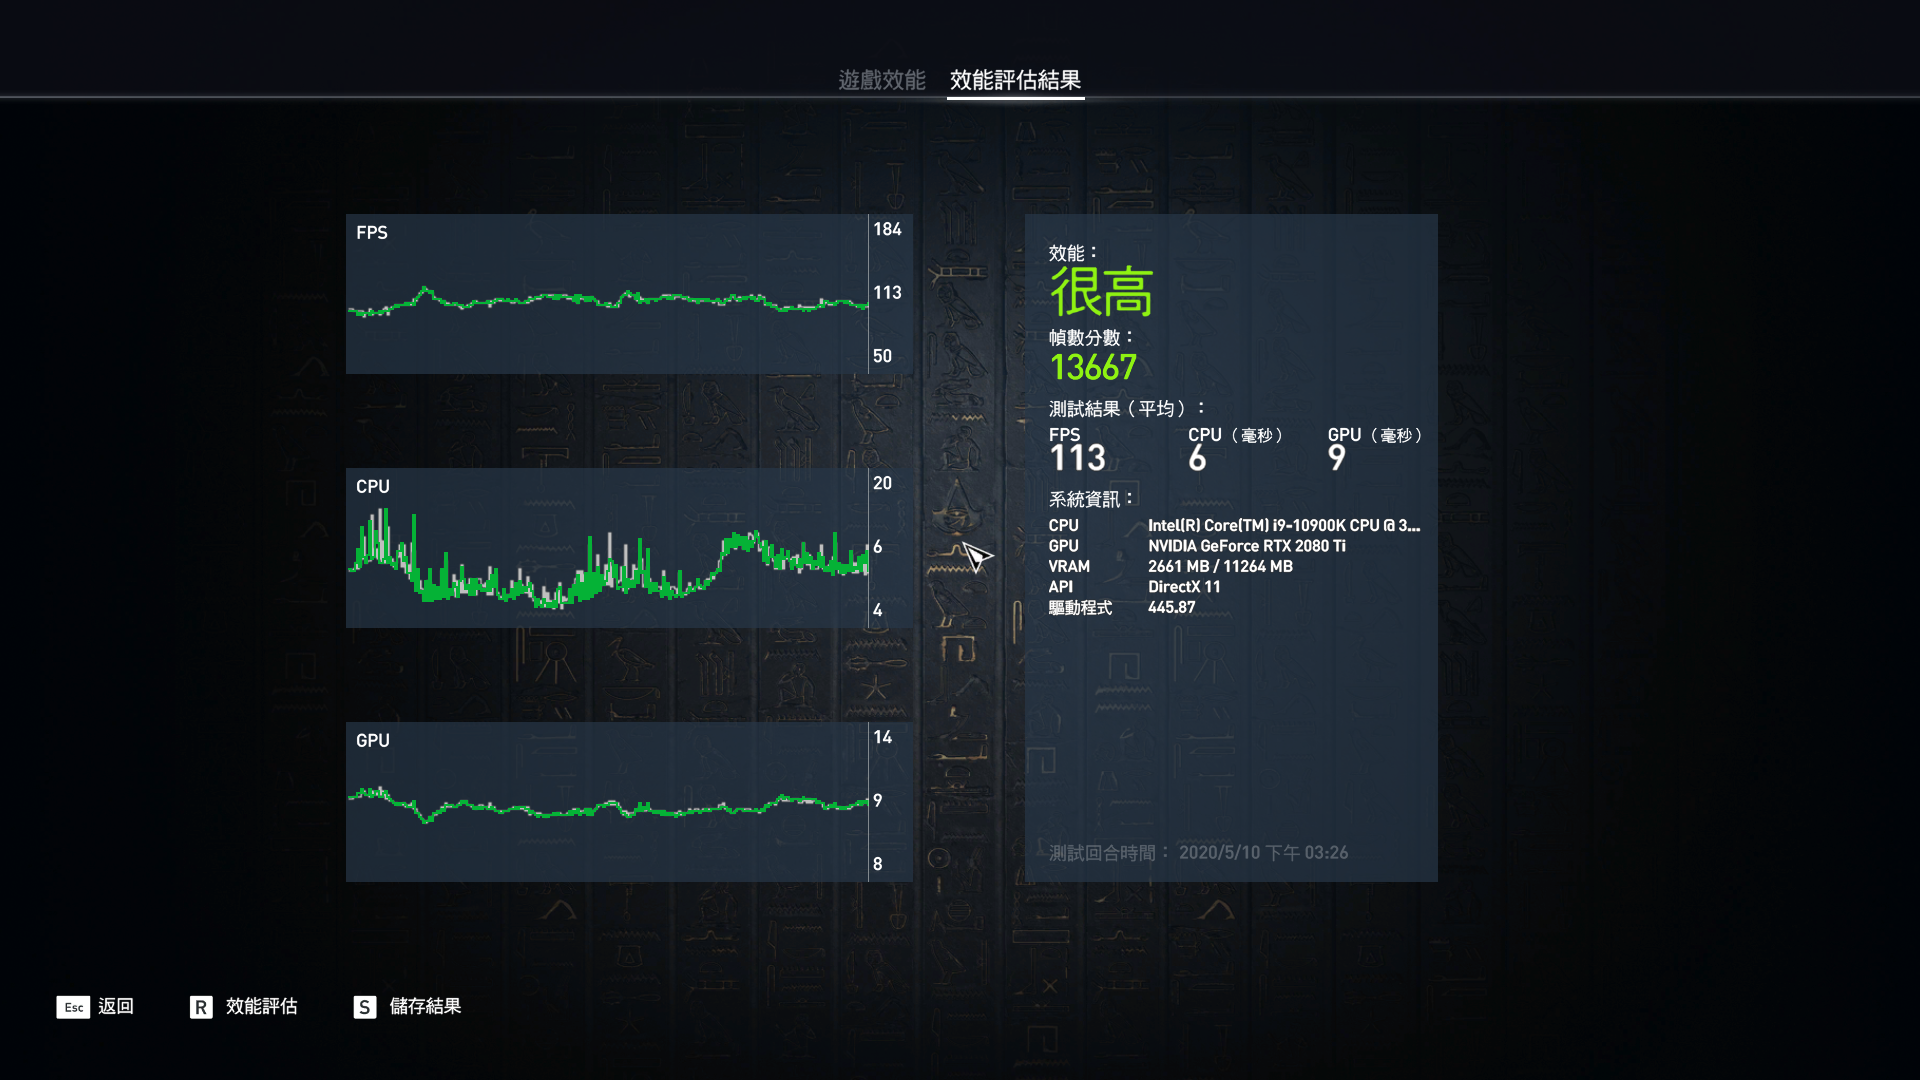
Assassin's Creed Origins Benchmark 1080P Results
Core i9-10900K@All Core 5GHz:13667分
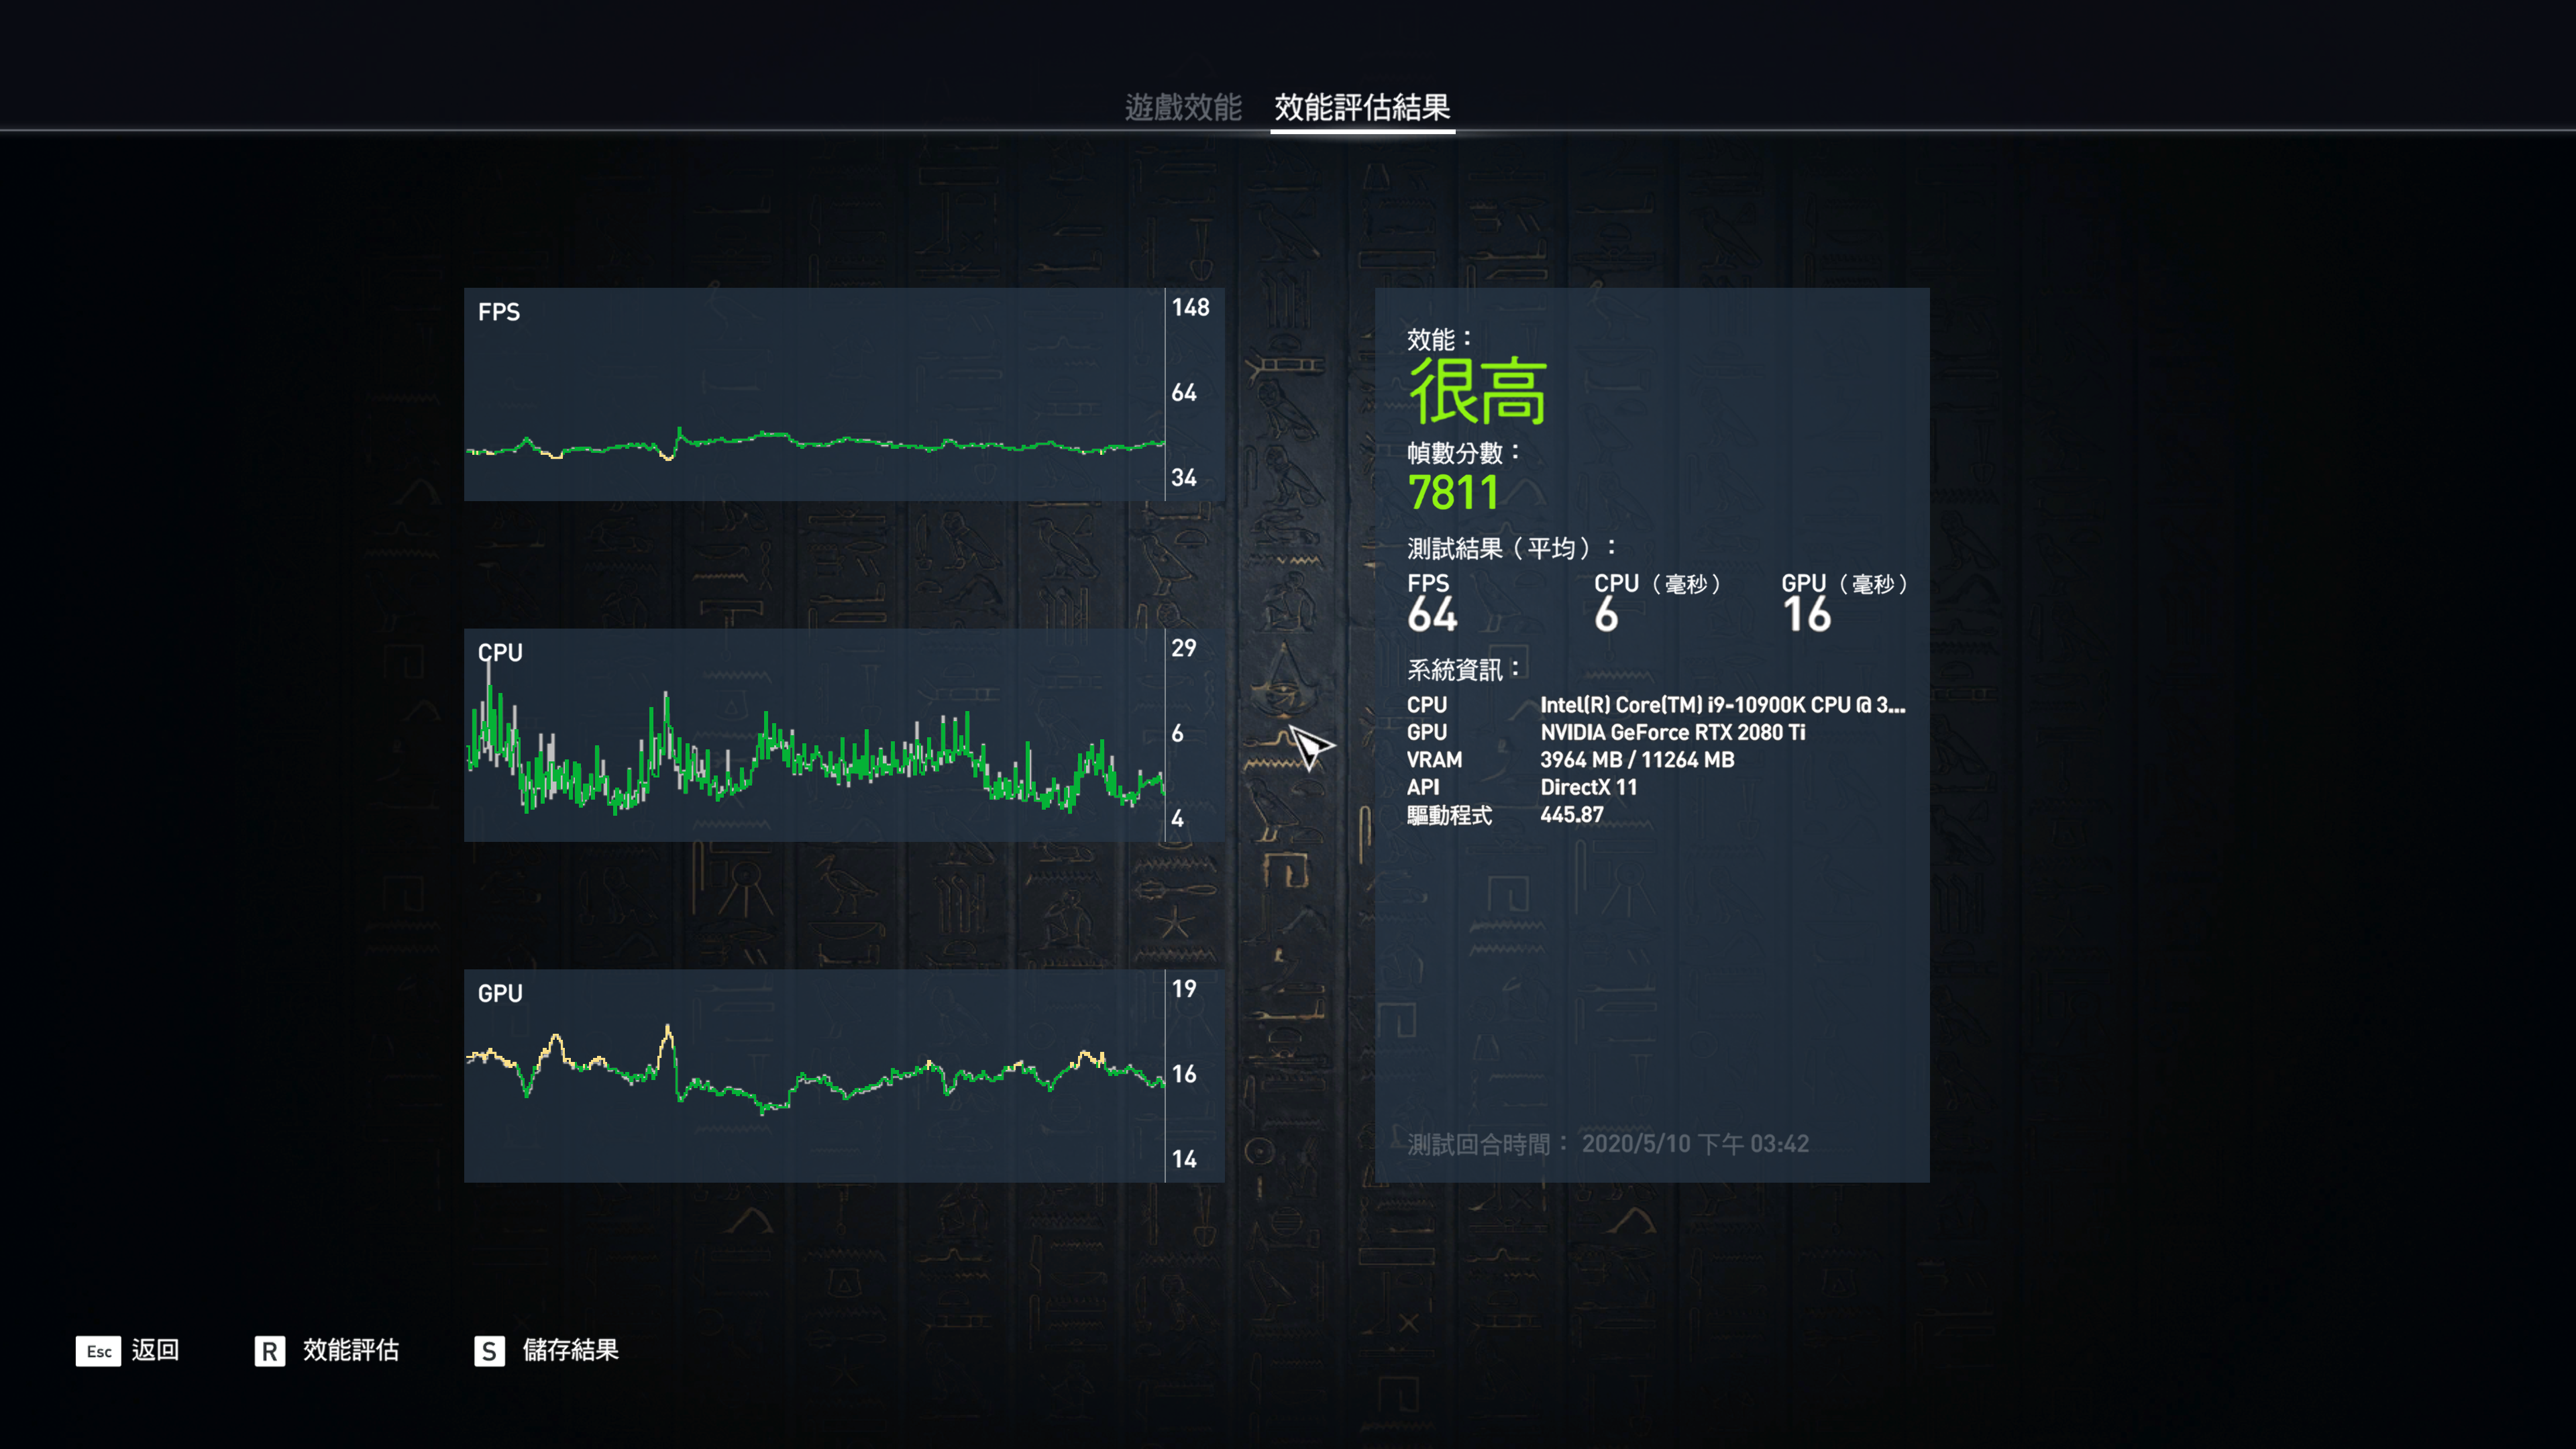
Assassin's Creed Origins Benchmark 4K Results
Core i9-10900K@All Core 5GHz:7811分
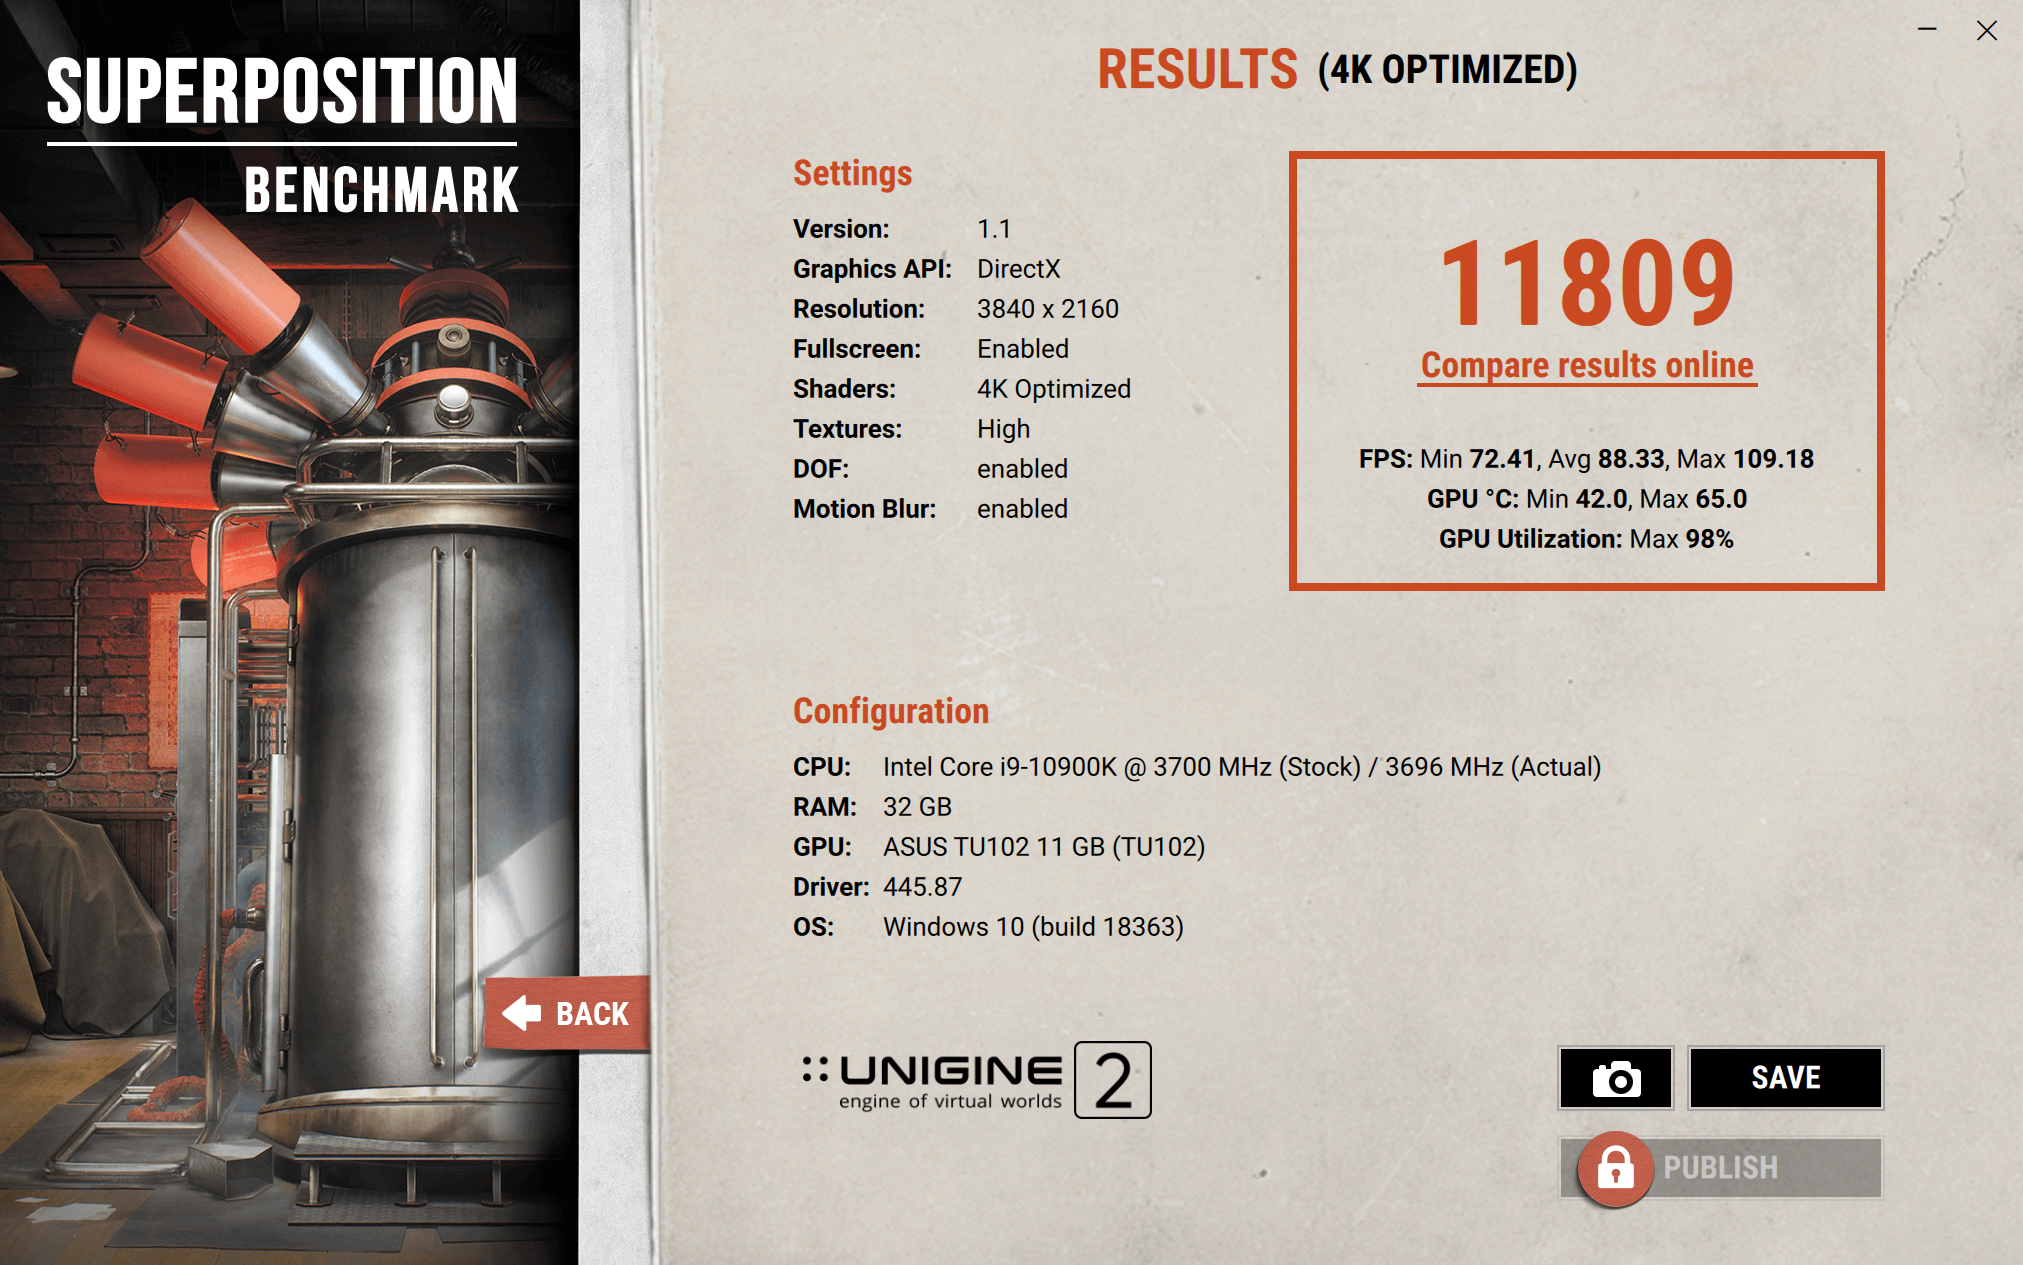
d.UNIGINE Superposition Benchmark
UNIGINE是一款專有的跨平台遊戲引擎,由俄羅斯軟件公司 UNIGINE Corp開發。除了用作遊戲引擎外,它還用於虛擬現實系統,嚴肅遊戲和可視化
UNIGINE最強大的功能是它的高級渲染器,支持 OpenGL 4.0和 DirectX 11,Superposition則為 2017版本,包含極端性能和穩定性測試:視頻卡,電源,冷卻系統,檢查預設和超頻模式與真實負載及在環境中的互動體驗

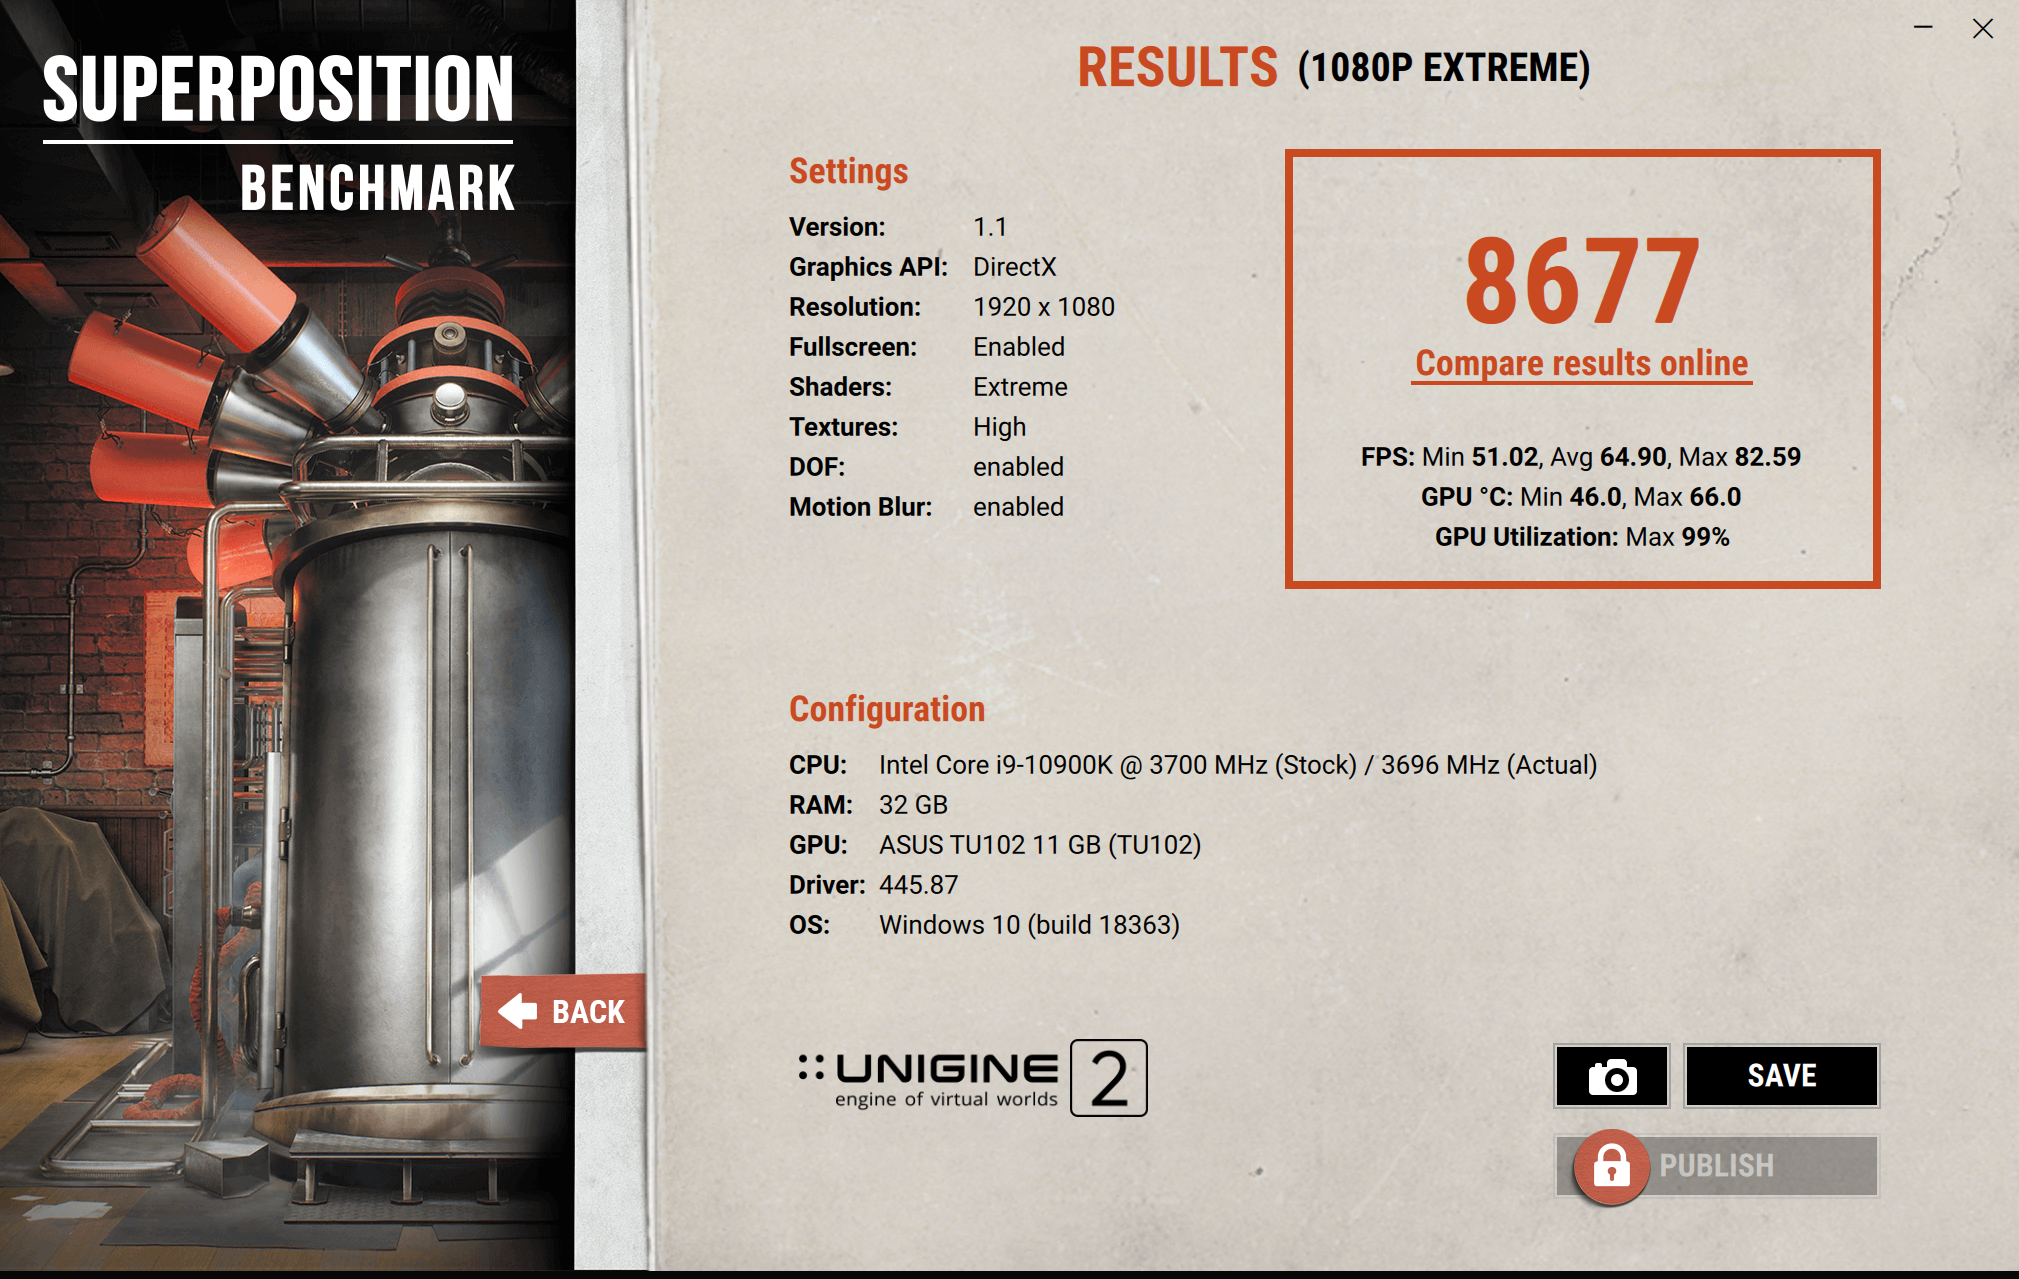
UNIGINE Superposition Benchmark 1080P Extreme Results
Core i9-10900K@All Core 5GHz:8677分
UNIGINE Superposition Benchmark 4K Optimazed Results
Core i9-10900K@All Core 5GHz:11809分
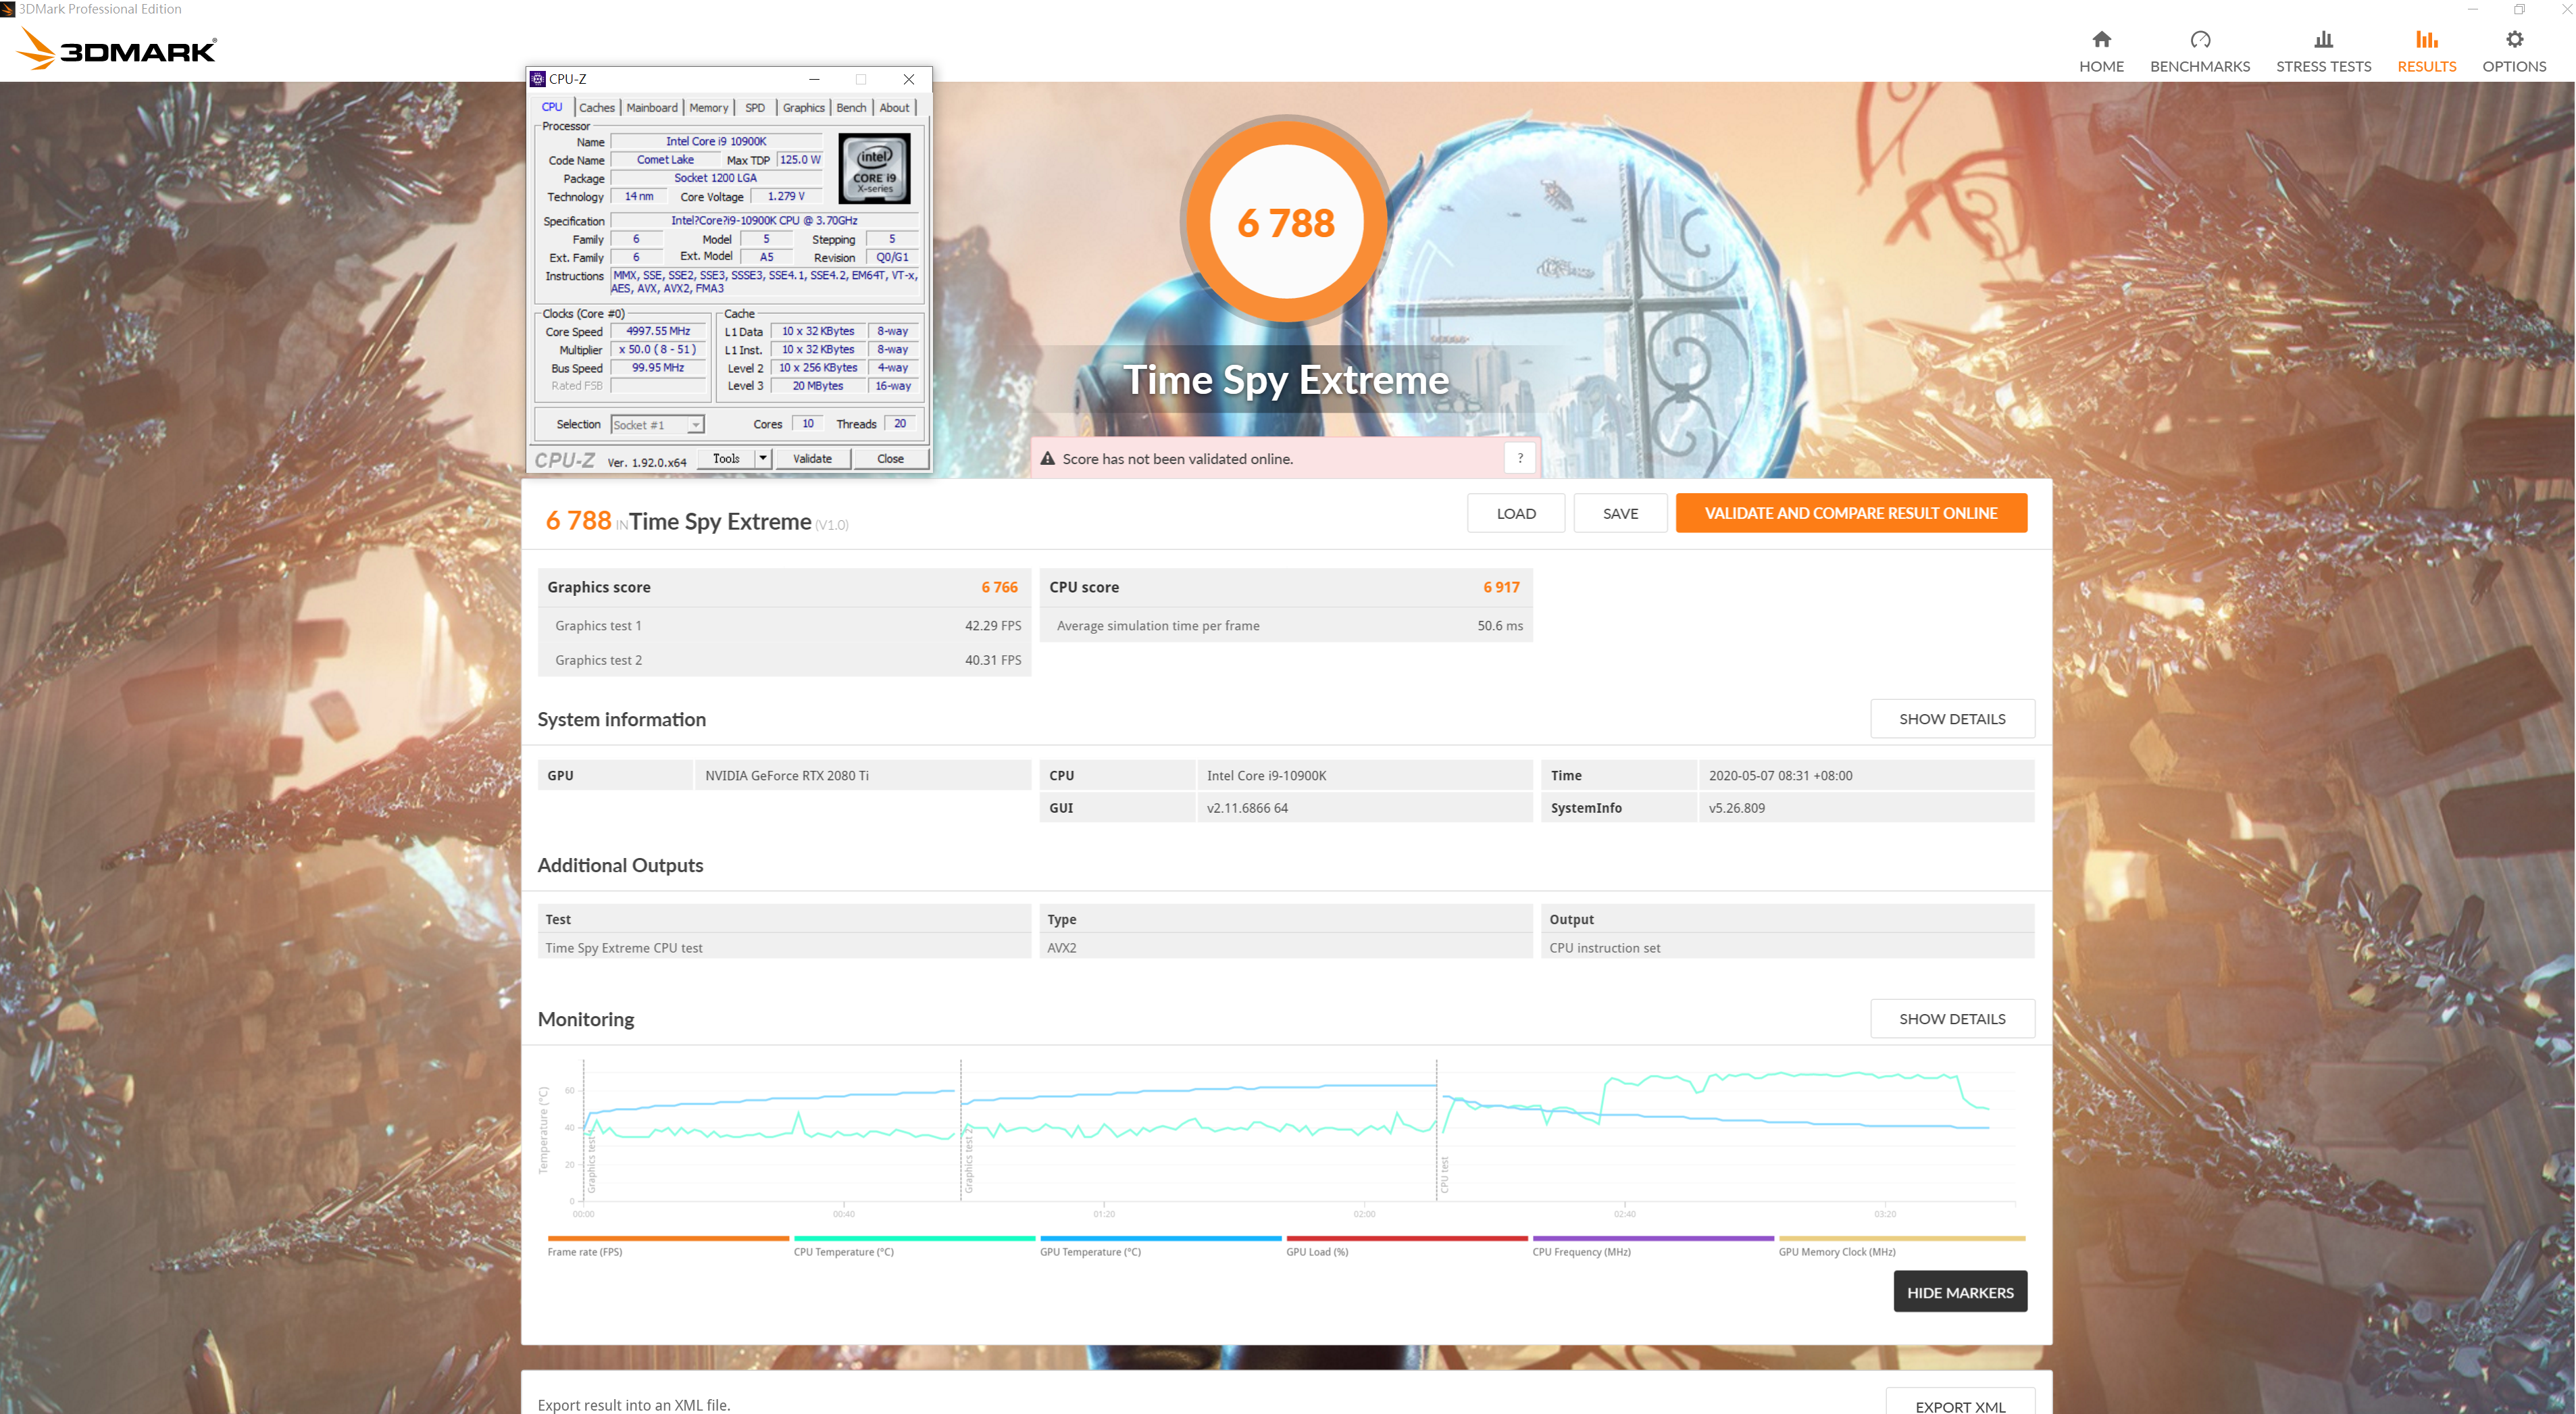
e.3DMark Time Spy Extreme
3DMark Time Spy用來測試處理器及顯示卡之 3D圖形表現和工作負載,現由 UL擁有,主要是針對 DirectX 12的效能,測試有三個部分,第一個為顆粒陰影、曲面細分等效果,第二個則是光線追蹤的體積光照明技術,最後則是 CPU效能測試,在前兩個測試中,包含了數千萬個頂點跟多邊形,上百萬個曲面細分,這些都是 FireStrike的幾十倍,而 3DMark Time Spy Extreme是 3DMark Time Spy的 4K版本,所有圖形都是 4K規格

3DMark Time Spy Extreme Benchmark Results
Core i9-10900K@All Core 5GHz:6788分
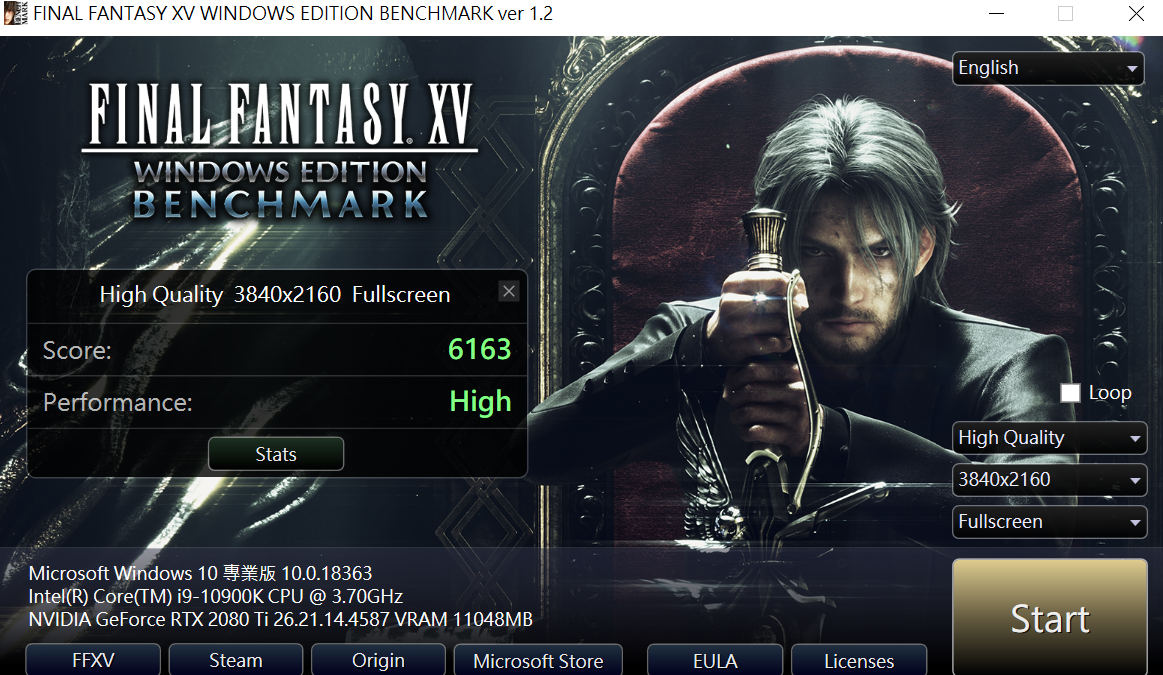
f.Final Fantasy XV Benchmark
Final Fantasy XV《太空戰士 15》的 Benchmark,是一款由史克威爾艾尼克斯在 2016年 11月推出的動作角色扮演遊戲《Final Fantasy系列》的第 15部,依照傳統,太空戰士都有 Benchmark的項目

Final Fantasy XV Benchmark 1080P Results
Core i9-10900K@All Core 5GHz:13832分

Final Fantasy XV Benchmark 4K Results
Core i9-10900K@All Core 5GHz:6163分
g.Middle-earth: Shadow of War Benchmark《中土世界:戰爭之影》
Middle-earth: Shadow of War《中土世界:戰爭之影》亦為一自帶 Benchmark的角色扮演遊戲,是由 Monolith Productions開發並由華納兄弟互動娛樂發行並於 2017年 10月 10日在全球發布

Middle-earth: Shadow of War Benchmark Setting
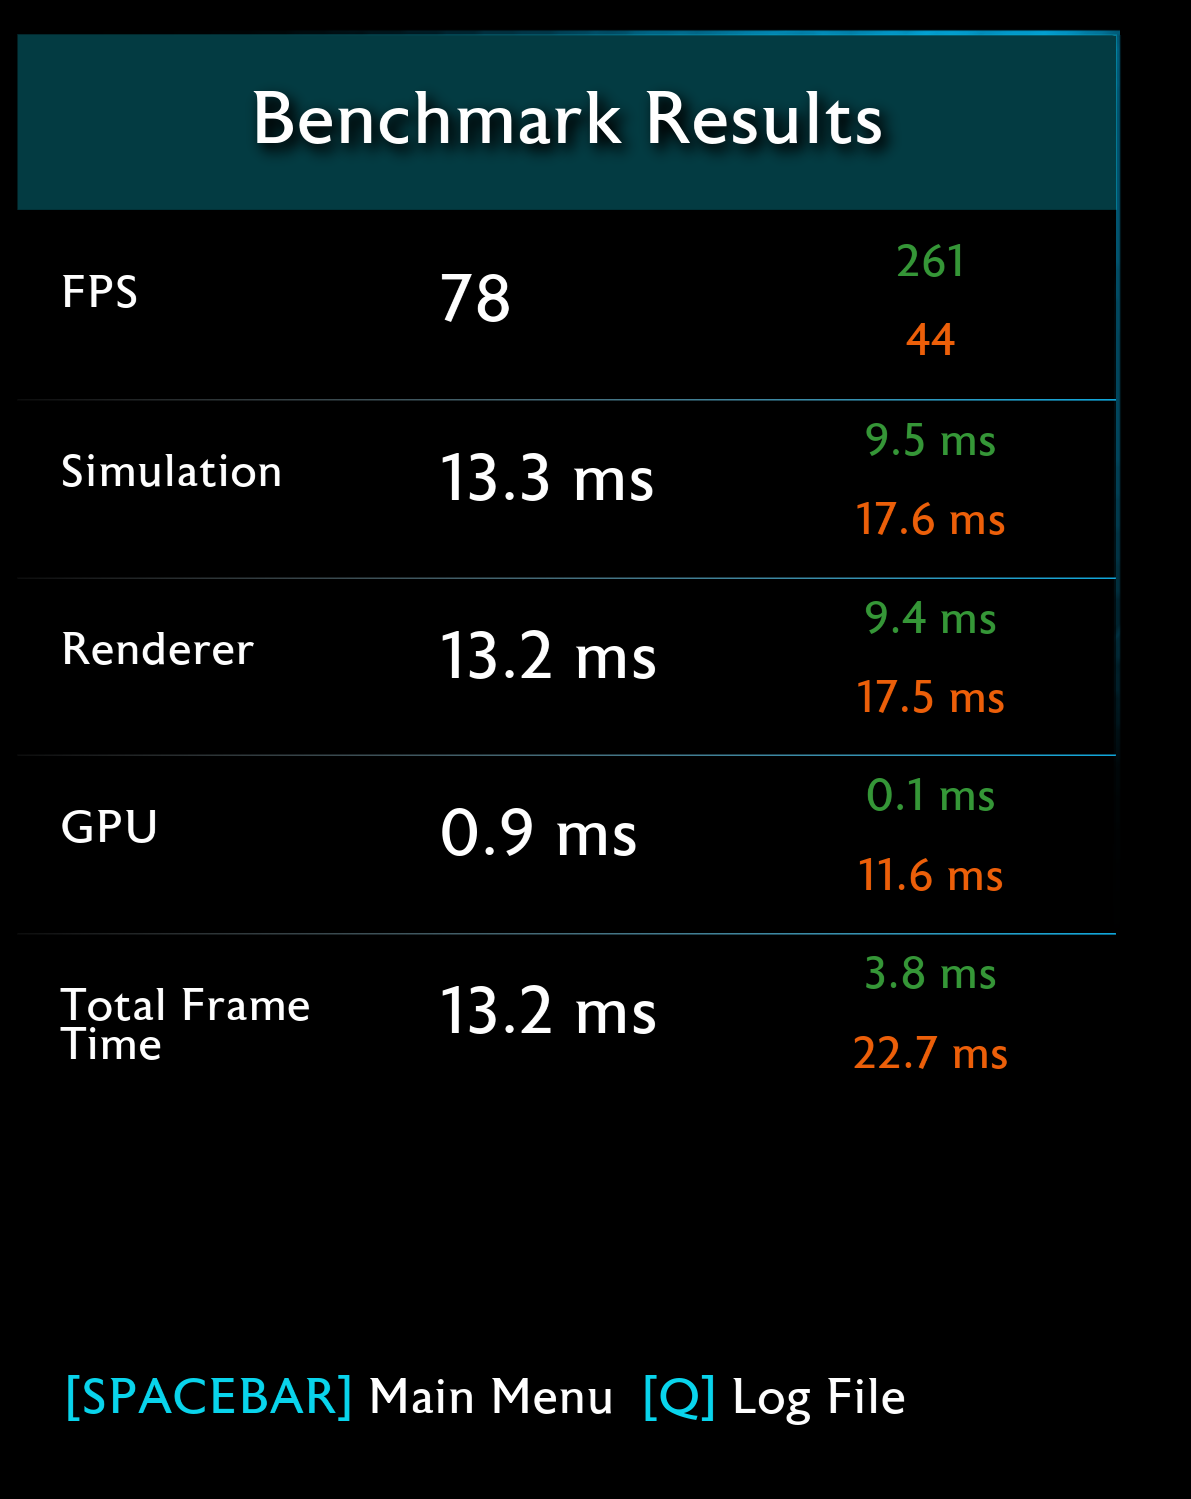
Middle-earth: Shadow of War Benchmark 1080P Results
Core i9-10900K@All Core 5GHz:170FPS
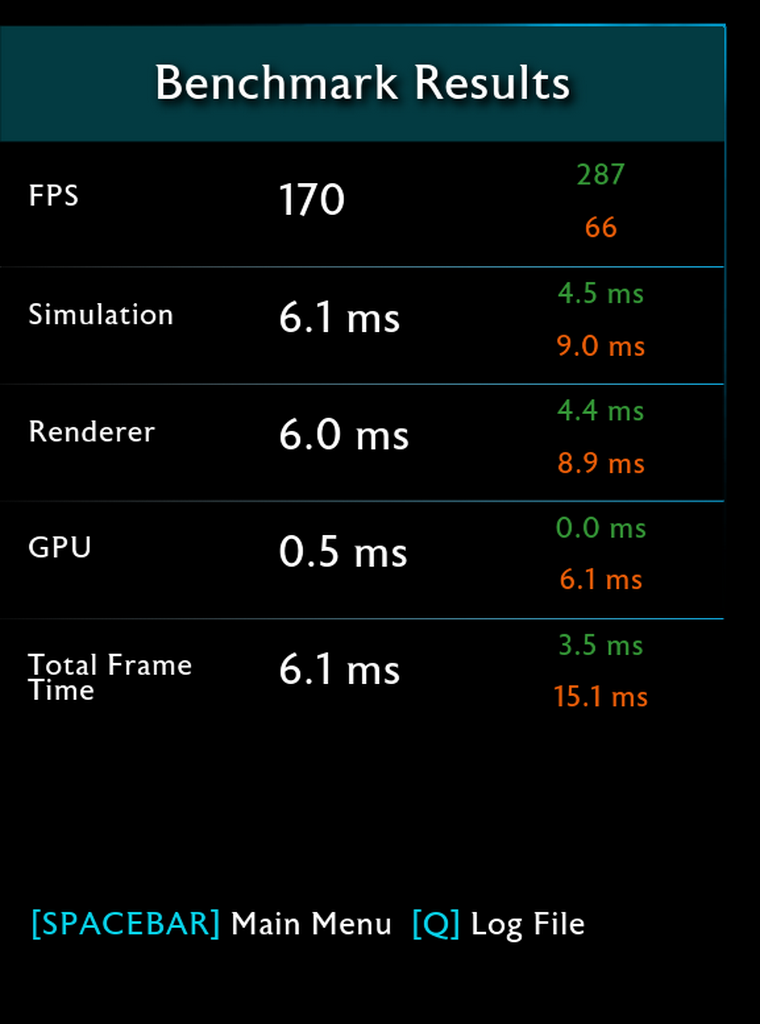
Middle-earth: Shadow of War Benchmark 4K Results
Core i9-10900K@All Core 5GHz:78FPS
E.Overclocking Limit Air Cooled
a.DDR4 4800@10900K
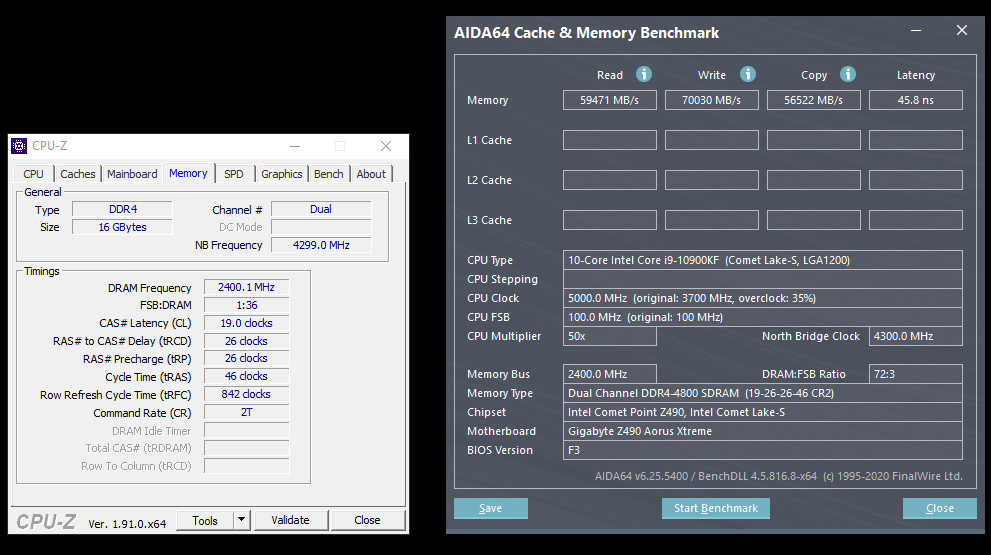
10900K@Boost & DDR4 4800 C19 AIDA64 Cache & Memory Benchmark
Read.59.471MB/s
Write.70.300MB/s
Copy.56.522MB/s
Latency 45.8ns
DDR4 4800 Memtest Pro 燒機

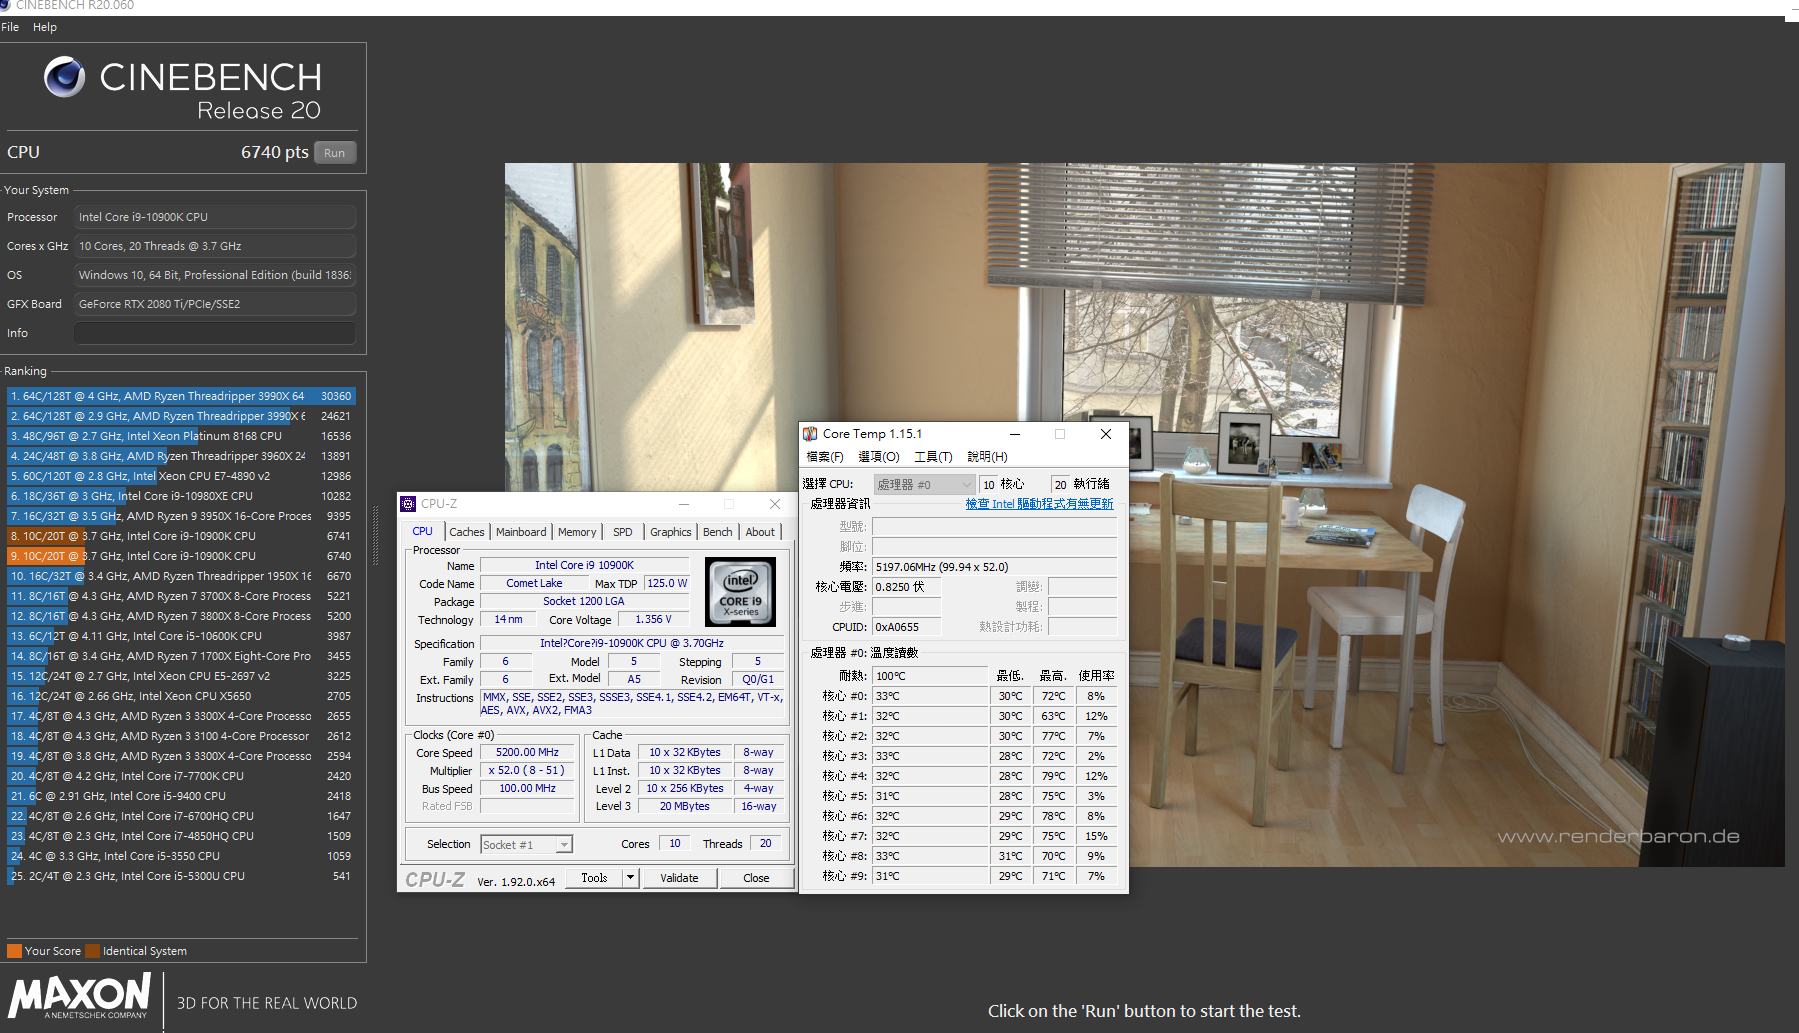
b.10900K@All Core 5.2GHz Cinebench R20 CPU Test
CPU Test nT 6740pts
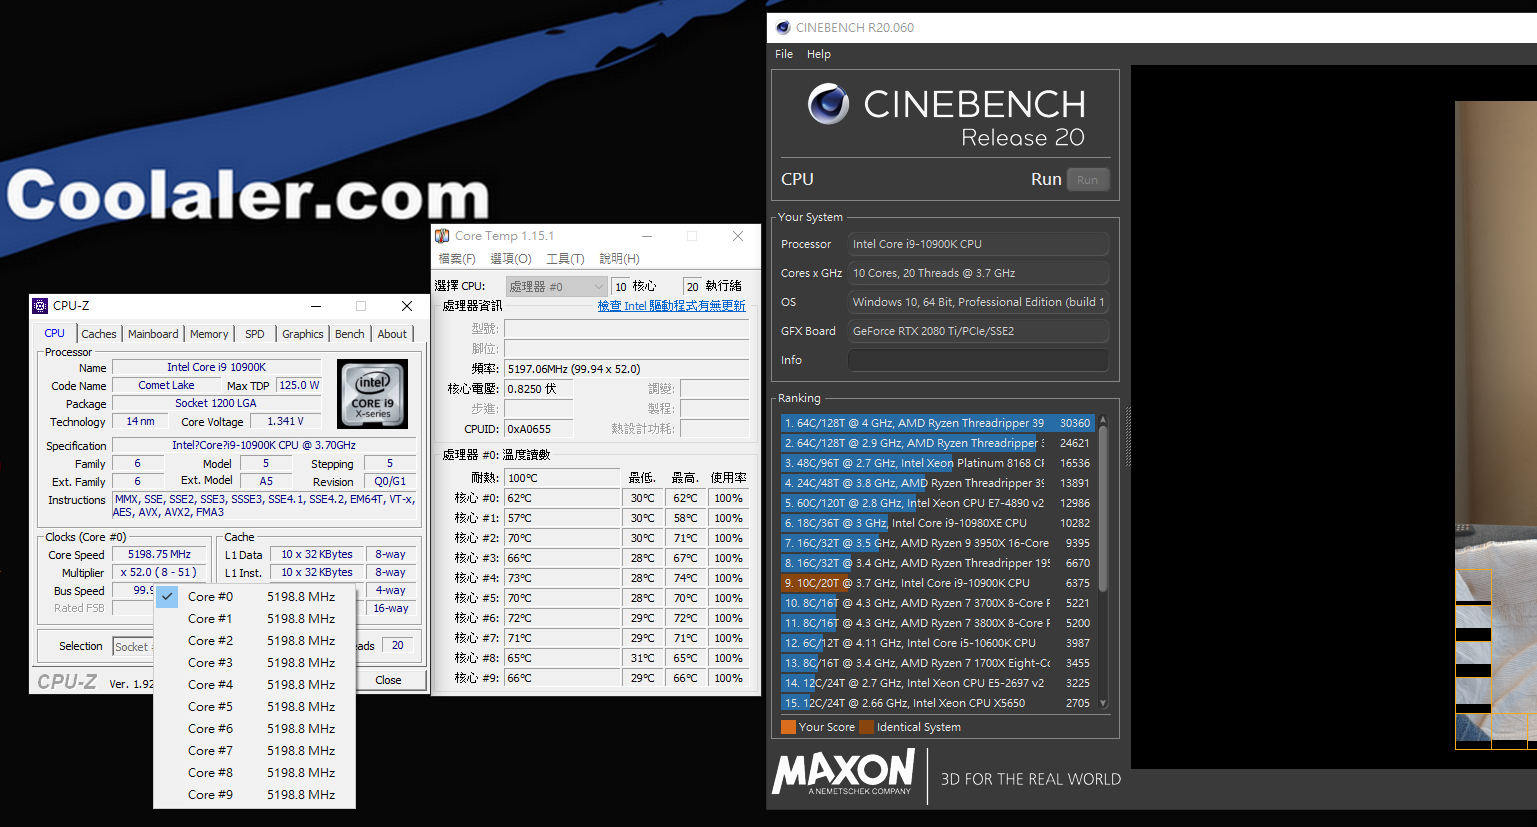
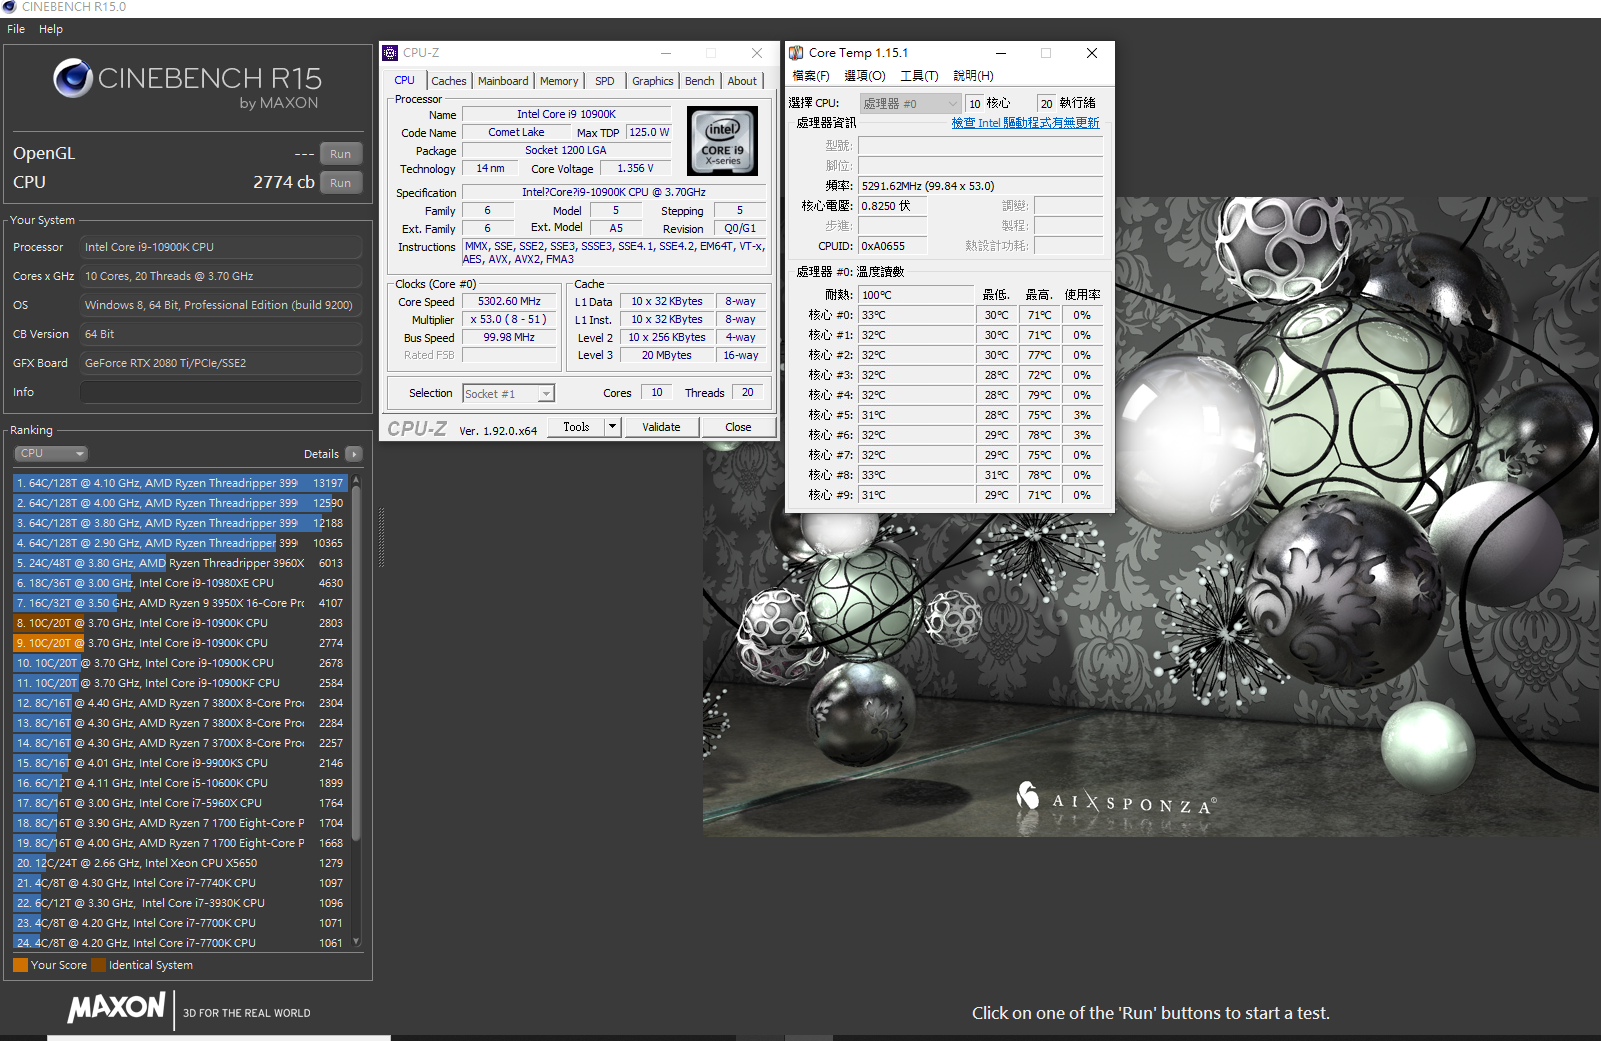
c.10900K@All Core 5.3GHz Cinebench R15 CPU Test
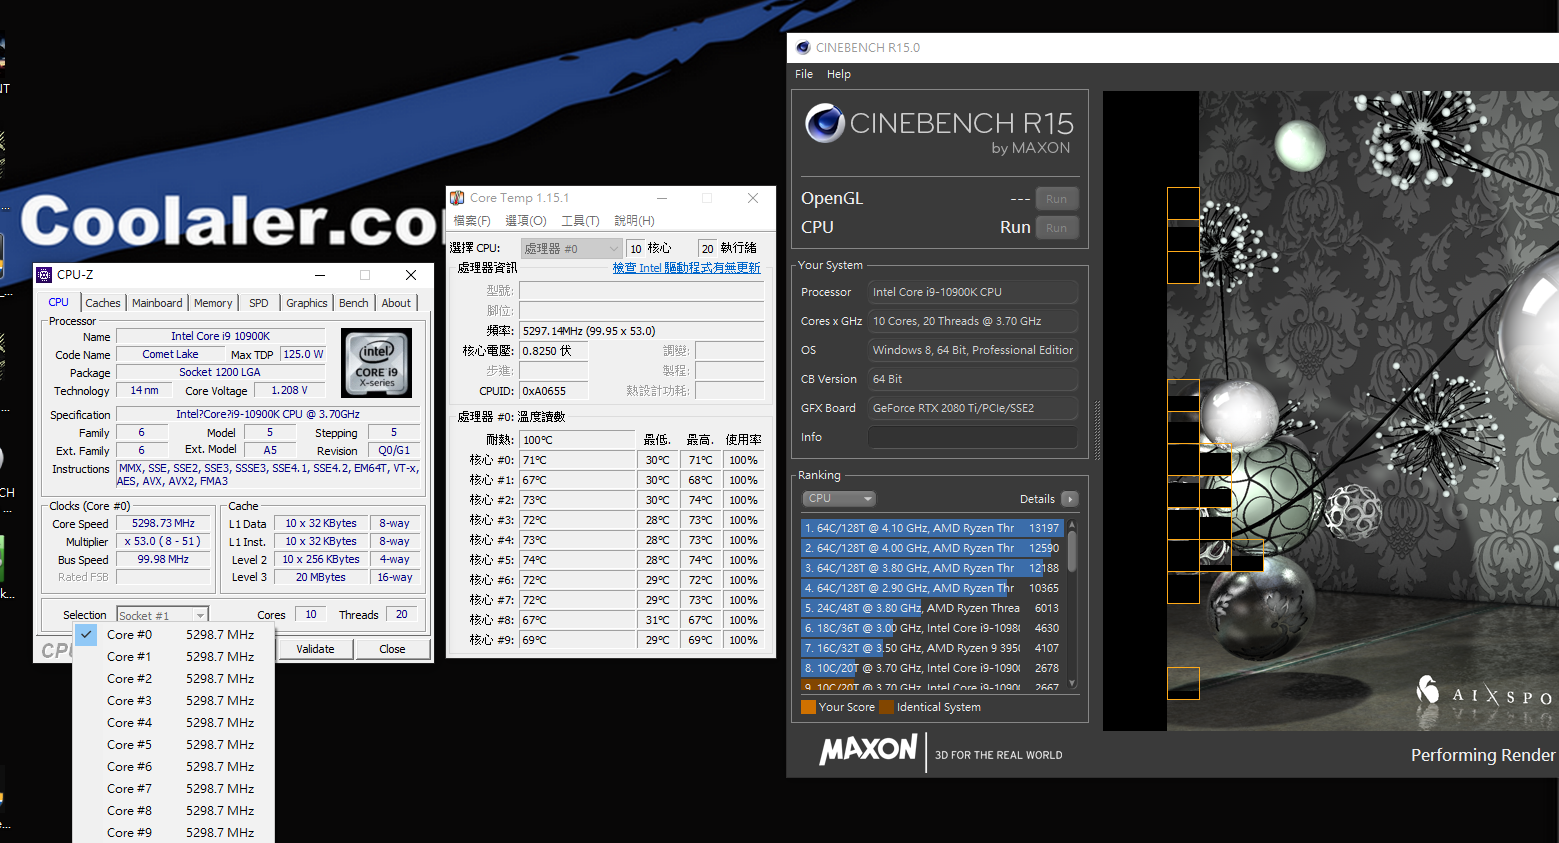
CPU Test nT 2774cb
Ending:
GIGABYTE Z490 AORUS XTREME 身為技嘉最頂級的主機板除了用料完全不手軟之外,在記憶體超頻方面也比上一代進步,在不須使用特別版 BIOS的情況下就能 DDR4 4800 C19 8GBX2直開 ,雖然暫時無法 DDR4 5000 但其在 DDR4 4800 C19 8GB X2 的頻寬表現則是滄者在這一波測過的主機板當中表現最佳的,可見 Z490 AORUS XTREME 在效能方面的調校是令人激賞的,不過記憶體的超頻也需取決與於 IMC 的強弱以及記憶體模組廠牌顆粒
表10:DDR4 4000 C18 VS DDR4 4800 C19@Core i8-10900KF Compare
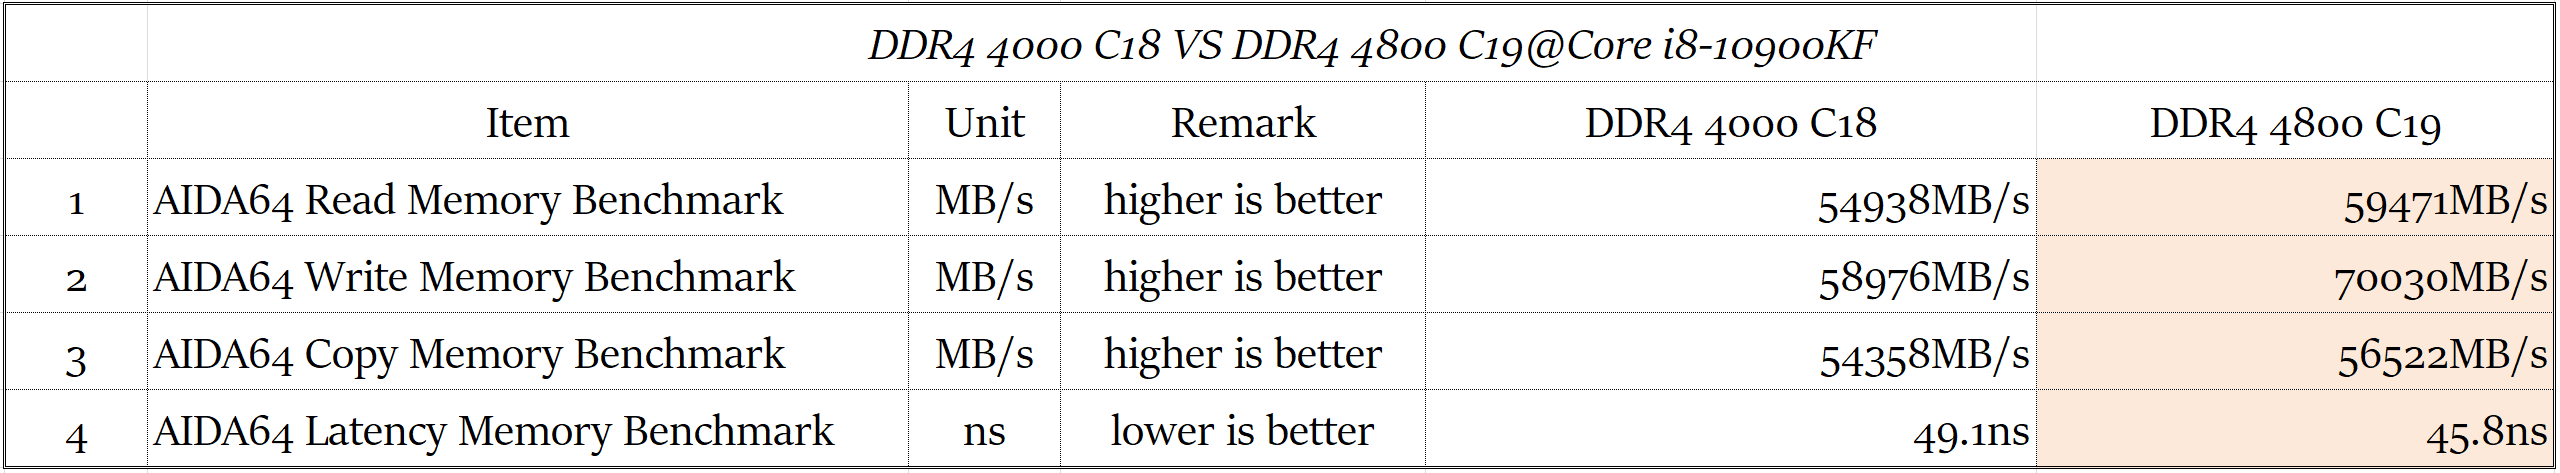
表11:MOBO Compare@DDR4 4800 C19
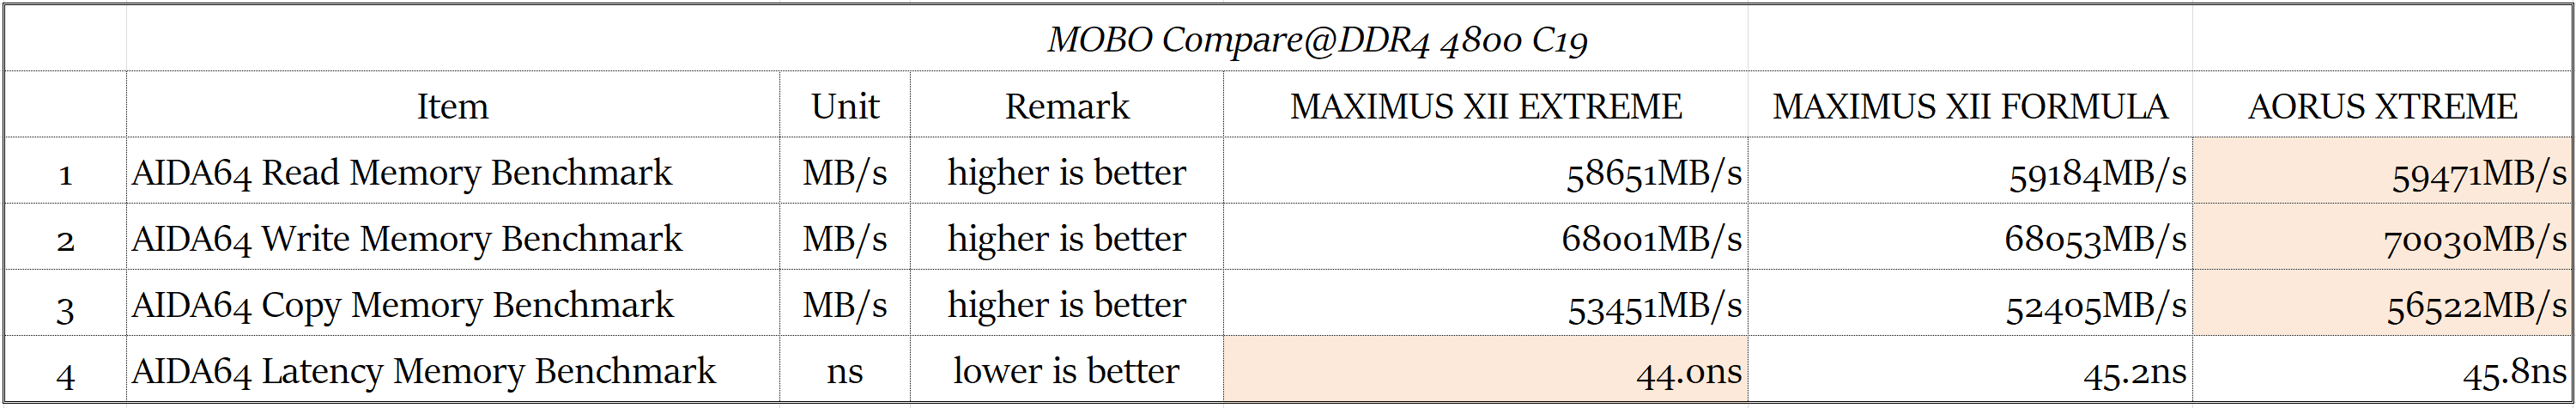
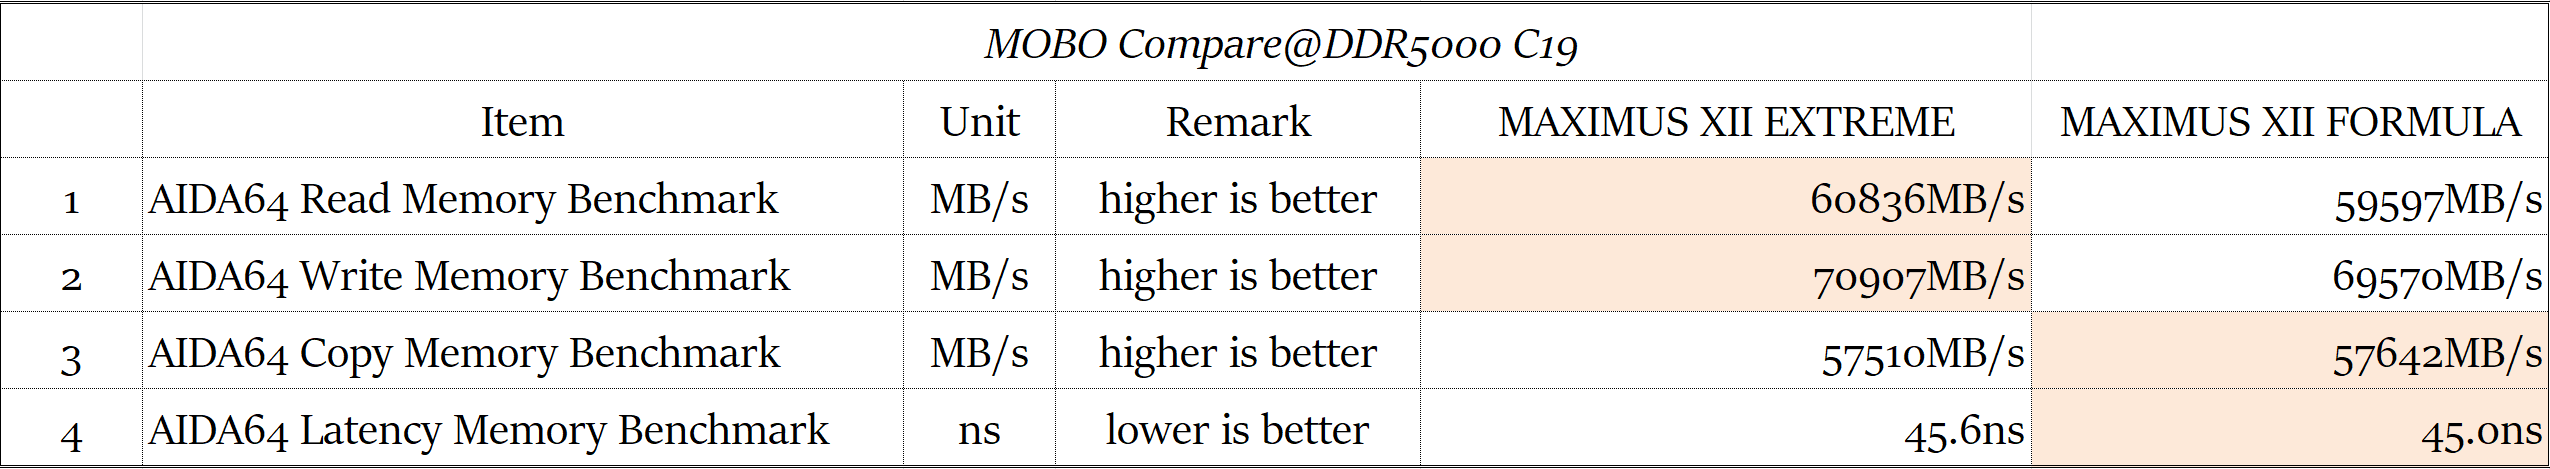
表12:MOBO Compare@DDR4 5000 C19
經過冗長的測試,最後來做一個總整理
先來看表1:10900K Real Frequency
從表1在各項的數據可以看到
1.Core i9-10900K 在預設時待機的頻率是 4.9~5.3GHz (可按連結看圖)
2.Core i9-10900K 在預設時進行單工測試的頻率是 4.9~5.3GHz (可按連結看圖)
3. Core i9-10900K 在預設時 Full Loading 的頻率是 All Core 4.9GHz
4. Core i9-10900K 在超頻至 All Core 5.0GHz 時在所有的 Full Loading 測試過程中 (包含多工以及內容創作) 均為 All Core 4.9GHz (也就是說 Core i9-10900K超頻到 All Core 5.0GHz時與預設時的 Core i9-10900K在 Full Loading頻率只有 100MHz的差距)
表1:10900K Real Frequency
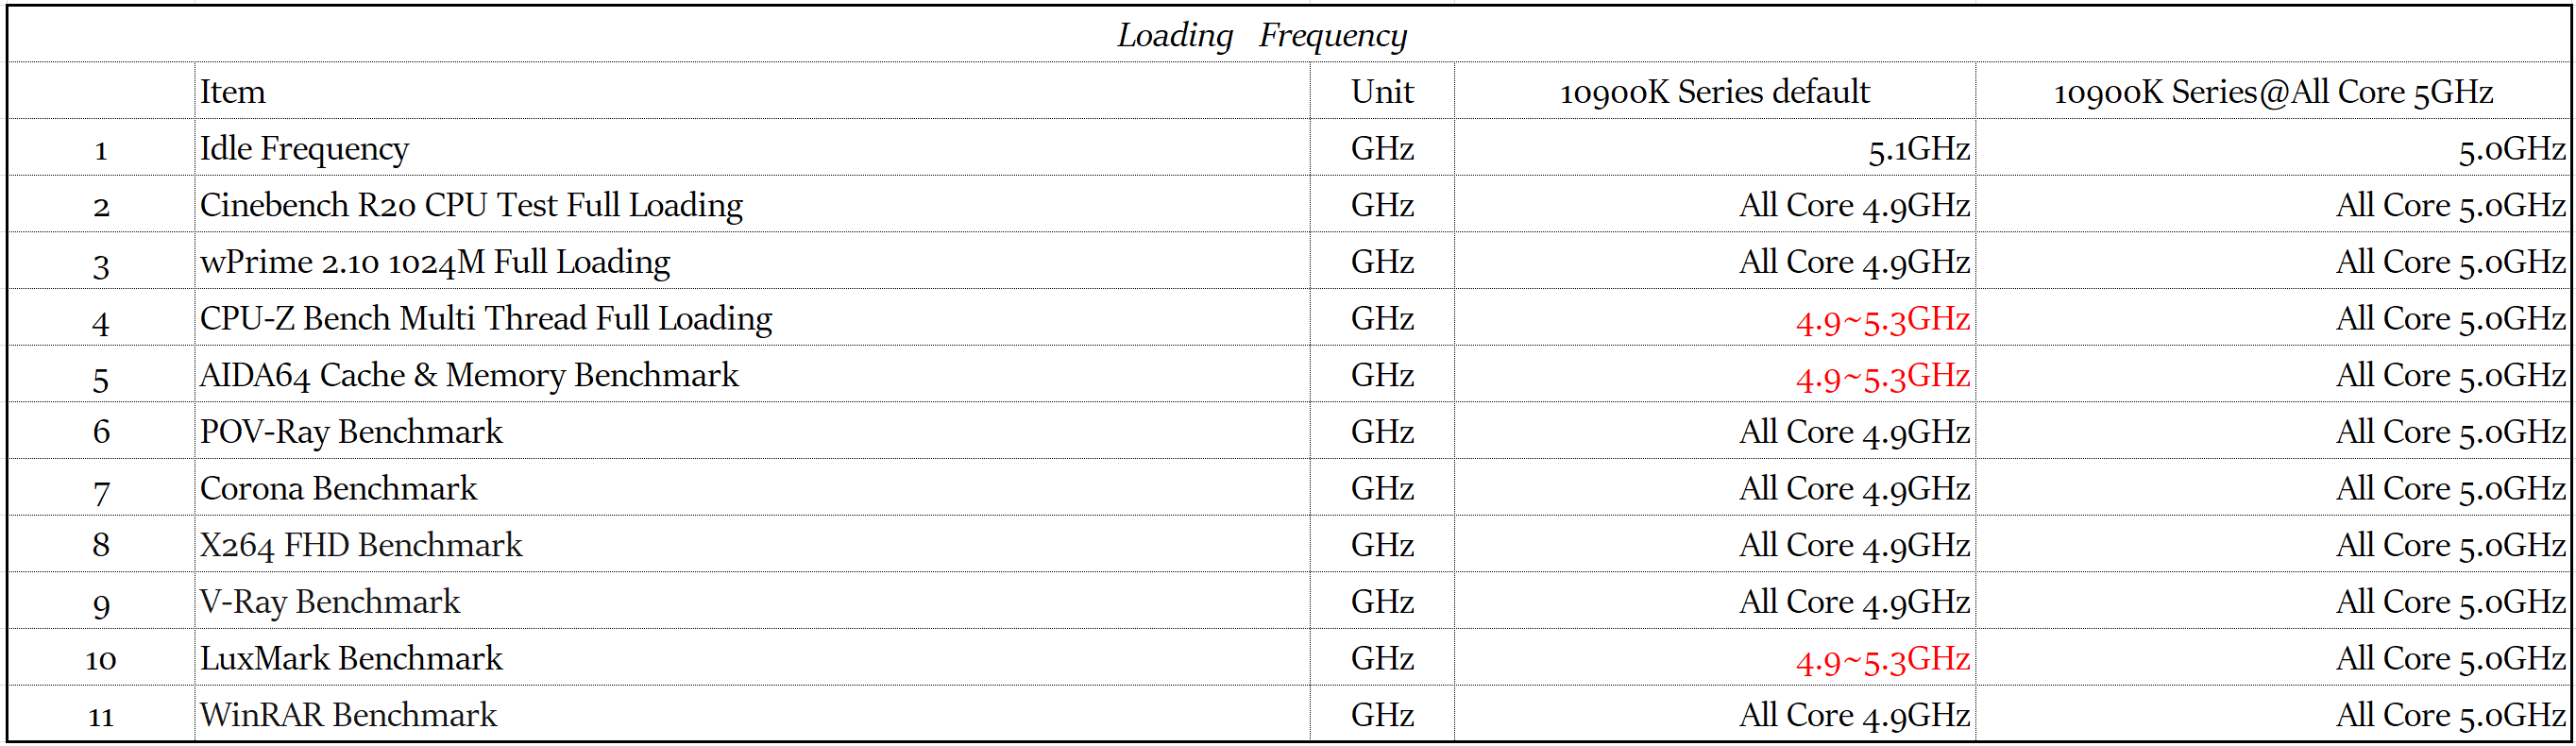
表2則為 Core i9-10900K vs Core i5-10600K在多工與內容創作之測試比較表,黃色區塊內的數據為勝出
表2
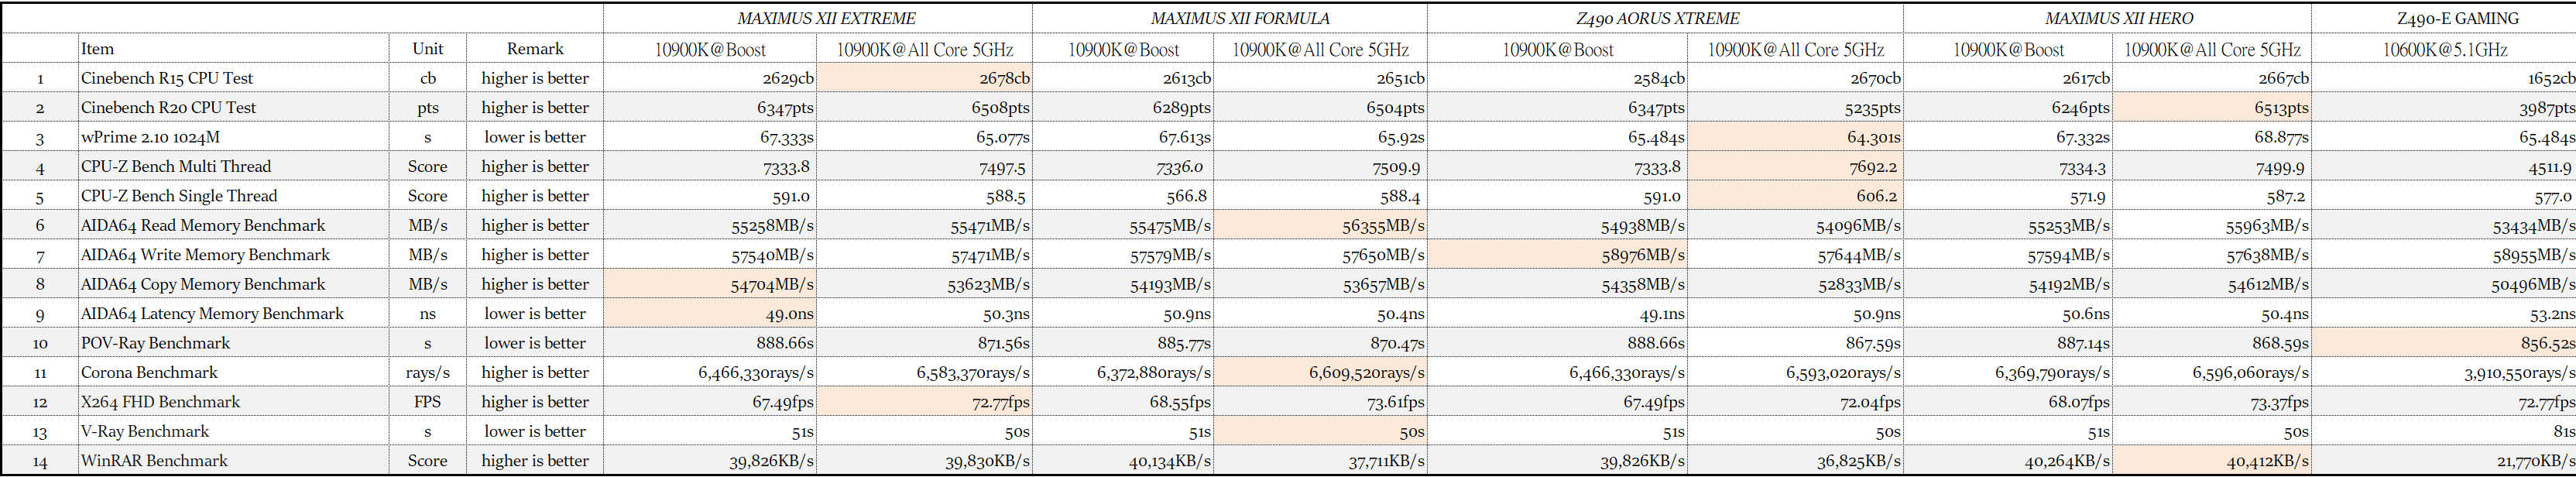
表3則是 PCMark 10 綜合測試比較表,包括
1.「Essentials」 包括 Web瀏覽,視頻會議和應用程序啟動時間
2.「Productivity」包括基於電子表格和寫作的測試
3.「Digital Content Creation」包括照片編輯,視頻編輯以及渲染和可視化測試
表3

接著來看 Core i9-10900K 在遊戲方面的表現,(詳表4、表5、表6)
為了求證 Core i9-10900K 據有地表最快電競處理器的實力,滄者以 29 個遊戲項目對 Core i9-10900K 做測試,並將測試結果與 6~32 Cores 的 7 種不同核心數 8 種處理器在遊戲項目中交叉評比最終 10核心 Core i9-10900K 在 29 個遊戲項目中贏了 24項,6核心 Core i9-10600K 在 29 個遊戲項目中贏了 4 項,18核心 Core i9-10980XE 在 29 個遊戲項目中贏了 1項,Core i9-10900K 實至名歸的成為現今地表最快電競處理器
表4:10900K vs 10600K vs 10980XE vs 9900KS vs 3700X@RTX2080TI O11G 1080P Gaming Compare (1080P Gaming)
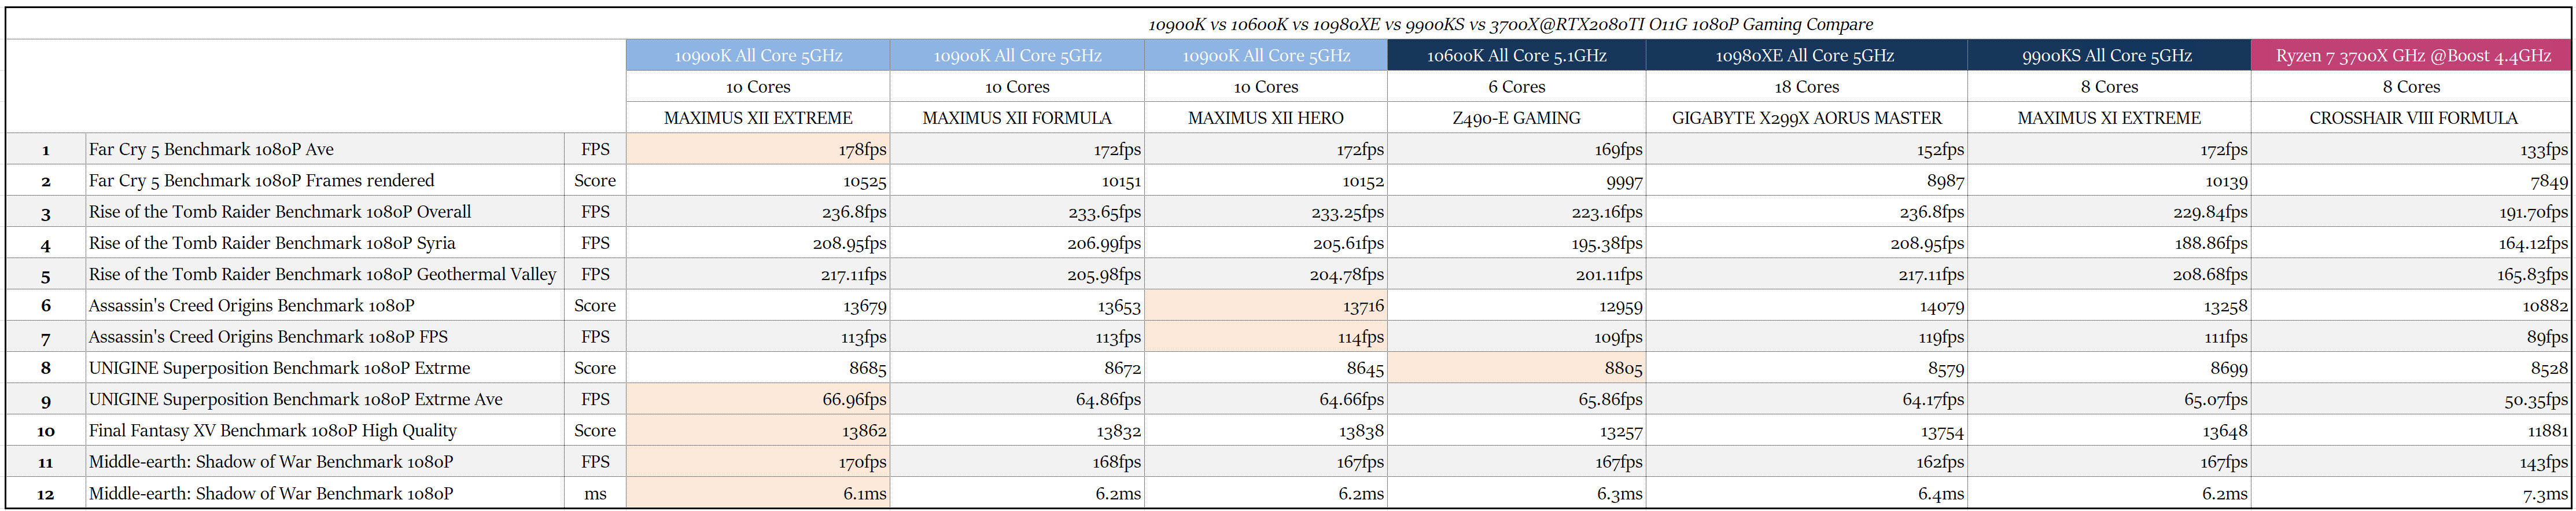
表5:10900K vs 10600K vs 10980XE vs 9900KS vs 3900X vs 3700X@RTX2080TI O11G 1080P Gaming Compare(4K Gaming)
10980XE 3970X 3960X 3900X 3700X之實測圖只放在全新第 10代 Intel® Core™系列處理器初試啼聲,看 i9-10900K 如何在 6~32Cores間之 7種核心數 8種處理器的遊戲評比中勝出,以及在 M12E空冷 5.4GHz DDR4 5000達成請自行前往查閱
表6:10900K vs 10600K vs 10980XE vs 9900KS vs 3970X vs 3960X vs 3900X vs 3700X@RTX2080TI O11G 1080P Gaming Compare
Intel遊戲還是無敵
接著來看表7: Core i9-10900K & Core i5-10600K 在功耗的表現
1. Core i9-10900K在預設待機的功耗為 10.465W
2. Core i9-10900K在超頻至 All Core 5.0GHz時的待機功耗為 30.25W
3. Core i9-10900K在超頻至 All Core 5.0GHz的設定下在 Full Loading全核心的測試中的最大功耗發生在 Stress CPU & FPU的 239.532W
4. Core i5-10600K在超頻至 All Core 5.1GHz時的待機功耗為 25.17W
5. Core i5-10600K在超頻至 All Core 5.1GHz的設定下在 Full Loading全核心的測試中的最大功耗發生在 Cinebench R15 CPU Test的 170.88W
表7:CPU Package Power@All Core Compare

在製程方面 Comet Lake 因為仍維持 14nm 製造而引來使用者對溫度及功耗的疑慮,但經過滄者在只是以空冷塔式散熱器對 Core i9-10900K 散熱的情況下 ,就能讓 Core i9-10900K 在 Vcore 1.18v 及「「All Core 5GHz」的設定下輕鬆的完成多工及內容創作測試,而且效能表現完全不受到 TDP或溫度高的影響 (溫度請詳表13),代表這一次全新第 10代 Intel Core 處理器增加 IHS 厚度並降低 CPU die 的做法是成功的
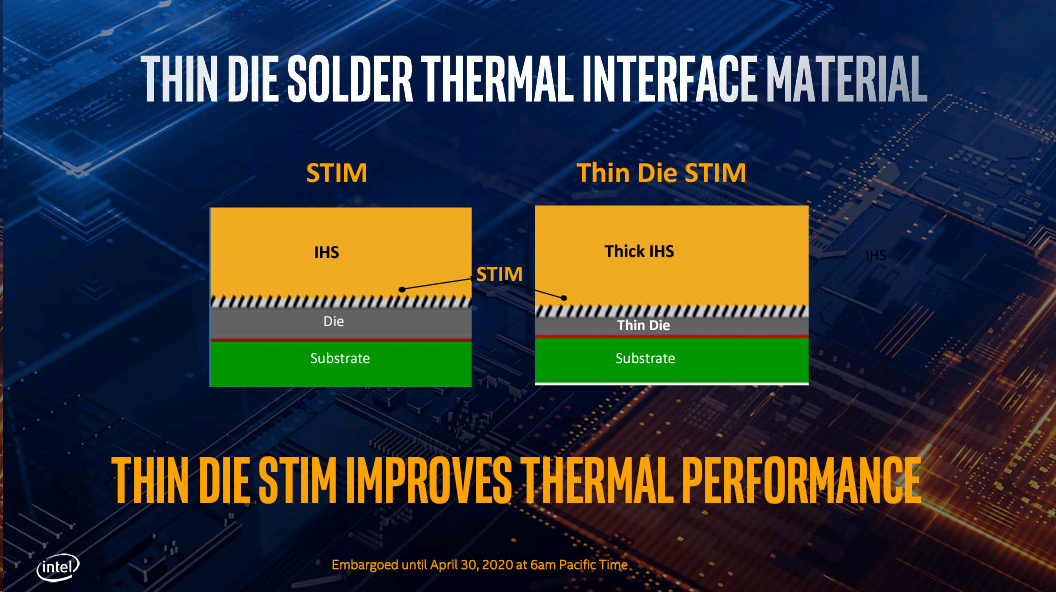
表13: CPU Temp when loading

但 Core i9-10900K 的能耐還不僅如此,如果要繼續往上超頻的話只需注意處理器電壓的設定與風扇轉速,成功的將 Core i9-10900K 超頻到 5.4GHz 將不是夢想
表8為 Core i9-10900K All Core 5.3GHz vs Core i5-10600K 的比較
表8

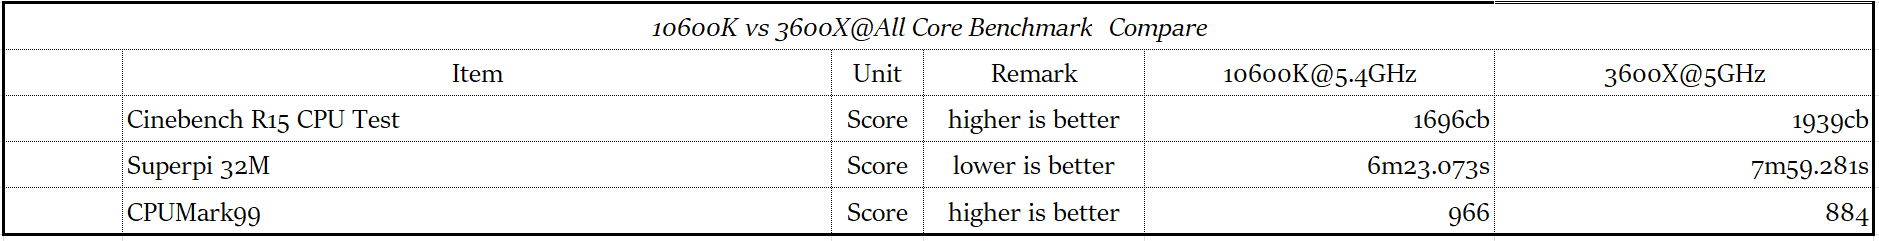
表9為 Core i5-10600K All Core 5.4 GHz vs Ryzen 3600X 5.0GHz的比較
表9
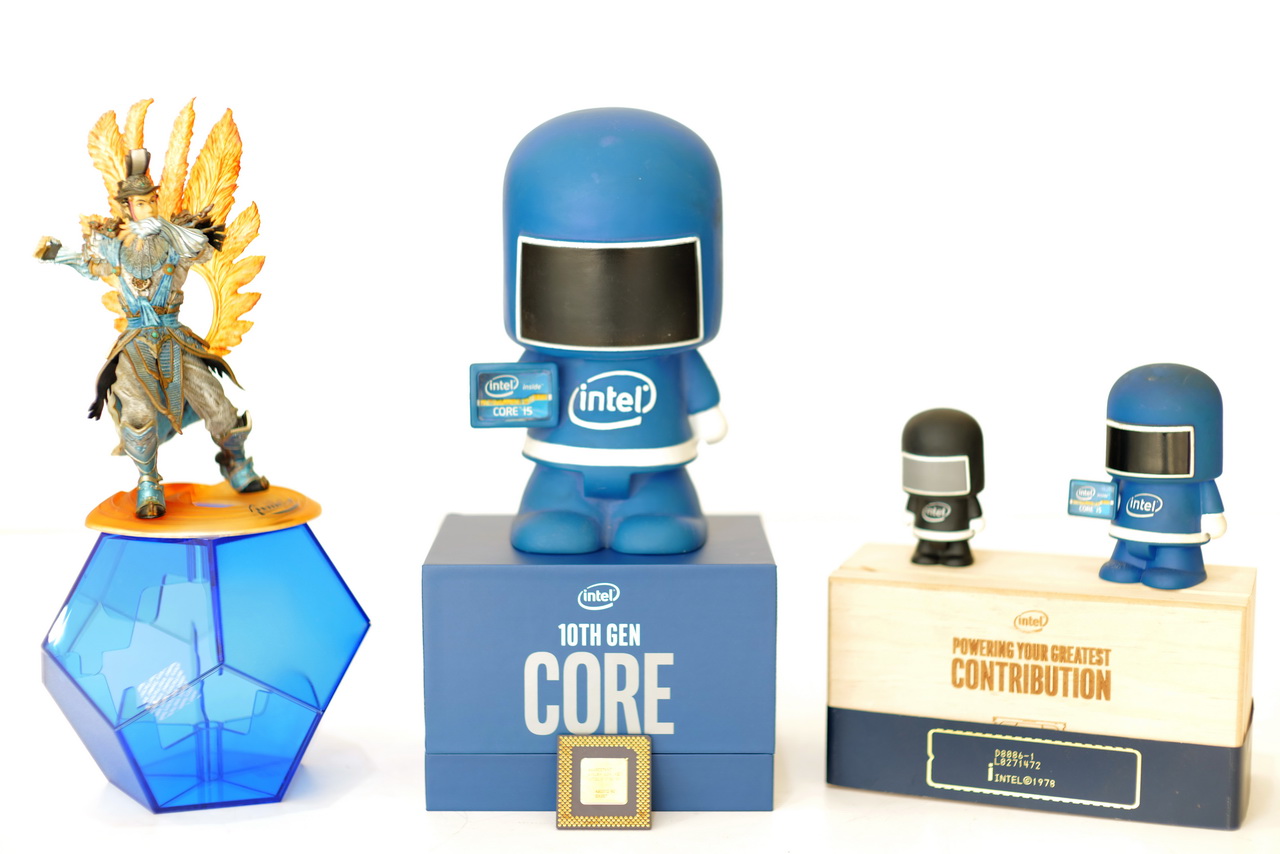
在不論是哪個品牌的處理器只是在比誰的核心數更多而忽略了頻率更重要的當下,全新第 10代 Intel Core桌上型處理器的出現提供了內容創作者與遊戲玩家的新選擇, Core i9-10900K 適合 Creator 與 Gmaer,而 Core i5-10600K 則能給 Overclocker 帶來超頻的樂趣,即使 Core i9-10900K 的最大功耗達 239W,也絲毫不影響全新第 10代 Intel Core桌上型處理器對增進處理器頻率和控制散熱所做的貢獻,在頻率等同效能頻率高效能就高的前提之下 TDP 就算多個十幾二十瓦就隨他吧,最後還記得 Intel 公仔嗎?滄者在個人評測生涯中也有幸收集了幾個與您分享,謝謝收看