前言:
早先在台灣時間 1/4 10:30 AMD總裁暨執行長蘇姿丰博士 (Dr. Lisa Su) 曾於 CES Keynote 2023中發表了採用 3D V-Cache技術的「Zen 4」 Ryzen 7000X3D系列處理器已於今日效能解禁,滄者在第一時間亦取得了 Ryzen 9 7950X3D的 sample,並將搭配 GIGABYTE RTX4090 GAMING OC 24G以及 GIGABYTE X670E AORUS MASTER為您奉上開箱測試,其測試數據並將與 Intel Core i9-13900KS、Core i9-13900K及 Ryzen 9 7950X處理器做比較,敬請持續關注
AMD Ryzen 7000X3D系列 Raphael-X處理器首批上市的兩款處理器均瞄準高階市場,分別是 Ryzen 9 7950X3D 、 Ryzen 9 7900X3D,而中階的 Ryzen 7 7800X3D則將於稍後的 4/6推出
Ryzen 7000X3D系列處理器採用的並非是第二代 3D V-Cache技術,但仍大幅度的加大了L3 Cache,且比上一代的 5800X3D多了許多;跟 Ryzen 7000系列處理器相比,Ryzen 7000X3D系列處理器會在每個「Zen 4」架構之 CCD上增加額外的 64MB Cache,因此擁有比 Ryzen 7000系列處理器有更高的頻寬,額外的 64MB Cache並會使 Ryzen 7000X3D系列處理器之效能及更低的延遲,相對 Ryzen 7000系列處理器有 10%到 15%幅度的提升
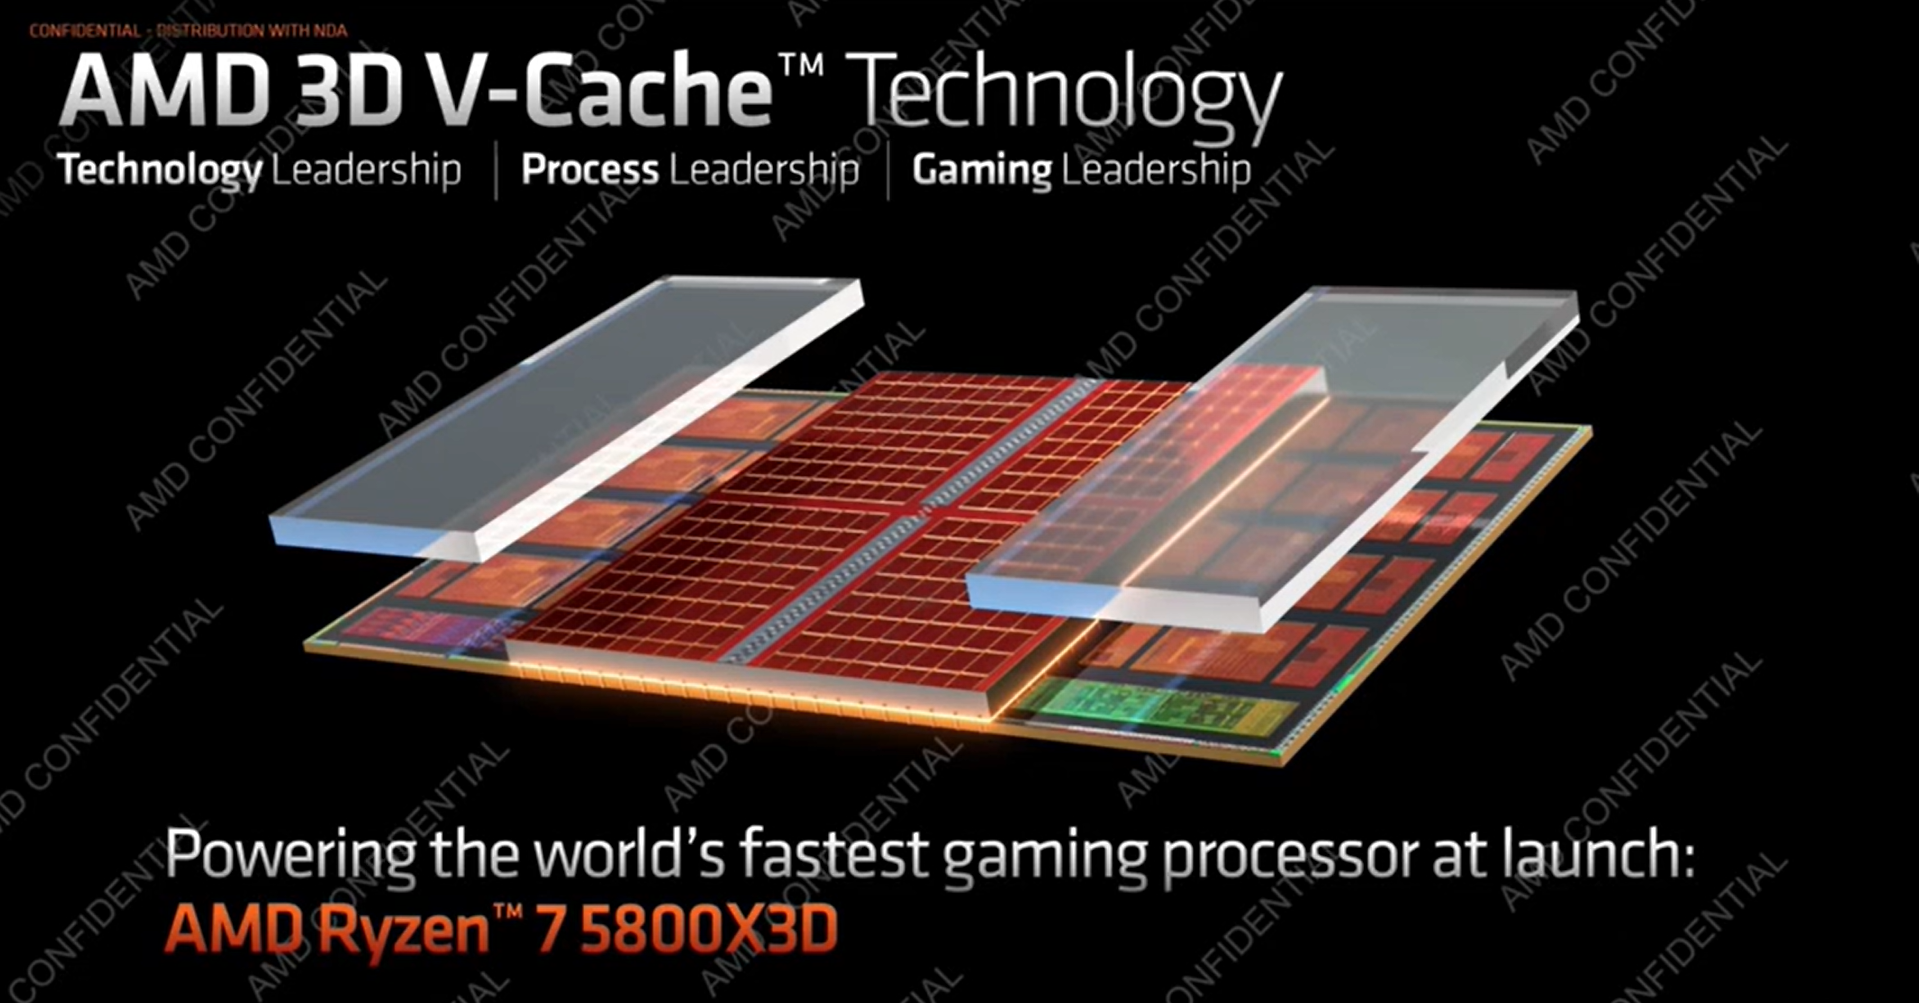
Dr.蘇讓 AMD自 2017推出第一代 Ryzen桌上型處理器發表至今已經 5年多,Ryzen桌上型處理器由漸入佳境至碩果累累,Ryzen桌上型處理器一代強於一代之效能也有目共睹,AMD秉持突破再創新,並以 AMD 3D V-Cache技術繼續作為進階封裝技術的領導者,以創造世界上最快的遊戲桌上型電腦處理器和世界上效能最高的技術運算伺服器處理器,繼續引領遊戲與內容創作之高性能先驅,以滿足使用者需求,在 Ryzen 7000X3D系列處理器開賣在即之時,且讓我們來看看 AMD 3D V-Cache技術細節有哪一些優勢
AMD Ryzen 9 7950X3D的台幣價格為 22,950元,AMD Ryzen 9 7900X3D的台幣價格為 19,950美元

⇧AMD Ryzen 9 7950X3D的價格為 699美元,與 Ryzen 9 7950X發布時售價相同,不過目前 7950X已經調降不少,而 Ryzen 9 7900X3D售價是 599美元,相比 Ryzen 9 7900X發布時的 549美元要高出 50美元。Ryzen 7 7800X3D售價 449美元,相比 Ryzen 9 7900X的 429美元還要高,三款 Ryzen 7000X3D處理器與目前 Ryzen 7000系列一樣都會搭贈《星際大戰 絕地:倖存者》遊戲做促銷
高階款的 AMD Ryzen 7000X3D系列處理 Ryzen 9 7950X3D與 Ryzen 9 7900X3D將先於明日 2/28上市開賣

而中階的 AMD Ryzen 7 7800X3D則將於稍晚的 4/6上市開賣

AMD Ryzen 7000X3D系列處理器在降低了 TDP功耗的情況下卻仍然能再提升效能靠的是 3D V-Cache終極的技術
AMD Ryzen 7000X3D系列處理器所增加的 3D V-Cache均封裝於同一 CCX,而另一個未增加 3D V-Cache之 CCX則如同 Ryzen 7000系列處理器一般,只負責提供頻率的部分

AMD Ryzen 7000X3D處理器的兩個 CCX各司其職

一個 CCX主管高頻率 (沒有 3D V-Cache的 CCX),就是標準的原生 CCX,另一顆則是擁有 3D V-Cache的 CCX,兩種 CCX分別使用兩種驅動程式,採用動態模式技術並視情況選擇最有利的 CCX執行務以提供 Ryzen 9 7950X3D處理器最佳效能

AMD Ryzen 9 7950X3D處理器的兩個 CCX各司其職,並由兩種不同的驅動程式來負責分配效能
一個驅動程式負責已增加 3D V-Cache的 CCX效能

另一個驅動程式則負責原始 CCX在針對提升頻率及超頻方面的效能控管

新的 7000X3D多了幾個超頻選項,不似 5800X3D只能對記憶體超頻

身為全世界最佳的遊戲與內容創作處理器,AMD Ryzen 7950X3D擁有 16 Cores/32 Threads,5.7GHz Boost,120W TDP,144MB L2+L3 Cache
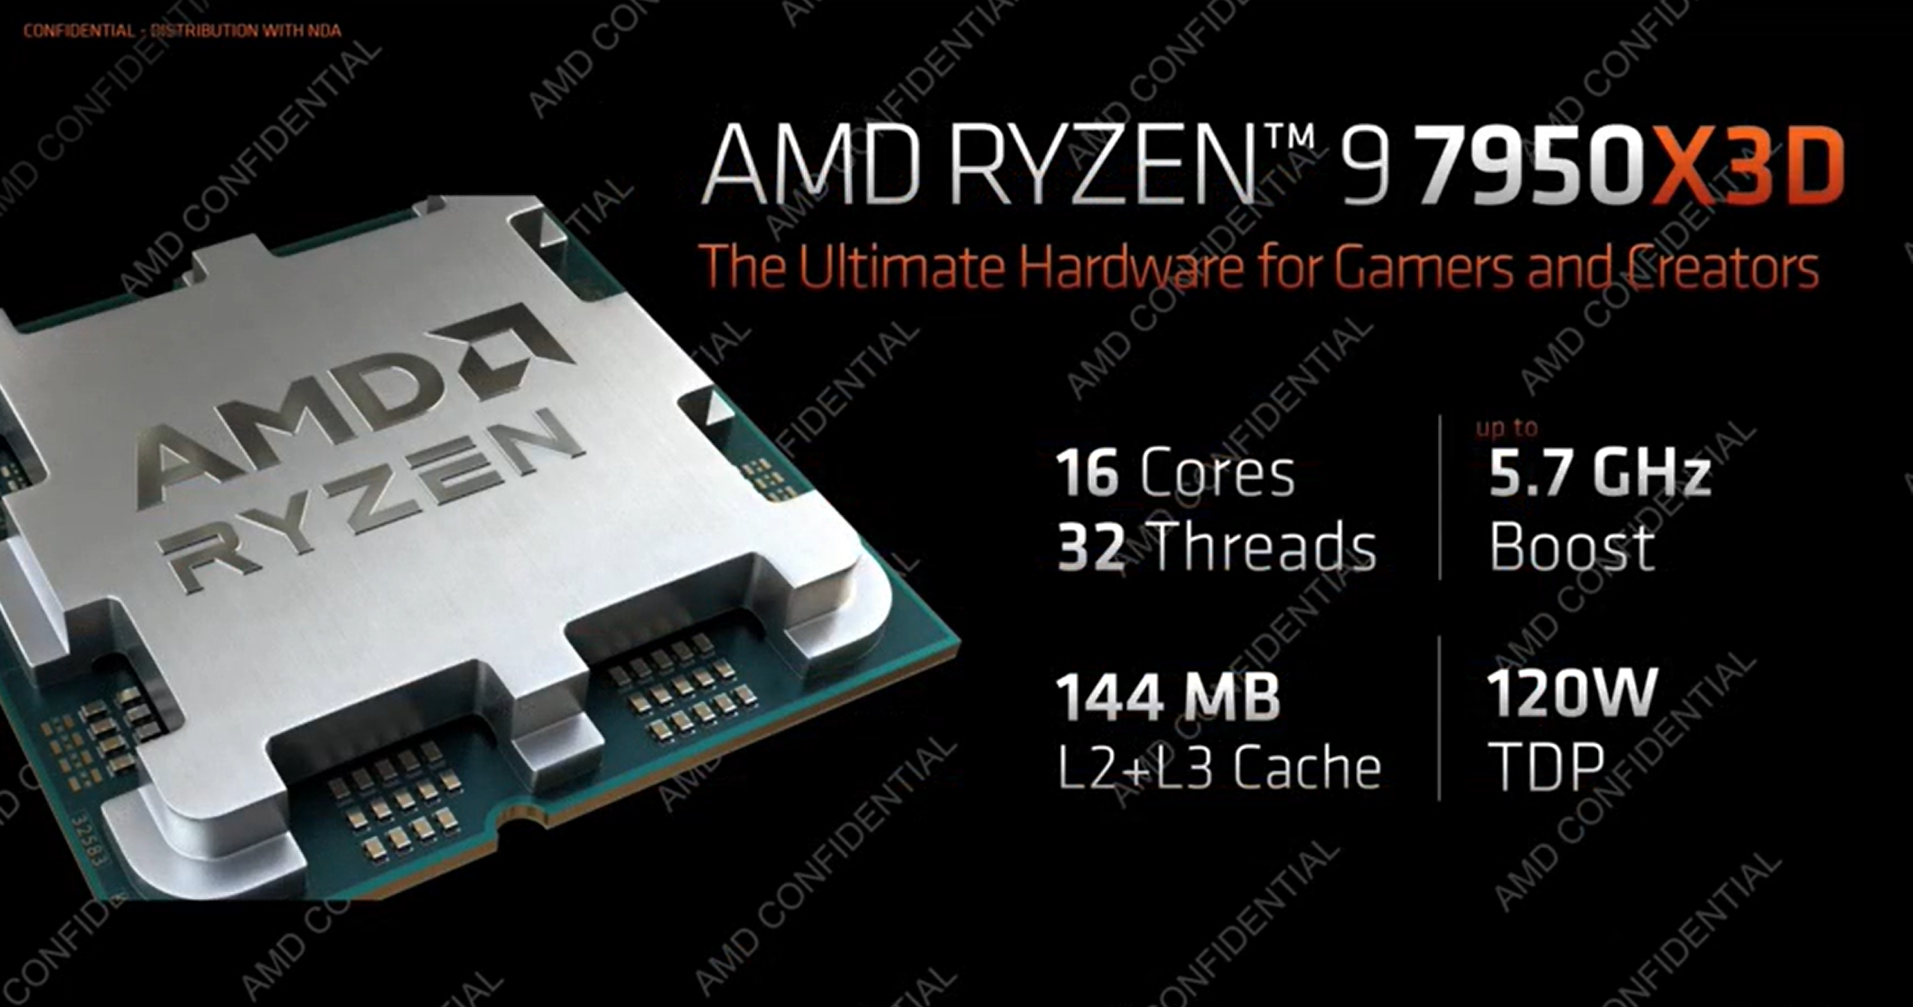
Ryzen 9 7950X3D諸元

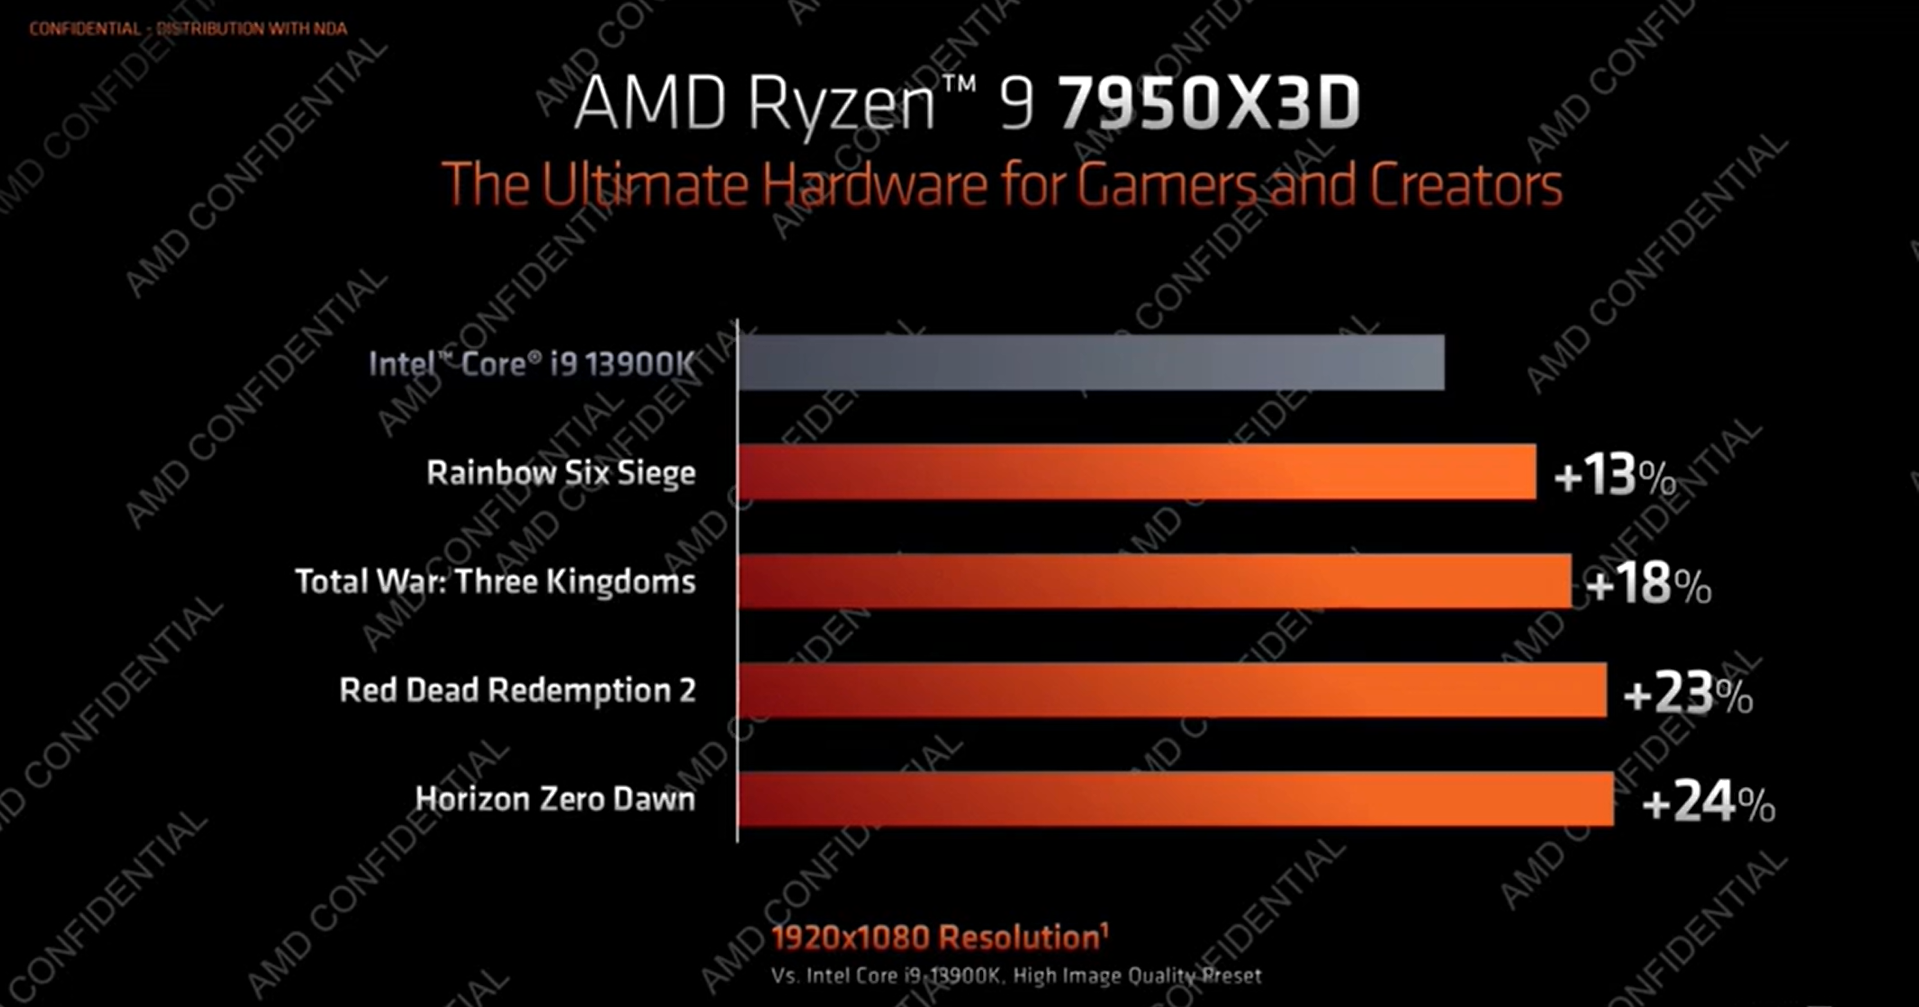
Ryzen 9 7950X3D在諸項遊戲中的效能提升幅度

Ryzen 9 7950X3D雖然 Cache加大了,但是 TDP反而降低了

AMD Ryzen 7 7950X3D VS Core i9-13900K在底下 4款遊戲效能中有 13~24%的領先
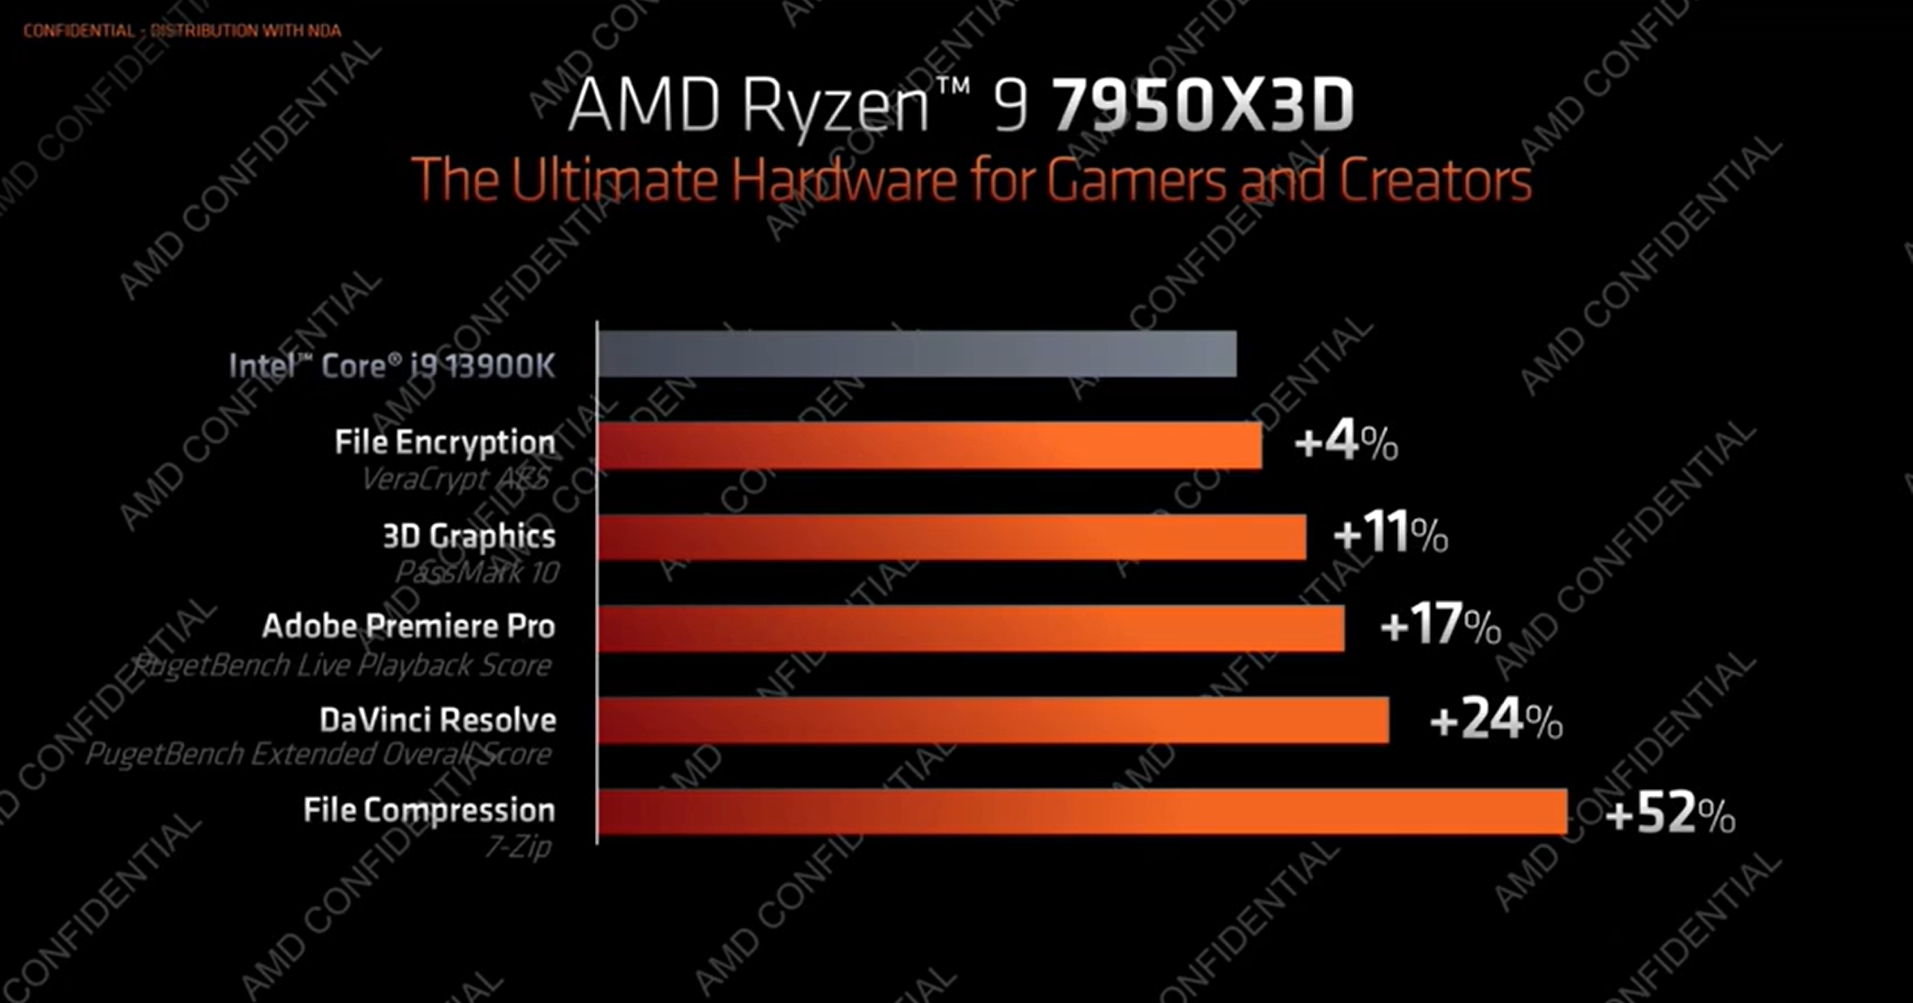
AMD Ryzen 7 7950X3D VS Core i9-13900K在底下 4款內容創作效能中有 4~52%的領先
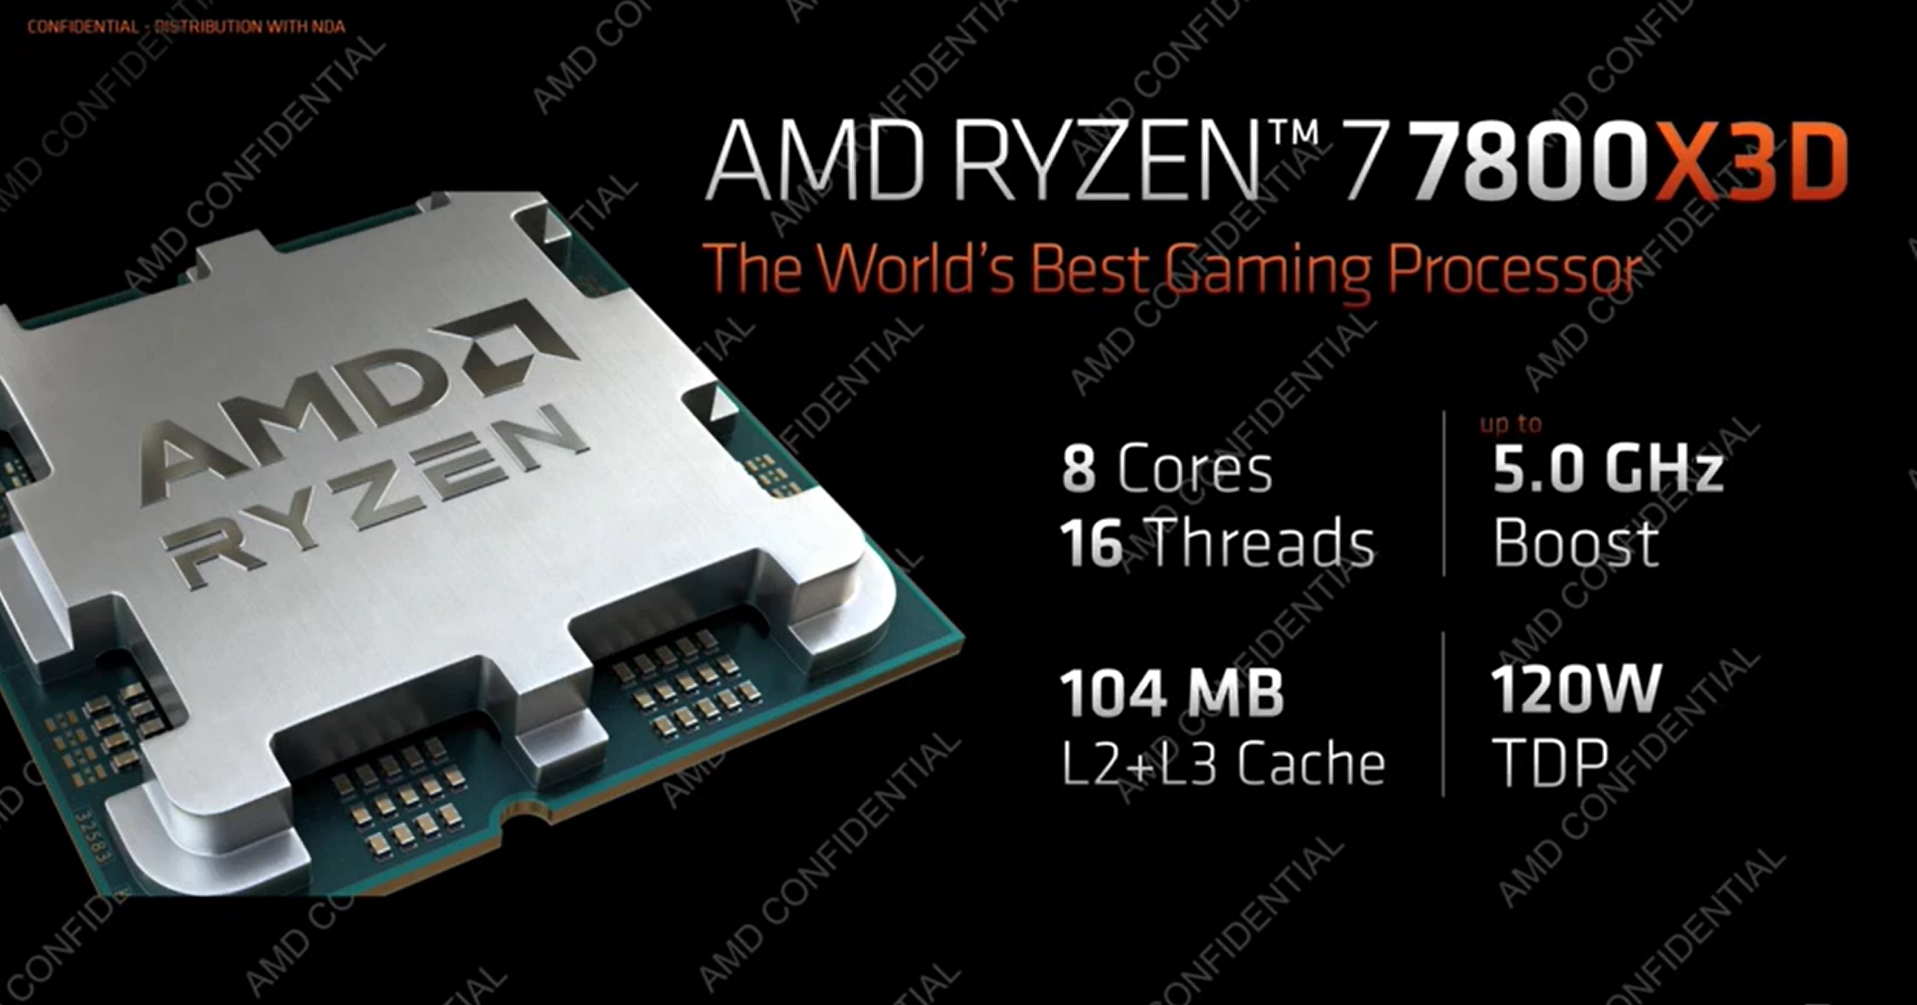
身為全世界最佳的遊戲處理器,AMD Ryzen 7 7800X3D擁有 8 Cores/16 Threads,5GHz Boost,120W TDP,104MB L2+L3 Cache
⇧Ryzen 7 7800X3D將於 4/06推出
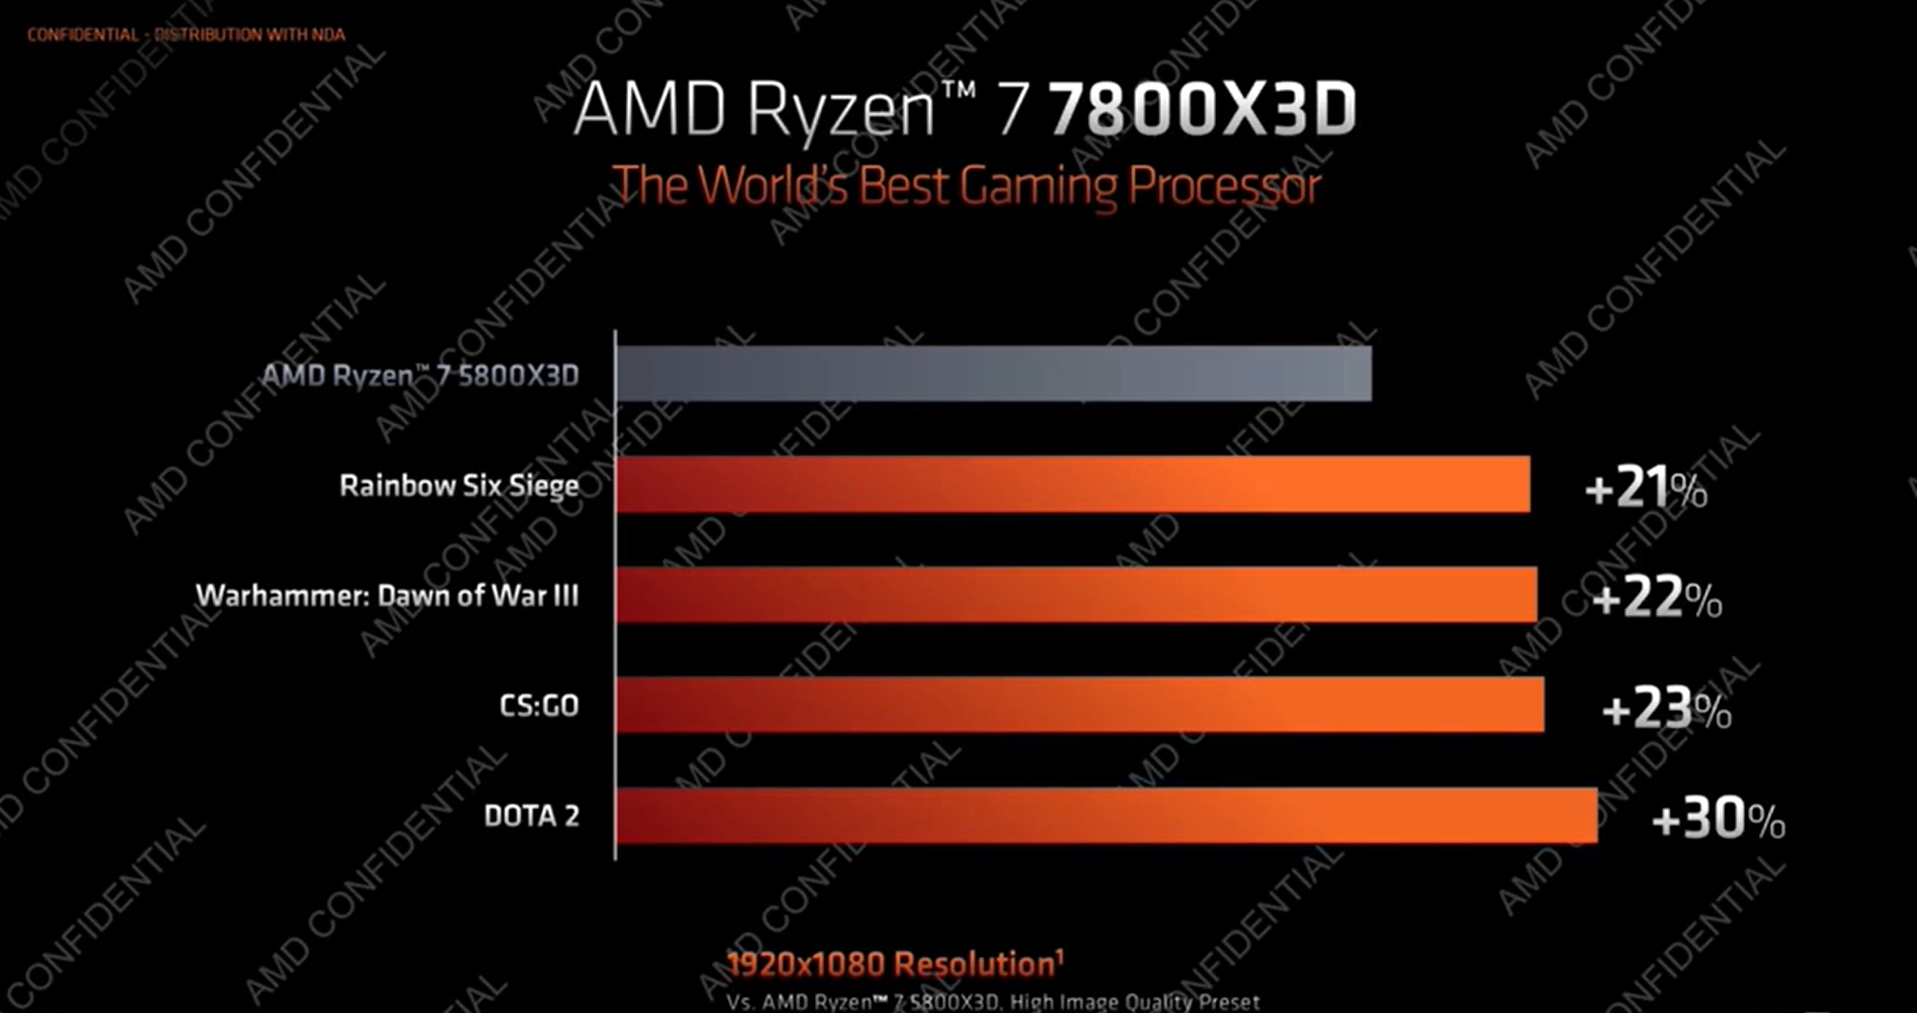
AMD Ryzen 7 7800X3D VS Ryzen 7 5800X3D在底下 4款遊戲效能中有 21~30%的提升
AMD的優勢是一塊主機板可以讓您使用非常多代的處理器,即便比較貴但以長遠考量仍然是非常超值

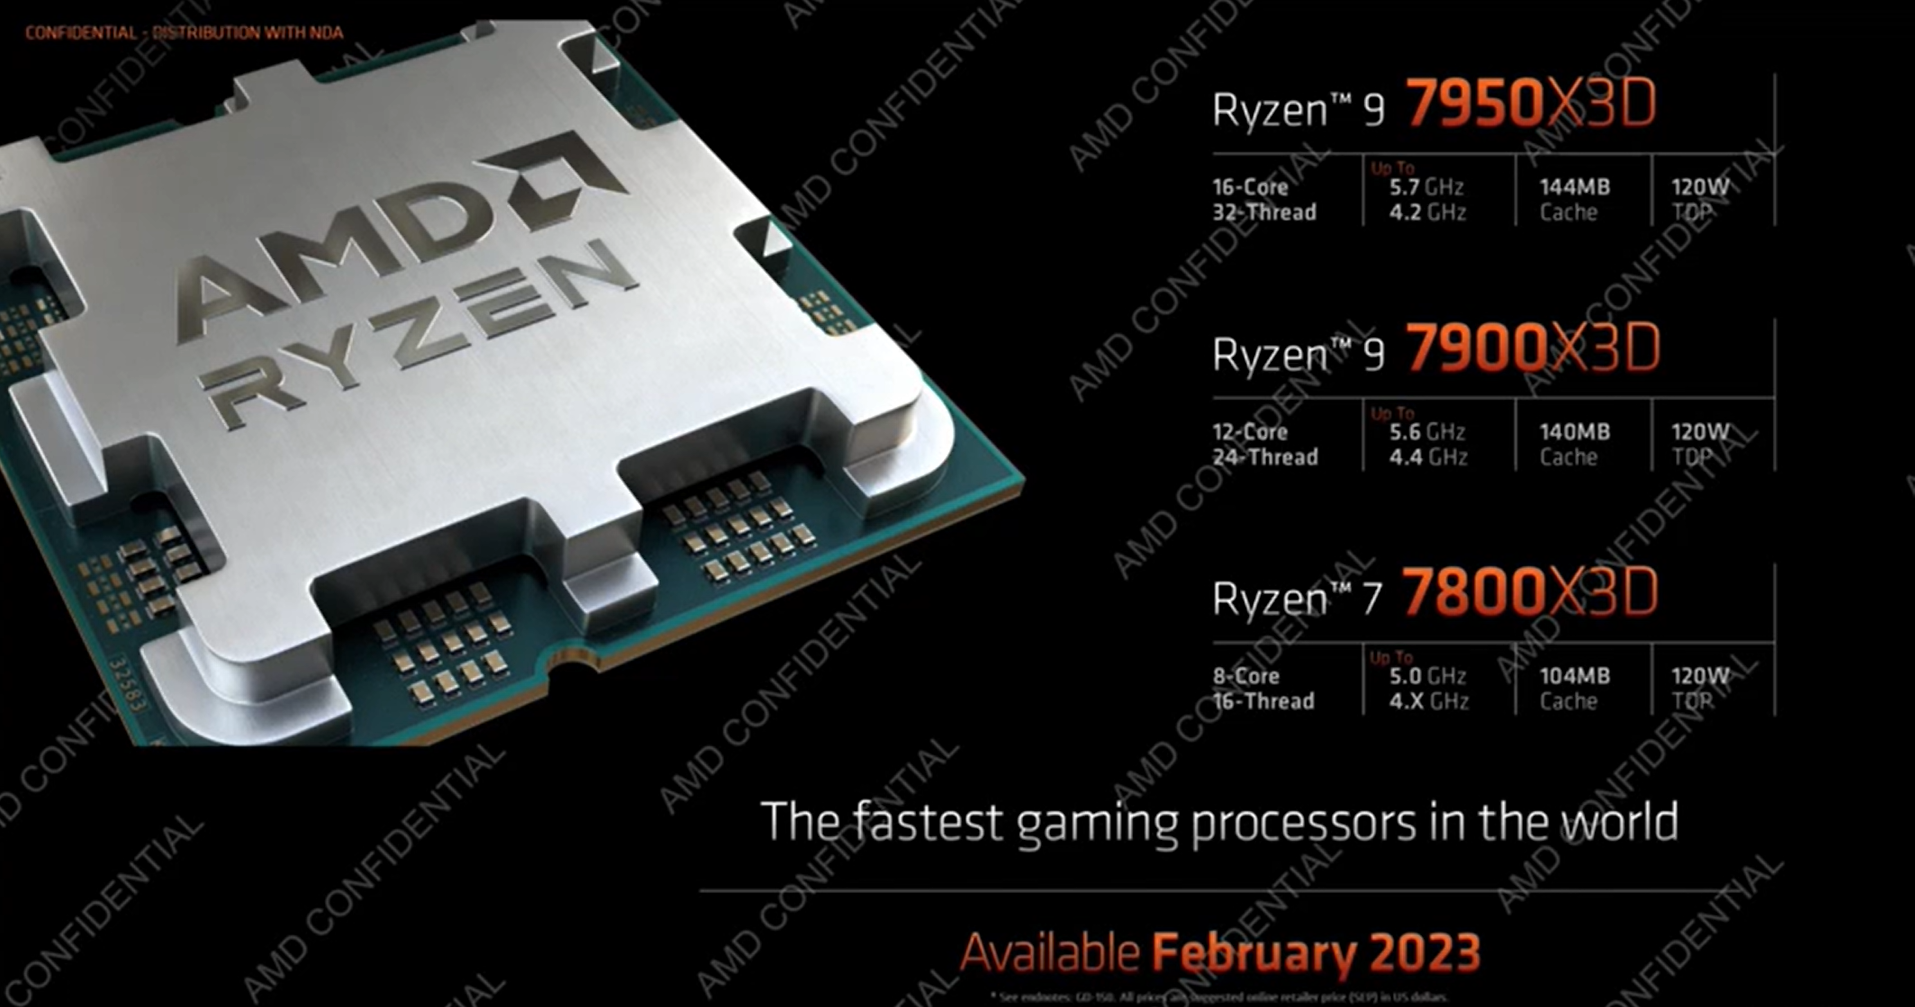
Ryzen 70003D系列處理器之諸元與售價

AMD Ryzen 9 7950X3D
16 Cores/32 Threads,5.7GHz Boost,120W TDP,144MB Cache
AMD Ryzen 9 7950X
16 Cores/32 Threads,5.7GHz Boost ,170W TDP,80MB Cache
AMD Ryzen 9 7900X3D
12 Cores/24 Threads,5.6GHz Boost,120W TDP,140MB Cache
AMD Ryzen 9 7900X
12 Cores/24 Threads,5.6GHz Boost,170W TDP,76MB Cache
AMD Ryzen 7 7800X3D
8 Cores/16 Threads,5GHz Boost,120W TDP,104MB Cache
AMD Ryzen 7 7700X
8 Cores/16 Threads,5.4GHz Boost,105W TDP,40MB Cache
AMD Ryzen 7000X3D系列處理器有 Ryzen 9 7950X3D 、 Ryzen 9 7900X3D 、Ryzen 7 7800X3D ,比只有一款 5800X3D有更全面的布局
Ryzen 9 7950X3D在預設與開啟曲線優化與曲線優化加上 PBO不同之效能比較

雖然 TDP降低了,但每瓦的效能比反而增加

測試元件:
CPU: Ryzen 9 7950X3D彩盒,Ryzen 7000X3D系列處理器採用了新的零售包裝設計,與之前的 Ryzen 7000系列處理器並不相同

⇧新包裝用了色調更明亮的橙色色塊來標示處理器本體與型號規格,左上方的銀色三角形區塊則標示了「支持 AMD 3D V-Cache技術」可一眼即識別出其為支援 3D V-Cache技術的處理器
Ryzen 9 7950X3D彩盒側面則可見到採簡約設計的 AMD徽標與正中心「9」象徵其為 Ryzen 9處理器的圖案

Ryzen 9 7950X3D彩盒背面除了有封盒的標籤之外,與往常一樣盒上用了各國語言介紹處理器架構與名稱

Ryzen 9 7950X3D彩盒正面橙色區塊中 CPU本體的特寫

將 Ryzen 9 7950X3D彩盒展開,從正面可見 Ryzen 9 7950X3D處理器鑲嵌在內盒正中央

展開後的 Ryzen 9 7950X3D彩盒側面,內盒色彩的搭配仍為橙色與灰色

將 Ryzen 9 7950X3D處理器的上層固定紙器移開後可更清楚的見到 Ryzen 9 7950X3D處理器安穩的置於 CPU泡殼之內,CPU泡殼上方跟往常一樣放著 CPU型號貼紙

取出 Ryzen 9 7950X3D泡殼後與彩盒以及說明書合拍

另一角度

Ryzen 9 7950X3D IHS採四邊內縮特殊造型設計,為 CPU電阻電容元件提供了安置空間

Ryzen 9 7950X3D IHS厚度特寫,至於在 IHS裡頭的 CPU Compute Die (CCD) Size為 71mm²,I/O Die (IOD) Size則為 122mm²

Ryzen 9 7950X3D為 TSMC 5nm FinFET馬來西亞封裝 Supporting Chipsets X670E、X670、B650E、B650

Ryzen 9 7950X3D背面接點為 AM5 LGA 1718

MOBO:GIGABYTE Z790 AORUS MASTER

RAM:G.SKILL Trident Z5 Neo DDR5 6000 16GBX2

VGA:GIGABYTE RTX 4090 GAMING OC
PSU:GIGABYTE GP5 1000W

AMD Ryzen 9 7950X3D BIOS Setting

EXPO DDR5 6000

Low Latency Support

EXPO DDR5 6000

AMD CBS

SMU Common Options

CPPC Dyamic Preferred Cores-Auto

EASY MODE

Fan Pump Cortrol

測試平台
CPU: AMD Ryzen 9 7950X3D
CPU Cooler:ASUS ROG LC II 360一體式 CPU水冷散熱器
MB:GIGABYTE X670E AORUS MASTER BIOS122
VGA:GIGABYTE RTX 4090 GAMING OC (Driver 528.49)
RAM:G.SKILL Trident Z5 Neo RGB DDR5 6000 16GBX2
PSU:GIGABYTE GP5 1000W
OS:Windows11 Pro (22H2 22621.1265)
電源計畫:High Performance
測試設定
WINVER確認 Windows11 Pro版本

開啟遊戲模式

啟用虛擬化型安全性

內顯資訊
Ryzen 9 7950X3D內建 Integrated Graphics AMD Radeon Graphics 2 Core 2200 MHz GPU Base 400 MHz
支援 USB Type-C DisplayPort Alternate Mode

測試項目
A.預設測試諸元及在單線程與多線程負載下之頻率溫度變化
B.一般測試
Ryzen 9 7950X3D的一般效能測試並與 Core i9-13900KS、Core i9-13900K、Ryzen 9 7950X做比較
1.CrossMark 1.0.1.77 Pro
2.AIDA64 Cache & Memory Benchmark
3.Cinebench R23
4.PCMark10 applications
5.POV-Ray Benchmark
6.X264 FHD Benchmark
7.V-ray Benchmark
8.3DMark CPU Profile
9.WebXPRT3
10.Geekbench 5.4
11.CPUZ-Bench
12.SuperPi 32M
13.SPECworkstation 3.1 Workloads
A.General Operations
a.7zip
b.octave
c.python36
B.Media and Entertainment
a.Blander
3BMWs:
Island:
b.Handbrake
c.luxrender
14.UL Procyon Video Editing Benchmarks
15.UL Procyon Photo Editing Benchmarks
C.遊戲測試
Ryzen 9 7950X3D+RTX 4090的遊戲效能測試並與 Core i9-13900KS、Core i9-13900K、Ryzen 9 7950X做比較
a.Far Cry 5 Benchmark《極地戰嚎5》
b.Assassin's Creed Origins Benchmark《刺客教條:起源》
c.UNIGINE Superposition Benchmark
d.3DMark Time Spy Extreme
e.Final Fantasy XV Benchmark《太空戰士15:新帝國》
f.Far Cry 6《極地戰嚎6》
g.《 DIRT 5 》《大地長征 5》
h.Assassin's Creed Odyssey《刺客信條奧德賽》
i.Total War: Three Kingdoms《全軍破敵:三國》
j.Total War: Warhammer《全軍破敵:戰鎚》
k.Tom Clancy's Ghost Recon: Breakpoint Benchmark《火線獵殺:絕境》
l.Ashes of the Singularity Benchmark《奇點灰燼》
m.Gears 5 《戰爭機器 5》
n.Final Fantasy XIV Benchmark《太空戰士14:重生之境》
Ryzen 9 7950X3D上機


RTX 4090燈效


A.預設測試諸元及在單線程與多線程負載下之頻率溫度變化
Ryzen 9 7950X3D idle時在 GIGABYTE X670E AORUS MASTER最高頻率來到 5.75GHz DDR5 6000 待機溫度 39°C

Ryzen 9 7950X3D在 Cinebench R23單線程測試時之頻率最高來到 5750MHz,最高溫度 55°C

Ryzen 9 7950X3D 在 Cinebench R23多線程測試時之 All Core頻率來到 5100MHz,最高溫度 81°C

Ryzen 9 7950X3D 在 SuperPI 32M單線程測試時之頻率最高來到 5750MHz,溫度 46°C

Ryzen 9 7950X3D SuperPI 32M的分數也跑進了 5分鐘

Ryzen 9 7950X3D 在 CPUMARK99單線程測試時之頻率最高來到 5750MHz ,最高溫度 51°C

Ryzen 9 7950X3D AIDA64 ExtremeCPU FPU Stress燒機測試 ,最高溫度 79°C

Ryzen 9 7950X3D AIDA64 Extreme CPU FPU Stress 頻率維持在 All Core 4950MHz 功耗為 111W

頻率功耗溫度比較表

⇧單位: 頻率、度C、瓦數
B.一般測試
1.CrossMark 1.0.1.77 Pro
CrossMark是一種新型的跨平台基準測試,用於衡量系統效能和使用對效能特徵建模的常見和相關工作負載的響應能力真實世界的應用程式,CrossMark使用開源和專有的組合工作負載來評估生產力、創造力和響應性 CrossMark安裝迅速,只需幾分鐘即可得出結果,整體性能評分旨在跟踪 SYSmark 25的評分,CrossMark還允許在一系列操作系統中進行比較
CrossMark為商業和政府 IT決策者、媒體、渠道購買者、顧問、系統和組件設計者和製造商,政府和非政府機構以及標準機構一種客觀,易於使用的評估 PC 的工具用戶可能遇到的各種活動的性能
CrossMark的其他功能和亮點包括:
• 跨架構系統基準測試 – 在 Windows、iOS 和 macOS上運行以評估性能,與操作系統無關。未來將添加更多平台
• 以真實應用為模型的系統基準測試-通過以下方式衡量普通用戶的性能使用開源和專有工作負載對真實應用程序進行建模
• 真實的性能擴展-在 CPU頻率上與實際應用程序類似地擴展,內核和線程、系統記憶體、存儲、GPU和其他功能
• 具有支持觸摸屏的直觀界面的輕量級安裝 – 簡化用戶從不到一分鐘的快速安裝過程開始的經驗,需要更少超過 1GB的存儲空間-用戶可以通過單擊或點擊屏幕開始基準測試
• 自動運行時支持-提供自動基準測試的選項,以簡化和簡化系統測量
• 在線系統性能數據庫-支持在線結果提交,以實現實時設備比較和評估
CrossMark Results
Ryzen 9 7950X3D
Ryzen 9 7950X3D Overall 2264、Productivity 2046、Creativity 2676、Responsiveness 1860

對照組
Ryzen 9 7950X
R
Ryzen 9 7950X Overall 2213、Productivity 2028、Creativity 2554、Responsiveness 1871

對照組
Core i9-13900KS
Core i9-13900KS Overall 2797、Productivity 2499、Creativity 3122、Responsiveness 2800

CrossMark Benchmark比較表

⇧單位: Performance Score (數字愈大愈好)
2.AIDA64 Cache & Memory Benchmark
AIDA64 Cache & Memory Benchmark可測量 CPU高速緩存和系統記憶體的頻寬和延遲。通過雙擊窗口中的任何矩形,列或行,我們可以單獨啟動基準測試或基準測試類型。例如,如果我們雙擊 “Memory”,則只會運行系統內存讀取,寫入,複製和延遲基準測試,即只執行給定行中的操作。同樣,如果我們雙擊 “Read”,則只會對所有記憶體類型運行讀取基準測試,即只執行給定列中的操作。如果我們雙擊任何矩形,則只會運行選定的單個基準
右鍵單擊 “Start Benchmark”按鈕將打開一個上下文菜單,我們可以在其中選擇運行所有基準測試或僅運行記憶體或緩存基準測試
Ryzen 9 7950X3D EXPO DDR5 6000 30-38-38-96 CR1
AIDA64 Cache & Memory Benchmark Results
Read 86,480MB/s
Write.90,411MB/s
Copy.127,920MB/s
Latency 66.1ns

對照組
Ryzen 9 7950X EXPO DDR5 6000 30-38-38-96 CR1
對照組
7950X EXPO DDR5 6000 AIDA64 Cache & Memory Benchmark Results
Read 78,0768MB/s
Write.80,302MB/s
Copy.73,110MB/s
Latency 58.3ns

對照組
13900KS DDR5 8000 AIDA64 Cache & Memory Benchmark Results
Read 119,180MB/s
Write.100,080MB/s
Copy.105,870MB/s
Latency 60.9ns

AIDA64 Cache & Memory Benchmark比較表

⇧單位: MB/s (數字愈大愈好)
3.Cinebench R23 CPU Test
Cinebench是一個真實的跨平台測試套件,用於評估計算機的硬件功能,現有最新版本已至 R23版本,由於它是 以 Cinema 4D動畫製作軟體為基礎進行測試,所以能夠反應出多線程處理器與顯示卡面對實際應用軟體所能發揮的效能,且能在短時間內得知測試結果,是一個能快速得知是否能 All Core 5GHz的測試軟體
Cinebench Release 20的改進反映了近年來 CPU和渲染技術的整體進步,為 Cinema 4D利用多個 CPU核心和普通用戶可用的現代處理器功能提供了更準確的測量,最重要的是它是免費的
Cinebench R23 Results
Ryzen 9 7950X3D 1T 2069pts、nT 37594pts

對照組
Cinebench R23 Ryzen 9 7950X 1T 2060pts、nT 38362pts

對照組
Core i9-13900KS 1T 2388pts、nT 41388pts

Cinebench R23 Benchmark比較表

⇧單位: Performance Score (數字愈大愈好)
4.PCMark10 applications
PCMark10 applications應用程式測試通過在 Microsoft Word、Excel、PowerPoint和 Edge中運行的測試來衡量適用於現代工作場所的實用、真實的 PC性能,通過此測試,您還可以對由 Windows 11 PC進行基準測試,其結果可與基於 x86的傳統設備的分數相媲美
PCMark10 applications Results
Ryzen 9 7950X3D 「Overall」 16357分,「Word」 7575分 「Excel」40429分,「PowerPoint」17312分,「Edge」13502分

對照組
Ryzen 9 7950X 「Overall」 16675分,「Word」 8577分 「Excel」33137分,「PowerPoint」19666分,「Edge」13835分

對照組
Core i9-13900KS 「Overall」 17957分,「Word」 8800分 「Excel」40706分,「PowerPoint」19822分,「Edge」14644分

PCMark10 applications benchmark比較表

⇧單位: Performance Score (數字愈大愈好)
5.POV-Ray Benchmark
POV-Ray全名是 Persistence of Vision Raytracer,是一個使用光線跟蹤繪製三維圖像的開放原始碼自由軟體。運行 POV腳本語言。它是基於 DKBTrace來開發的,DKBTrace是由 David Kirk Buck和 Aaron A. Collins編寫在 Amiga上的。POV-Ray早期也受到了 Polyray raytracer作者 Alexander Enzmann的幫助。很多漂亮的圖片就是由 POV-Ray來製作的

POV-Ray Benchmark Results
Ryzen 9 7950X3D POV-Ray Benchmark Results 612.95s

對照組
Ryzen 9 7950X POV-Ray Benchmark Results 589.92s

對照組
Core i9-13900KS POV-Ray Benchmark Results 561.05s

POV-Ray Benchmark比較表

⇧單位: S (數字愈小愈好)
6.X264 FHD Benchmark
X264 FHD Benchmark是一套可以同時測試浮點運算及多媒體的轉檔效能的測試軟體,勉強設定下的處理器頻率與電壓將很難完成測試

X264 FHD Benchmark Results
Ryzen 9 7950X3D X264 FHD Benchmark Score 110.11fps

對照組
Ryzen 9 7950X X264 FHD Benchmark Score 104.06fps

對照組
Core i9-13900KS X264 FHD Benchmark Score 137.23fps

X264 FHD Benchmark比較表

⇧單位: Performance Score (數字愈大愈好)
7.V-ray Benchmark
V-Ray Benchmark是一款免費的獨立應用程式,可幫助您測試硬件渲染的速度。基準測試包括兩個測試場景:一個用於 V-Ray,另一個用於 V-Ray GPU,具體取決於您要測量的渲染引擎
借助V-Ray Next Benchmark,您可以快速輕鬆地評估運行V-Ray Next的機器性能。了解您的計算機如何與其他人一起排名並了解不同的硬件如何影響您的渲染速度。使用V-Ray Next Benchmark,您可以測試系統的功率和性能,並將組件推向極限

V-ray Benchmark Results
Ryzen 9 7950X3D V-ray Benchmark 22s

對照組
Ryzen 9 7950X V-ray Benchmark 22s
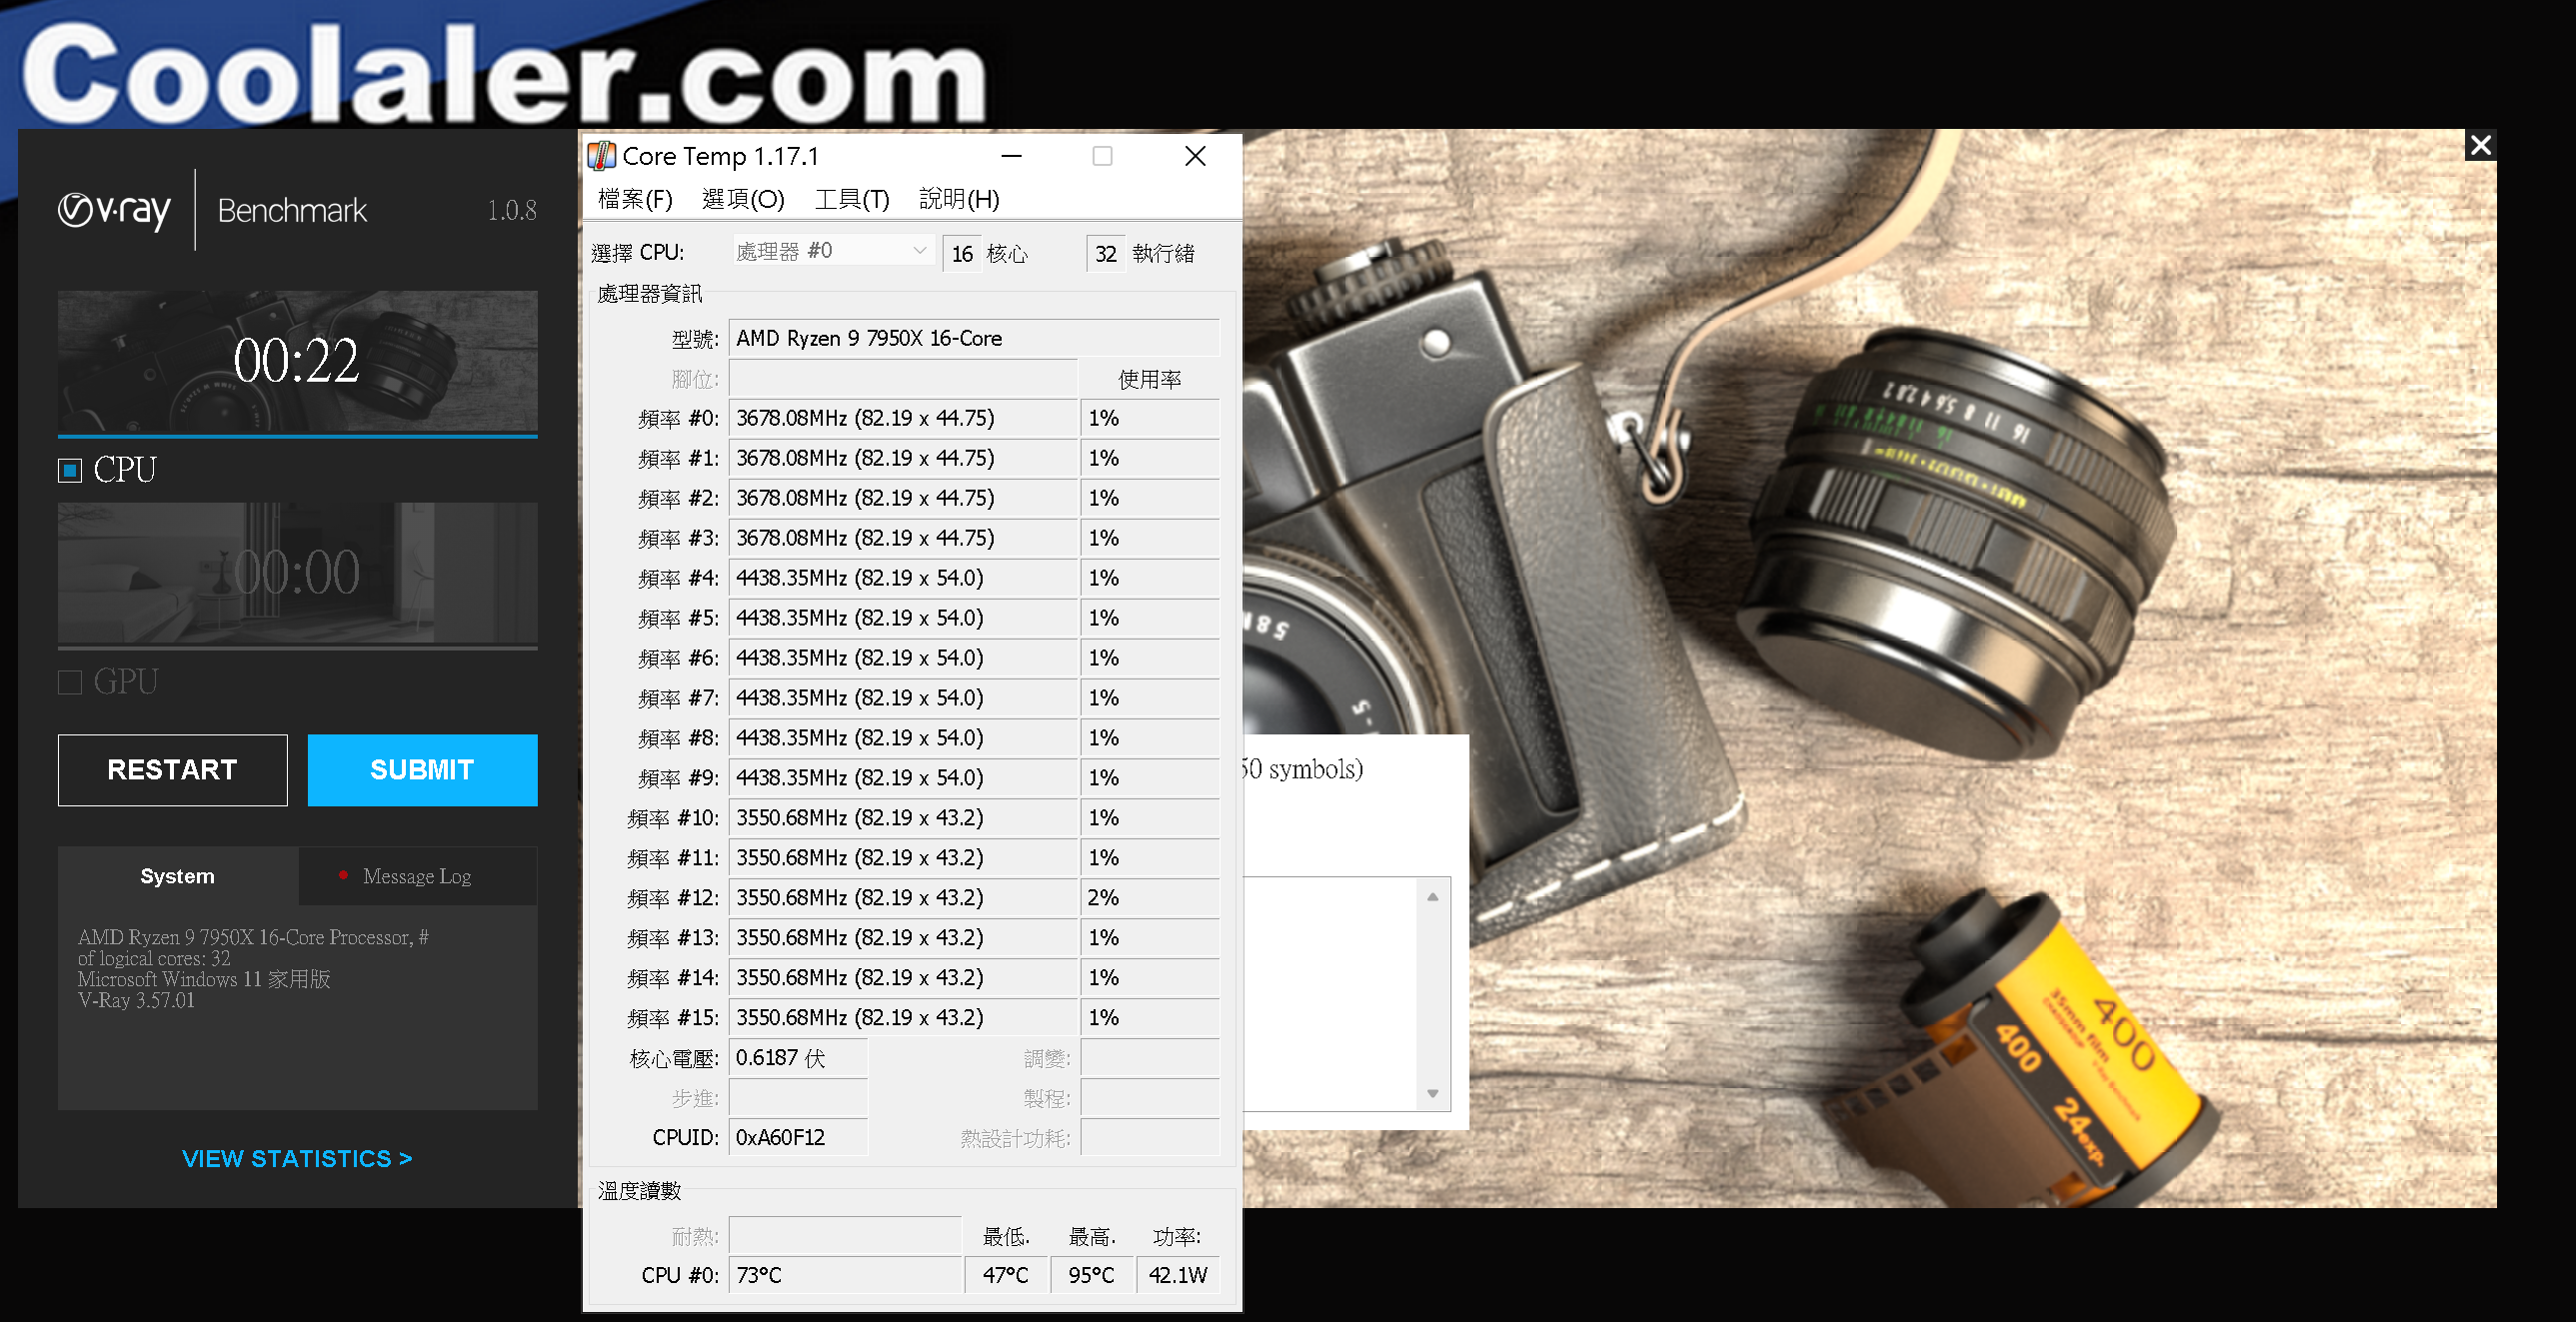
對照組
Core i9-13900KS V-ray Benchmark 21s

V-ray Benchmark比較表

⇧單位:S (數字愈小愈好)
8.3DMark CPU Profile
3DMark CPU Profile引入了一種新的 CPU基準測試方法。 3DMark CPU配置文件不是生成單個數字,而是顯示 CPU性能如何隨使用的內核和線程數量而變化。 3DMark CPU配置文件有六項測試,可幫助您對一系列場景的 CPU 性能進行基準測試和比較

3DMark CPU Profile Results
Ryzen 9 7950X3D Max threads 16355、16 threads 13539、8 threads 7741、4 threads 4211、2 threads 2169、1 threads 1102
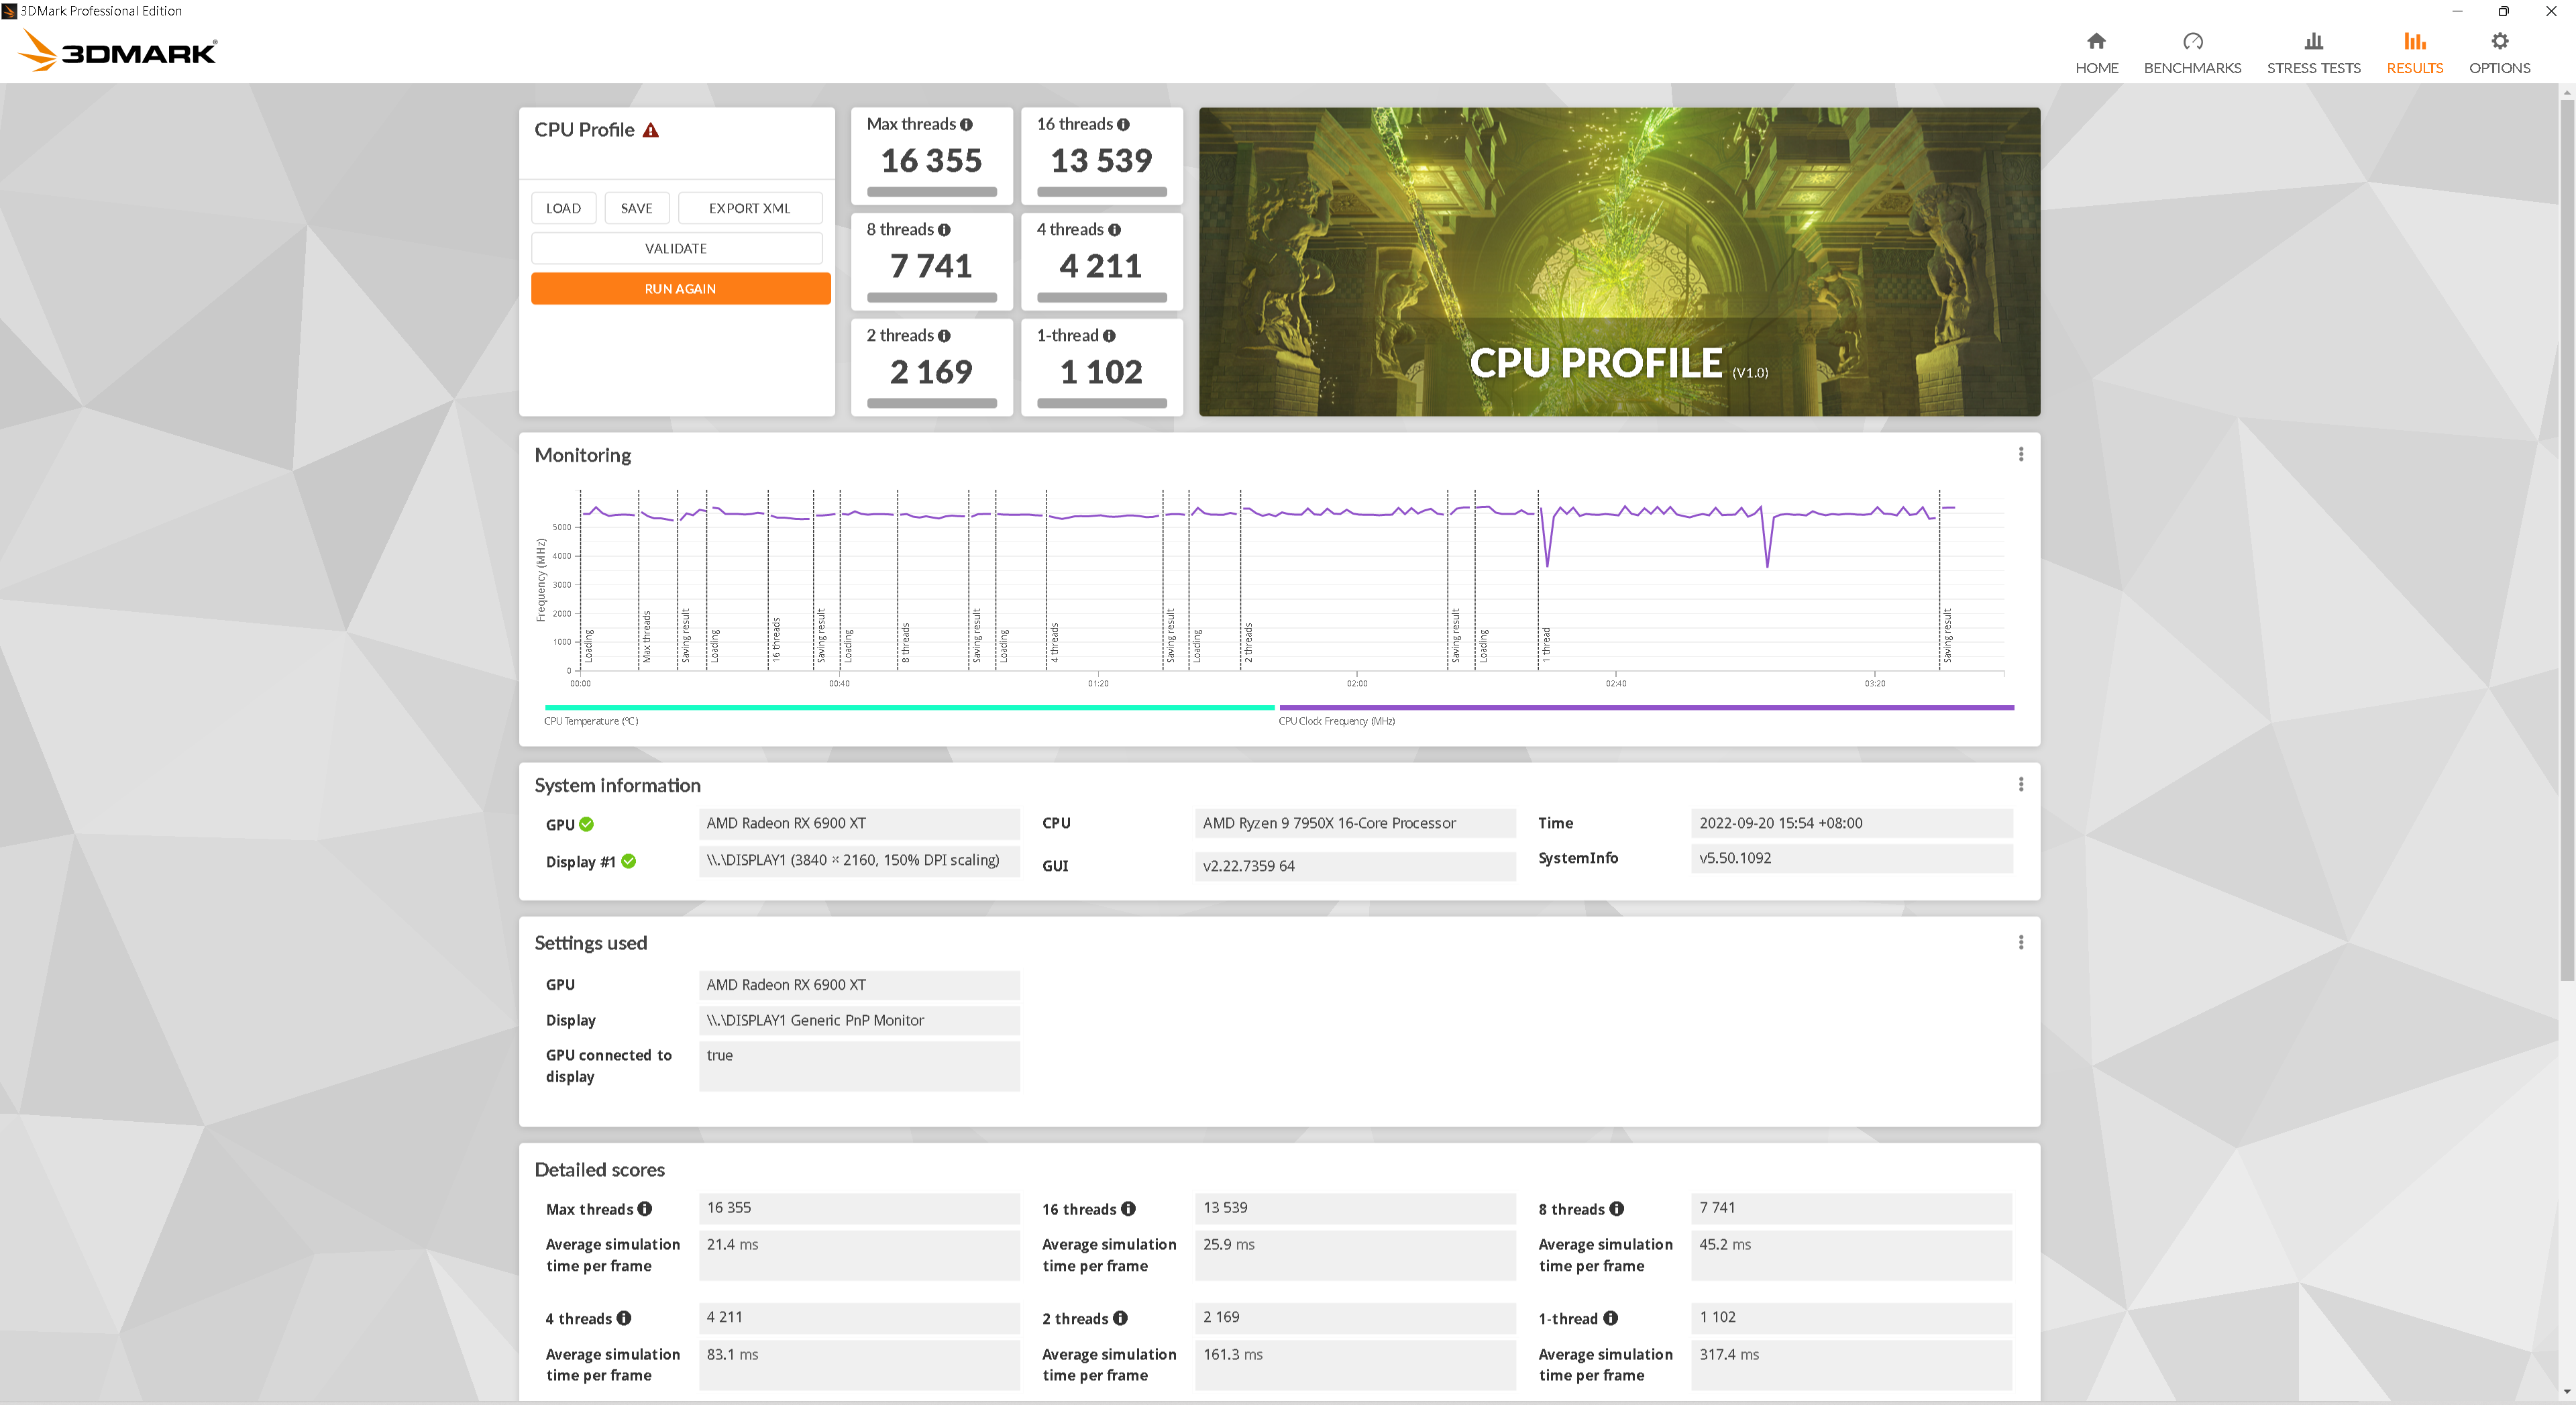
對照組
Ryzen 9 7950X Max threads 16491、16 threads 13196、8 threads 7615、4 threads 4060、2 threads 2177、1 threads 1099

對照組
Core i9-13900KS 3DMark CPU Profile Results
Max threads 16728、16 threads 11756、8 threads 8902、4 threads 4746、2 threads 2457、1 threads 1236

3DMark CPU Profile比較表

⇧單位: Performance Score (數字愈大愈好)
9.WebXPRT3
WebXPRT 3是一個瀏覽器基準測試,可以比較幾乎所有支持 Web的設備的性能。它包含六個基於 HTML5和 JavaScript的場景,用於反映您每天執行的任務:照片增強、使用 AI 組織相冊、股票期權定價、加密筆記和 OCR掃描、銷售圖表和在線作業。使用 WebXPRT可以準確了解不同設備處理實際任務的情況,WebXPRT 是 Web基準測試的黃金標準,可以免費使用,並且可以直接從您的瀏覽器運行。立即嘗試或查看來自各種設備的發布結果

WebXPRT3 Results
Ryzen 9 7950X3D WebXPRT3 Results 517

對照組
Ryzen 9 7950X WebXPRT3 Results 517

對照組
Core i9-13900KS WebXPRT3 Results 478

WebXPRT3 Benchmark比較表

⇧單位: Performance Score (數字愈大愈好)
10.Geekbench5.4
Geekbench是一款跨平台的處理基準測試程序,其評分系統可分為單核和多核性能,以及模擬真實使用場景的工作負載能力。有 Geekbench 2、Geekbench 3,Geekbench4以及 Geekbench 5。軟體基準測試適用於 macOS、Windows、Linux、Android和 iOS。Geekbench 4、Geekbench5還測量 GPU性能包括圖像處理和計算機視覺等領域
Ryzen 9 7950X3D Geekbench5 Results Single-Core Score 2271 Multi-Core Score 24727

對照組
Ryzen 9 7950X Geekbench5 Results Single-Core Score 2154 Multi-Core Score 23269

對照組
Core i9-13900KS Geekbench5 Results
Core i9-13900KS Single-Core Score 2171 Multi-Core Score 26731

Geekbench 5 Benchmark比較表

⇧單位: Performance Score (數字愈大愈好)
11.CPU-Z Bench
CPU-Z為一個中央處理器、記憶體及主機板資訊的 Windows軟體,在近年新增了 Bench item,提供處理器的快速簡單測試
Ryzen 9 7950X3D CPU-Z Bench Results
Single Thread 729.8 Multi Thread 15509.9

對照組
Ryzen 9 7950X CPU-Z Bench Results
Single Thread 769.9 Multi Thread 15474.5

對照組
Core i9-13900KS CPU-Z Bench Results
Single Thread 982.0 Multi Thread 18313.0

CPU-Z Benchmark比較表

⇧單位: Performance Score (數字愈大愈好)
12.SuperPi 32M
SuperPi 32M是一個計算圓周率的浮點運算程式,最大精確到小數點以後的 3200萬位數,該程式採用高斯-勒讓德演算法,並且於 1995年被日本電腦科學家金田康正使用 Windows環境下計算出精確到 232次方的圓周率,是一款在檢測單工效能時常用的程式,但在需要多工測試時亦可同時開啟多個程式同時運算
Ryzen 9 7950X3D SuperPI 32M的分數 5m 20.95s

對照組
Ryzen 9 7950X SuperPI 32M的分數 5m 23.826s
對照組
Core i9-13900KS SuperPI 32M的分數 4m 36.991s

SuperPI 32M比較表

⇧單位: m.s(數字愈小愈好)
13.SPECworkstation 3.1 Workloads
A.General Operations
General Operations對工作站市場上廣泛使用的幾個應用程式進行測試
a.7zip
免費軟體 7zip程序在處理器之間提供了良好的縮放性能,以壓縮和提取文件層次結構
b.octave
此工作負載使用 Octave(一種用於科學計算的編程語言)來計算各種數學運算
c.python36
此工作負載使用 Python 3.6對各種數學運算進行基準測試,包括使用 numpy 和 scipy 數學庫的運算,以及製作圖表和多線程矩陣功能
B.Media and Entertainment
a.Blander
此工作負載使用開源 Blender (blender.org) 應用程序來衡量內容創建工作流的性能。它包含以下測試:
3BMWs:
這是一個具有約 470K頂點和約 900K三角形的場景。場景包括三個相同的汽車模型。當相機平移 360 度時,它使用 OpenGL渲染器進行渲染。
BMW1M:這是一個有 ~91K頂點和 ~172K三角形的場景。它使用單一車型。使用 Blender Cycles光線追踪渲染器渲染單個幀。
Island:
這是一個具有約 16K頂點和 32K三角形的場景。它包括一個代表大量鳥類的粒子系統。
BWM27:此場景描繪了使用 Blender Cycles光線追踪渲染器渲染的兩輛汽車。它包含 99K頂點和 187K三角形。
Classroom:具有大量光源和反射光的室內場景,包括懸浮在空氣中的灰塵顆粒和穿過窗戶並從燈發出的光。
b.Handbrake
此工作負載基於開源媒體編碼器 Handbrake ( www.handbrake.fr )。它需要一個 4K mp4文件並使用 H.265 編碼器以兩種不同的分辨率對其進行轉碼。第一次轉碼將文件從 4K下採樣到 2K。第二個轉碼從 H264 4K到 H265 4K
c.luxrender
LuxRender 使用 LuxMark(基於新的 LuxCore 基於物理的渲染器的基準)來渲染位於海灘場景中數字網格上的 chrome球體
A.General Operations
a.7zip (Score數字愈小愈好)
Ryzen 9 7950X3D
decompress 31.5
compress 41.27

對照組
Ryzen 9 7950X
decompress 29.97
compress 128.28

對照組
Core i9-13900KS
decompress 25.09
compress 133.53

b.octave (數字愈小愈好)
Ryzen 9 7950X3D
obench.m 351.45
benchmark.m 6.8

對照組
Ryzen 9 7950X
obench.m 349.45
benchmark.m 6.69

對照組
Core i9-13900KS
obench.m 374.59
benchmark.m 8.59

c.python36 (數字愈小愈好)
Ryzen 9 7950X3D
NumPy 35.49
SciPy 37.09
Multithread Matrix 37.66

對照組
Ryzen 9 7950X
NumPy 38.78
SciPy 38.92
Multithread Matrix 39.06

對照組
Core i9-13900KS
NumPy 33.67
SciPy 33.42
Multithread Matrix 31.41

B.Media and Entertainment
a.Blander (數字愈小愈好)
Ryzen 9 7950X3D
classroom 256.31
BMW27 38.67
3BMWs 39.08
BMW1M 19.56
island 54.26

對照組
Ryzen 9 7950X
classroom 254.48
BMW27 41.94
3BMWs 22.44
BMW1M 19.59
island 56.34

對照組
Core i9-13900KS
classroom 262.33
BMW27 37.09
3BMWs 39.83
BMW1M 18.81
island 47.69

b.Handbrake (數字愈小愈好)
Ryzen 9 7950X3D
High Quality 33.66
Default 130.88

對照組
Ryzen 9 7950X
High Quality 33.94
Default 129.72

對照組
Core i9-13900KS
High Quality 37.42
Default 132.78

c.luxrender (數字愈小愈好)
Ryzen 9 7950X3D
GPU Test 25.63
CPU Test 10.81
對照組
Ryzen 9 7950X
GPU Test 11.2
CPU Test 11.03

對照組
Core i9-13900KS
GPU Test 60753
CPU Test 15264

SPECworkstation 3.1 Workloads比較表

⇧單位: Performance Score (數字愈小愈好)
14.UL Procyon Video Editing Benchmarks
使用 Adobe Premiere Pro對 PC性能進行 Benchmark,UL Procyon Benchmark盡可能使用真實應用程序來測試性能。UL Procyon Video Editing Benchmark典型的影片編輯工作流程中使用 Adobe Premiere Pro,從 Premiere Pro導出影片文件對創作者來說是死時間。即使是短影片也可能需要幾分鐘才能導出。具有圖層、顏色分級和復雜效果的較長序列可能需要一個小時或更長時間。更快的創作者 PC需要更少的時間來導出影片文件,從而為創作者提供更多時間,基準測試從導入兩個影片項目文件開始。項目時間表包括各種編輯、調整和效果。第二個項目使用了幾個 GPU加速的效果。每個影片項目都以 H.264 編碼的全高清格式導出,並以 HEVC (H.265) 編碼的 4K UHD 格式導出。Nenchmark分數基於導出所有四個影片所需的時間

Ryzen 9 7950X3D UL Procyon Video Editing Results 9782

對照組
Ryzen 9 7950X UL Procyon Video Editing Benchmarks Score 9377

對照組
Core i9-13900KS UL Procyon Video Editing Results 10136

UL Procyon Video Editing Benchmark比較表

⇧單位: Performance Score (數字愈大愈好)
15.UL Procyon Photo Editing Benchmarks
UL Procyon Benchmarks盡可能使用真實應用程序來測試性能。UL Procyon Photo Editing Benchmarks在包括批處理和圖像修飾的典型照片編輯工作流程中使用 Adobe Lightroom Classic 和 Adobe Photoshop,UL Procyon照片編輯基準首先將數字負片 (DNG) 圖像文件導入 Adobe Lightroom Classic 並應用各種預設。一些圖像被裁剪、拉直和修改。在測試的第二部分,在 Adobe Photoshop 中對照片應用多重編輯和圖層效果。基準分數是衡量 PC執行這些任務的速度

Ryzen 9 7950X3D UL Procyon Photo Editing Results : 11948

對照組
Ryzen 9 7950X UL Procyon Photo Editing Results : 10541

對照組
Core i9-13900KS UL Procyon Photo Editing Results 10788

UL Procyon Photo Editing Benchmark比較表

⇧單位: Performance Score (數字愈大愈好)
D.遊戲測試
測試諸元
Ryzen 9 7950X3D+RTX 4090

對照組
Ryzen 9 7950X+RTX 4090

對照組
Core i9-13900KS測試諸元
Core i9-13900KS+RTX 4090

a.Far Cry 5 Benchmark
Far Cry 5 Benchmark《極地戰嚎5》
Far Cry 5《極地戰嚎5》是一個自帶 Benchmark的新遊戲,是由育碧蒙特婁、育碧多倫多開發和育碧軟體發行的開放世界第一人稱動作冒險遊戲

4K Far Cry 5 Benchmark Ave Results
Ryzen 9 7950X3D Far Cry 5 4K Benchmark Ave 192fps

對照組
Ryzen 9 7950X Far Cry 5 Benchmark Ave Results Ave 177fps

對照組
Core i9-13900KS Far Cry 5 4K Benchmark Ave 191ps

Far Cry 5 4K Benchmark比較表

⇧單位: Performance Score (數字愈大愈好)
b.Shadow of the Tomb Raider 《古墓奇兵:暗影》
《古墓奇兵:暗影》(英語:Shadow of the Tomb Raider)是一款由藝奪蒙特婁開發,史克威爾艾尼克斯發行的動作冒險遊戲,是繼2013年《古墓奇兵》和2015年《古墓奇兵:崛起》後古墓奇兵重啟系列的第三部作品,也是該系列第11部主要系列作品。遊戲在2018年9月14日發行於Microsoft Windows、PlayStation 4和Xbox One平台。本作包含繁簡中文字幕及中文配音。遊戲的macOS、Linux版本由Feral Interactive於2019年11月5日發行,Stadia版則在2019年11月19日發布

Ryzen 9 7950X3D Shadow of the Tomb Raider 4K Benchmark Results:352fps

對照組
Ryzen 9 7950X Shadow of the Tomb Raider Benchmark Results:280fps

對照組
Core i9-13900KS Shadow of the Tomb Raider Benchmark Results:310fps

Shadow of the Tomb Raider 4K Benchmark比較表
⇧單位: Performance Score (數字愈大愈好)
c.UNIGINE Superposition Benchmark
UNIGINE是一款專有的跨平台遊戲引擎,由俄羅斯軟件公司 UNIGINE Corp開發。除了用作遊戲引擎外,它還用於虛擬現實系統,嚴肅遊戲和可視化
UNIGINE最強大的功能是它的高級渲染器,支持 OpenGL 4.0和 DirectX 11,Superposition則為 2017版本,包含極端性能和穩定性測試:視頻卡,電源,冷卻系統,檢查預設和超頻模式與真實負載及在環境中的互動體驗

UNIGINE Superposition Benchmark 1080P Extreme Results
UNIGINE Superposition 4K Benchmark Extreme Results
Ryzen 9 7950X3D 4K UNIGINE Superposition Benchmark Extreme:33586分

對照組
Ryzen 9 7950X 4K UNIGINE Superposition Benchmark Extreme:33123分

對照組
Core i9-13900KS 4K UNIGINE Superposition Benchmark:33604分

UNIGINE Superposition 4K Benchmark比較表

⇧單位: Performance Score (數字愈大愈好)
d.3DMark Time Spy Extreme
3DMark Time Spy用來測試處理器及顯示卡之 3D圖形表現和工作負載,現由 UL擁有,主要是針對 DirectX 12的效能,測試有三個部分,第一個為顆粒陰影、曲面細分等效果,第二個則是光線追蹤的體積光照明技術,最後則是 CPU效能測試,在前兩個測試中,包含了數千萬個頂點跟多邊形,上百萬個曲面細分,這些都是 FireStrike的幾十倍,而 3DMark Time Spy Extreme是 3DMark Time Spy的 4K版本,所有圖形都是 4K規格

3DMark Time Spy Extreme Benchmark Results
Ryzen 9 7950X3D 3DMark Time Spy Extreme:17857分

對照組
Ryzen 9 7950X 3DMark Time Spy Extreme:17951分

對照組
Core i9-13900KS 3DMark Time Spy Extreme:18276分

3DMark Time Spy Extreme比較表

⇧單位: Performance Score (數字愈大愈好)
e.Final Fantasy XV Benchmark
Final Fantasy XV《太空戰士 15》的 Benchmark,是一款由史克威爾艾尼克斯在 2016年 11月推出的動作角色扮演遊戲《Final Fantasy系列》的第 15部,依照傳統,太空戰士都有 Benchmark的項目

Final Fantasy XV Benchmark 4K Results
Ryzen 9 7950X3D 4K Final Fantasy XV Benchmark:15721分

對照組
Ryzen 9 7950X Final Fantasy XV Benchmark:15276分

對照組
Core i9-13900KS 4K Final Fantasy XV Benchmark:15857分

Final Fantasy XV 4K Benchmark比較表

⇧單位: Performance Score (數字愈大愈好)
f.Far Cry 6《極地戰嚎6》
Far Cry 6《極地戰嚎6》(英語:Far Cry 6,中國大陸譯作「孤島驚魂6」)是一款由育碧多倫多開發並由育碧發行在 Amazon Luna、Microsoft Windows、PlayStation 4、PlayStation 5、Xbox One、Xbox Series X/S和 Google Stadia平台上的動作冒險第一人稱射擊遊戲,是極地戰嚎系列的第六部正統作品
《極地戰嚎6》支援 AMD FidelityFX Super Resolution (FSR)、AMD FreeSync Premium Pro,以及 AMD FidelityFX視覺工具套件,包括在未使用 FSR時的對比調適銳化(CAS)這項不受硬體限制的動態銳化濾鏡可改善低對比畫面區域的細節,提高影像清晰度並針對因後製而導致柔化的影像進行銳化處理,確保在激烈對戰時視線不會被阻擋

畫質設定:高

7950X3D Far Cry 6 4K Result : 166fps

對照組
Ryzen 9 7950X Far Cry 6 Benchmark 4K Ave Results Ave :156fps

對照組
Core i9-13900KS Far Cry 6 4K Result 166fps

Far Cry 6 4K Benchmark比較表

⇧單位: Performance Score (數字愈大愈好)
g.《 DIRT 5 》《大地長征 5》
《 DIRT 5 》《大地長征 5》是一款專注於越野賽車的賽車遊戲。遊戲中的紀律包括拉力賽,冰上賽車,體育場超級卡車和越野車。玩家可以在亞利桑那州,巴西,摩洛哥,中國,意大利,紐約市和挪威等眾多地區的比賽項目中比賽。遊戲包含動態天氣系統和季節,影響賽車;例如,玩家只能在冬季參加紐約的冰上比賽。遊戲中還引入了四人分屏系統
《 DIRT 5 》還具有敘述性的職業生涯模式,在一系列錦標賽中,玩家角色與競爭對手布魯諾·杜蘭德(Blano Durand)(由諾蘭·諾斯(Nolan North)表達)相對。玩家還有一位名為 Alex“ AJ”Janiček的導師(由 Troy Baker講),在整個職業生涯中為他們提供建議

7950X3D 4K Results:196.6fps

對照組
Ryzen 9 7950X DIRT 5 4K Benchmark Results:190.1fps

對照組
Core i9-13900KS 4K Ultra High Results:191.3fps

DIRT5 4K Benchmark比較表

⇧單位: Performance Score (數字愈大愈好)
h.Assassin's Creed Odyssey《刺客信條奧德賽》
(英語:Assassin's Creed Odyssey,中國大陸譯作「刺客信條:奧德賽」) 是由魁北克育碧( Ubisoft Quebec)開發,育碧( Ubisoft)發行的動作角色扮演視頻遊戲。這是《刺客教條》系列的第十一個主要部分,總體上是第 21個,是 2017年《刺客教條》起源的繼任者。該情節設定於公元前 431-422年,講述了雅典和斯巴達之間的伯羅奔尼撒戰爭的神話歷史。玩家控制男性或女性傭兵(古希臘: μίσθιος misthios )在試圖團結家人的同時在衝突雙方中戰鬥的人

7950X3D 4K Assassin's Creed Odyssey Results:142fps

對照組
Ryzen 9 7950X Assassin's Creed Odyssey Benchmark Results:128fps

對照組
Core i9-13900KS 4K Results:142fps

Assassin's Creed Odyssey 4K Benchmark比較表

⇧單位: Performance Score (數字愈大愈好)
i.Total War: Three Kingdoms《全軍破敵:三國》
《全軍破敵:三國》(英語:Total War: Three Kingdoms,中國大陸譯作「全面戰爭:三國」)是一款由 Creative Assembly開發、由 SEGA發行的回合制策略遊戲。該遊戲原計劃於 2018年秋季發售,後經過兩次跳票延期至 2019年 5月 23日發售,首周單周銷量達 100萬,19萬玩家同時線上,創下全軍破敵系列之最

7950X3D 4K Total War: Three Kingdoms Results:118fps

對照組
Ryzen 9 7950X Total War: Three Kingdoms Benchmark Results:117.8fps

對照組
Core i9-13900KS 4K Results:119fps

Total War: Three Kingdoms 4K Benchmark比較表

⇧單位: Performance Score (數字愈大愈好)
j.Total War: Warhammer《全軍破敵:戰鎚》
Total War: Warhammer《全軍破敵:戰鎚》(英語:Total War: Warhammer,中國大陸譯作「全面戰爭:戰錘」)是一款由 Creative Assembly開發,經 SEGA公司通過Steam向Microsoft Windows、Linux、Mac OS平台發行的電子遊戲。本作結合了全軍破敵系列的玩法和 Games Workshop公司戰鎚系列的背景設定;所以是全軍破敵系列第一款非歷史背景的作品。本作是《全軍破敵系列》第十部作品及「全軍破敵:戰鎚」三部曲的首作

Setting


Ryzen 9 7950X3D
Battle Benchmark 4K 104.8fps

Ryzen 9 7950X3D
Campaign Benchmark 4K 106.3fps

對照組
Ryzen 9 7950X Battle Benchmark 4K 103.5fps

對照組
Ryzen 9 7950X Campaign Benchmark 103.4fps

對照組
Core i9-13900KS Battle Benchmark 4K 106.3fps

Core i9-13900K Campaign Benchmark 106.7fps

Total War: Warhammer 4K Benchmark比較表

⇧單位: Performance Score (數字愈大愈好)
k.Tom Clancy's Ghost Recon: Breakpoint Benchmark《火線獵殺:絕境》
Tom Clancy's Ghost Recon: Breakpoint Benchmark《火線獵殺:絕境》中國大陸譯作「幽靈行動:斷點」,全稱「湯姆·克蘭西之火線獵殺:絕境」)是一款由育碧巴黎開發,育碧發行的戰術射擊遊戲。本作是火線獵殺系列的第 8部作品。遊戲於 2019年 10月 4日在 PlayStation 4、Xbox One和 Windows平台發售,遊戲在發售後獲得了業界相當一般的評價

Ryzen 9 7950X3D Tom Clancy's Ghost Recon: Breakpoint 4K Benchmark 25654分

對照組
Ryzen 9 7950X Tom Clancy's Ghost Recon: Breakpoint Benchmark 24735分

對照組
Core i9-13900KS Tom Clancy's Ghost Recon: Breakpoint Benchmark 25554分

Tom Clancy's Ghost Recon: Breakpoint 4K Benchmark比較表

⇧單位: Performance Score (數字愈大愈好)
l.Ashes of the Singularity Benchmark《奇點灰燼》
Ashes of the Singularity Benchmark《奇點灰燼》是一款科幻即時戰略遊戲,號稱全球首款基於 Win10系統的 DX12遊戲,采用 Oxide Games的 Nitrous引擎打造,背景設定在遙遠的未來,那時人類完全以意識形態存在,人們已經掌握了上帝一樣的力量。但是人類發現自己已經處於戰爭之中,敵人就是一個叫做 “Haalee”的具有意識形態的 AI,企圖推翻人類在宇宙之中的統治地位

Ryzen 9 7950X3D Ashes of the Singularity Benchmark Results:205.4fps

對照組
Ryzen 9 7950X Ashes of the Singularity Benchmark Results:205fps

對照組
Core i9-13900KS Ashes of the Singularity Benchmark Results:214.4fps

Ashes of the Singularity Benchmark測試比較表

⇧單位:fps數字愈大愈好
m.Gears 5 《戰爭機器 5》
《戰爭機器 5》(英語:Gears 5)是一款已上市的第三人稱射擊的電子遊戲,由 The Coalition 製作,並由 Xbox遊戲工作室作為 Xbox Play Anywhere 的一部份發表於 Microsoft Windows 和 Xbox One 平台上。這是第六款《戰爭機器》系列的遊戲,同時作為 2016年的作品《戰爭機器 4》的續作。該作品已在 2019年 9月 10日正式發行。2020年 3月,The Coalition確認本作將在新世代主機 Xbox Series X發售首日發布對應新平台主機的版本

Ryzen 9 7950X3D Gears 5 Benchmark 4K Results:178.7fps

對照組
Ryzen 9 7950X Gears 5 Benchmark 4K Results:178.1fps

對照組
Core i9-13900KS Gears 5 Benchmark 4K Results:178.7fps

Gears 5 Benchmark測試比較表

⇧單位:fps數字愈大愈好
i.Final Fantasy XIV Benchmark《太空戰士14:重生之境》
《Final Fantasy XIV》(日語:ファイナルファンタジーXIV,英語:Final Fantasy XIV)是 Final Fantasy系列的第 14部本傳遊戲,也是繼《Final Fantasy XI》之後又一款大型多人線上角色扮演遊戲。遊戲由史克威爾艾尼克斯開發並發行,依照傳統,太空戰士都有 Benchmark的項目

Ryzen 9 7950X3D Final Fantasy XIV Benchmark:35172分

對照組
Ryzen 9 7950X Final Fantasy XIV Benchmark:26501分

對照組
Core i9-13900KS Final Fantasy XIV Benchmark:30200分

Final Fantasy XIV Benchmark測試比較表
⇧單位:Score數字愈大愈好
評比 :
在採用 3D V-Cache技術的「Zen 4」 Ryzen 9 7950X3D處理器解禁前,地表最強之遊戲處理器王座仍由 Core i9-13900KS所擁有,而當 Ryzen 9 7950X3D處理器效能解禁之後,採用 3D V-Cache技術的「Zen 4」 Ryzen 9 7950X3D處理器則讓 AMD重返了地表最強遊戲處理器的王座,原因是 Ryzen 9 7950X3D處理器之 L2+L3 Cache由原本的 Ryzen 9 7950X之 16+64MB提升至 16+128MB因而提供了更強悍的效能
在頻率功耗溫度比較方面,Ryzen 9 7950X3D處理器因為頻率略低於 Ryzen 9 7950X,因此功耗亦隨著降低,有關 Ryzen 9 7950X3D、Ryzen 9 7950X、13900KS、13900K之頻率功耗溫度比較請詳下表
頻率功耗溫度比較表
⇧單位: 頻率、°C、W
Ryzen 7000X3D系列處理器擁有更高的頻寬及更低的延遲,由於 3D V-Cache技術將資料保存在邏輯電路附近,也因此縮短了資料處理傳輸間的距離並得以加速運算,Ryzen 9 7950X3D處理器並且將 TDP由 170W降至 120W,但最大 Boost頻率仍維持在 5.7GHz,倘若在 TDP不降的情況下,以相同之供電 Ryzen 7950X3D處理器之效能將更加的強大,但從以上的測試可以看出,在 TDP實測只有 111W的 Ryzen 9 7950X3D仍然奪下地表最強遊戲處理器的王座,惟因頻率較低也使 Ryzen 9 7950X3D在內容創作方面表現不如遊戲的表現那麼亮麗
接著來進行各項遊戲評測比較,首先是 Ryzen 9 7950X3D Far Cry 5 4K Benchmark Ave 192fps測試比較,從下面的比較表中我們可以看出 Ryzen 9 7950X3D在 Far Cry 5 4K Benchmark測試項目中對 Core i9-13900KS、Core i9-13900K皆有些微領先,對 R9 7950X則有 8.5%的領先
Far Cry 5 4K Benchmark比較表
⇧ Far Cry 5 《極地戰嚎5》Benchmark比較表 單位:Performance Score(數字愈大愈好)
接著是 Ryzen 9 7950X3D Far Cry 6 4K Benchmark Ave測試比較,從下面的比較表中我們可以看出 Ryzen 9 7950X3D在 Far Cry 6 4K Benchmark測試項目中對 Core i9-13900KS打成平手,對 Core i9-13900K則是些微的勝出,對 R9 7950X則有 6.4%的領先
Far Cry 6 4K Benchmark比較表
⇧單位: Performance Score (數字愈大愈好)
接著是 Ryzen 9 7950X3D Shadow of the Tomb Raider 4K Benchmark測試比較,從下面的比較表中我們可以看出 Ryzen 9 7950X3D在 Shadow of the Tomb Raider 4K Benchmark測試項目中表現特別亮眼,Ryzen 9 7950X3D對 Core i9-13900KS、Core i9-13900KS均有 13.5%的領先,對 R9 7950X則有 25.7%的領先
Shadow of the Tomb Raider 4K Benchmark比較表
⇧單位: Performance Score (數字愈大愈好)
接著是 Ryzen 9 7950X3D 在 DIRT 5試比較,從下面的比較表中我們可以看出 Ryzen 9 7950X3D在 DIRT 5 4K Benchmark測試項目中對 Core i9-13900KS及 Core i9-13900K均為領先,對 R9 7950X則領先幅度多一些
DIRT5 4K Benchmark比較表
⇧單位: Performance Score (數字愈大愈好)
在遊戲 Assassin's Creed Odyssey《刺客信條奧德賽》的 Benchmark方面從下表中看到 Ryzen 9 7950X3D對上 Core i9-13900KS打平,對 Core i9-13900K以及 R9 7950X則均有勝出
⇧ Assassin's Creed Odyssey《刺客信條奧德賽》Benchmark比較表 單位 : Performance Score(數字愈大愈好)
在遊戲 Total War: Warhammer 4K Benchmark的效能上,從下表中看到 Ryzen 9 7950X3D對上 Core i9-13900KS些微落後,對 Core i9-13900K、Ryzen 9 7950X則是些微勝出的
Total War: Warhammer 4K Benchmark比較表
⇧單位: Performance Score (數字愈大愈好)
在遊戲 Tom Clancy's Ghost Recon: Breakpoint Benchmark《火線獵殺:絕境》之效能方面,從下表中看到 Ryzen 9 7950X3D對上 Core i9-13900KS、 Core i9-13900K、Ryzen 9 7950X均是勝出的,對 Ryzen 9 7950X的勝出幅度尤其出色
Tom Clancy's Ghost Recon: Breakpoint Benchmark《火線獵殺:絕境》
⇧單位: Performance Score (數字愈大愈好)
在遊戲 《戰爭機器 5》(英語:Gears 5)中之效能,從下比較表中看到 Ryzen 9 7950X3D對上 Core i9-13900K、Ryzen 9 7950X均勝出,對上 Core i9-13900KS則是平手
《戰爭機器 5》測試比較表
⇧單位:fps數字愈大愈好
接著是 UNIGINE Superposition 4K Benchmark測試比較,從下面的比較表中我們可以看出 Ryzen 9 7950X3D在 UNIGINE Superposition 4K Benchmark測試項目中對 Core i9-13900KS只有些微差距落後,但對 Core i9-13900K亦勝出,對 R9 7950X則有 1.5%的領先
UNIGINE Superposition 4K Benchmark比較表
⇧單位: Performance Score (數字愈大愈好)
在遊戲應用程式 Final Fantasy XV《太空戰士 15》 Benchmark之效能方面,從下表中看到 Ryzen 9 7950X3D對上 Core i9-13900KS兩者效能在誤差範圍之內,對 Core i9-13900K則小幅勝出,對 Ryzen 9 7950X有 2.9%的勝出
Final Fantasy XV 4K Benchmark比較表
⇧ Final Fantasy XV《太空戰士 15》Benchmark比較表 單位 : Performance Score(數字愈大愈好)
在遊戲應用程式 Final Fantasy XIV Benchmark《太空戰士14:重生之境》的 Benchmark之效能比較,從下表中看到 Ryzen 9 7950X3D對上 Core i9-13900KS、Core i9-13900K均為大勝,對 Ryzen 9 7950X之勝差尤其多
Final Fantasy XIV Benchmark《太空戰士14:重生之境》比較表
⇧ Final Fantasy XIV Benchmark《太空戰士14:重生之境》比較表 單位 : Performance Score(數字愈大愈好)
接著來看內容創作,在內容創作效能比較方面,Ryzen 9 7950X3D對上 Core i9-13900KS、Core i9-13900K是互有輸贏,但對 Cire i9-13900K勝率較多,在吾人常用的 WebXPRT 3 Benchmarks以及 UL Procyon Photo Editing兩個重要的的效能比較則均是 Ryzen 9 7950X3D勝出
在WebXPRT 3 Benchmarks之瀏覽器基準測試中,Ryzen 9 7950X3D表現最為出色,Ryzen 9 7950X3D對上 Core i9-13900KS,Ryzen 9 7950X3D比 Core i9-13900Ks的效能高了有 7.5%,對 Ryzen 9 7950X更高出了 19.1%
WebXPRT3 Benchmark比較表
⇧WebXPRT 3 Benchmarks比較表 單位: :Performance Score (數字愈大愈好)
在 UL Procyon Video Editing Benchmarks (Adobe Premiere Pro) 之內容創作測試中,Ryzen 9 7950X3D雖小敗給 Core i9-13900KS,但對 Core i9-13900K則勝出了 4.3%
UL Procyon Video Editing Benchmark比較表
⇧單位: Performance Score (數字愈大愈好)
在 UL Procyon Photo Editing Benchmarks (吾人常用到的 Adobe Lightroom classic、Adobe Photoshop)之創作測試中,Ryzen 9 7950X3D對上 Core i9-13900KS、Core i9-13900K、7950X均為勝出
UL Procyon Photo Editing Benchmark比較表
⇧UL Procyon Photo Editing Benchmarks 比較表 單位: : Performance Score (數字愈大愈好)
接著來看看在 AIDA64 Memory Benchmark記憶體頻寬之效能比較,從下圖可以看出,因為新版 BIOS開放了對 Bandwidth的優化支援,讓 7950X3D之 DDR5 6000頻寬較 7950X高了許多
AIDA64 Cache & Memory Benchmark比較表
⇧單位: MB/s (數字愈大愈好)
綜合以上,Ryzen 9 7950X3D在與 Core i9-13900KS、Core i9-13900K、Ryzen 9 7950X在所有遊戲中的勝率最高,因此 Ryzen 9 7950X3D榮登當今地表最強遊戲處理器實是實至名歸
在這 DDR5跨世代變革之際 AMD之 AM5平台已不再對 DDR4平台的支持,但在 DDR5頻率方面在不挑處理器的情況之下,現階段 AM5平台之 DDR5頻率約略落在 DDR5 6000,相對友商之 DDR5 7200,AMD則還有進步的空間,但這或許 是因為一直以來 AMD對穩定的要求一直比追求效能更為重視,以致與於對 BIOS在 DDR5的開放權限不如友商來的高有關,倘若能將 BIOS在 DDR5的權限適度的多開放一些, Ryzen 9 7950X3D的效能則還會再更加提升
AMD自 2017推出第一代 Ryzen桌上型處理器發表至今已經 5年多,Ryzen桌上型處理器由漸入佳境至碩果累累,為滿足使用者需求,AMD Ryzen桌上型處理器一代強於一代是有目共睹,AMD秉持突破再創新,這一次並以 Ryzen 9 7950X3D處理器繼續引領遊戲與內容創作之高性能先驅,並奪回了地表最強之遊戲處理器王座,再次驗證了 AMD的努力一直都有回報,謝謝收看
早先在台灣時間 1/4 10:30 AMD總裁暨執行長蘇姿丰博士 (Dr. Lisa Su) 曾於 CES Keynote 2023中發表了採用 3D V-Cache技術的「Zen 4」 Ryzen 7000X3D系列處理器已於今日效能解禁,滄者在第一時間亦取得了 Ryzen 9 7950X3D的 sample,並將搭配 GIGABYTE RTX4090 GAMING OC 24G以及 GIGABYTE X670E AORUS MASTER為您奉上開箱測試,其測試數據並將與 Intel Core i9-13900KS、Core i9-13900K及 Ryzen 9 7950X處理器做比較,敬請持續關注
AMD Ryzen 7000X3D系列 Raphael-X處理器首批上市的兩款處理器均瞄準高階市場,分別是 Ryzen 9 7950X3D 、 Ryzen 9 7900X3D,而中階的 Ryzen 7 7800X3D則將於稍後的 4/6推出
Ryzen 7000X3D系列處理器採用的並非是第二代 3D V-Cache技術,但仍大幅度的加大了L3 Cache,且比上一代的 5800X3D多了許多;跟 Ryzen 7000系列處理器相比,Ryzen 7000X3D系列處理器會在每個「Zen 4」架構之 CCD上增加額外的 64MB Cache,因此擁有比 Ryzen 7000系列處理器有更高的頻寬,額外的 64MB Cache並會使 Ryzen 7000X3D系列處理器之效能及更低的延遲,相對 Ryzen 7000系列處理器有 10%到 15%幅度的提升
Dr.蘇讓 AMD自 2017推出第一代 Ryzen桌上型處理器發表至今已經 5年多,Ryzen桌上型處理器由漸入佳境至碩果累累,Ryzen桌上型處理器一代強於一代之效能也有目共睹,AMD秉持突破再創新,並以 AMD 3D V-Cache技術繼續作為進階封裝技術的領導者,以創造世界上最快的遊戲桌上型電腦處理器和世界上效能最高的技術運算伺服器處理器,繼續引領遊戲與內容創作之高性能先驅,以滿足使用者需求,在 Ryzen 7000X3D系列處理器開賣在即之時,且讓我們來看看 AMD 3D V-Cache技術細節有哪一些優勢
AMD Ryzen 9 7950X3D的台幣價格為 22,950元,AMD Ryzen 9 7900X3D的台幣價格為 19,950美元
⇧AMD Ryzen 9 7950X3D的價格為 699美元,與 Ryzen 9 7950X發布時售價相同,不過目前 7950X已經調降不少,而 Ryzen 9 7900X3D售價是 599美元,相比 Ryzen 9 7900X發布時的 549美元要高出 50美元。Ryzen 7 7800X3D售價 449美元,相比 Ryzen 9 7900X的 429美元還要高,三款 Ryzen 7000X3D處理器與目前 Ryzen 7000系列一樣都會搭贈《星際大戰 絕地:倖存者》遊戲做促銷
高階款的 AMD Ryzen 7000X3D系列處理 Ryzen 9 7950X3D與 Ryzen 9 7900X3D將先於明日 2/28上市開賣
而中階的 AMD Ryzen 7 7800X3D則將於稍晚的 4/6上市開賣
AMD Ryzen 7000X3D系列處理器在降低了 TDP功耗的情況下卻仍然能再提升效能靠的是 3D V-Cache終極的技術
AMD Ryzen 7000X3D系列處理器所增加的 3D V-Cache均封裝於同一 CCX,而另一個未增加 3D V-Cache之 CCX則如同 Ryzen 7000系列處理器一般,只負責提供頻率的部分
AMD Ryzen 7000X3D處理器的兩個 CCX各司其職
一個 CCX主管高頻率 (沒有 3D V-Cache的 CCX),就是標準的原生 CCX,另一顆則是擁有 3D V-Cache的 CCX,兩種 CCX分別使用兩種驅動程式,採用動態模式技術並視情況選擇最有利的 CCX執行務以提供 Ryzen 9 7950X3D處理器最佳效能
AMD Ryzen 9 7950X3D處理器的兩個 CCX各司其職,並由兩種不同的驅動程式來負責分配效能
一個驅動程式負責已增加 3D V-Cache的 CCX效能
另一個驅動程式則負責原始 CCX在針對提升頻率及超頻方面的效能控管
新的 7000X3D多了幾個超頻選項,不似 5800X3D只能對記憶體超頻
身為全世界最佳的遊戲與內容創作處理器,AMD Ryzen 7950X3D擁有 16 Cores/32 Threads,5.7GHz Boost,120W TDP,144MB L2+L3 Cache
Ryzen 9 7950X3D諸元
Ryzen 9 7950X3D在諸項遊戲中的效能提升幅度

Ryzen 9 7950X3D雖然 Cache加大了,但是 TDP反而降低了
AMD Ryzen 7 7950X3D VS Core i9-13900K在底下 4款遊戲效能中有 13~24%的領先
AMD Ryzen 7 7950X3D VS Core i9-13900K在底下 4款內容創作效能中有 4~52%的領先
身為全世界最佳的遊戲處理器,AMD Ryzen 7 7800X3D擁有 8 Cores/16 Threads,5GHz Boost,120W TDP,104MB L2+L3 Cache
⇧Ryzen 7 7800X3D將於 4/06推出
AMD Ryzen 7 7800X3D VS Ryzen 7 5800X3D在底下 4款遊戲效能中有 21~30%的提升
AMD的優勢是一塊主機板可以讓您使用非常多代的處理器,即便比較貴但以長遠考量仍然是非常超值
Ryzen 70003D系列處理器之諸元與售價
AMD Ryzen 9 7950X3D
16 Cores/32 Threads,5.7GHz Boost,120W TDP,144MB Cache
AMD Ryzen 9 7950X
16 Cores/32 Threads,5.7GHz Boost ,170W TDP,80MB Cache
AMD Ryzen 9 7900X3D
12 Cores/24 Threads,5.6GHz Boost,120W TDP,140MB Cache
AMD Ryzen 9 7900X
12 Cores/24 Threads,5.6GHz Boost,170W TDP,76MB Cache
AMD Ryzen 7 7800X3D
8 Cores/16 Threads,5GHz Boost,120W TDP,104MB Cache
AMD Ryzen 7 7700X
8 Cores/16 Threads,5.4GHz Boost,105W TDP,40MB Cache
AMD Ryzen 7000X3D系列處理器有 Ryzen 9 7950X3D 、 Ryzen 9 7900X3D 、Ryzen 7 7800X3D ,比只有一款 5800X3D有更全面的布局
Ryzen 9 7950X3D在預設與開啟曲線優化與曲線優化加上 PBO不同之效能比較
雖然 TDP降低了,但每瓦的效能比反而增加
測試元件:
CPU: Ryzen 9 7950X3D彩盒,Ryzen 7000X3D系列處理器採用了新的零售包裝設計,與之前的 Ryzen 7000系列處理器並不相同
⇧新包裝用了色調更明亮的橙色色塊來標示處理器本體與型號規格,左上方的銀色三角形區塊則標示了「支持 AMD 3D V-Cache技術」可一眼即識別出其為支援 3D V-Cache技術的處理器
Ryzen 9 7950X3D彩盒側面則可見到採簡約設計的 AMD徽標與正中心「9」象徵其為 Ryzen 9處理器的圖案
Ryzen 9 7950X3D彩盒背面除了有封盒的標籤之外,與往常一樣盒上用了各國語言介紹處理器架構與名稱
Ryzen 9 7950X3D彩盒正面橙色區塊中 CPU本體的特寫
將 Ryzen 9 7950X3D彩盒展開,從正面可見 Ryzen 9 7950X3D處理器鑲嵌在內盒正中央
展開後的 Ryzen 9 7950X3D彩盒側面,內盒色彩的搭配仍為橙色與灰色
將 Ryzen 9 7950X3D處理器的上層固定紙器移開後可更清楚的見到 Ryzen 9 7950X3D處理器安穩的置於 CPU泡殼之內,CPU泡殼上方跟往常一樣放著 CPU型號貼紙
取出 Ryzen 9 7950X3D泡殼後與彩盒以及說明書合拍
另一角度
Ryzen 9 7950X3D IHS採四邊內縮特殊造型設計,為 CPU電阻電容元件提供了安置空間
Ryzen 9 7950X3D IHS厚度特寫,至於在 IHS裡頭的 CPU Compute Die (CCD) Size為 71mm²,I/O Die (IOD) Size則為 122mm²
Ryzen 9 7950X3D為 TSMC 5nm FinFET馬來西亞封裝 Supporting Chipsets X670E、X670、B650E、B650
Ryzen 9 7950X3D背面接點為 AM5 LGA 1718
MOBO:GIGABYTE Z790 AORUS MASTER
RAM:G.SKILL Trident Z5 Neo DDR5 6000 16GBX2
VGA:GIGABYTE RTX 4090 GAMING OC
PSU:GIGABYTE GP5 1000W
AMD Ryzen 9 7950X3D BIOS Setting
EXPO DDR5 6000
Low Latency Support
EXPO DDR5 6000
AMD CBS
SMU Common Options
CPPC Dyamic Preferred Cores-Auto
EASY MODE
Fan Pump Cortrol
測試平台
CPU: AMD Ryzen 9 7950X3D
CPU Cooler:ASUS ROG LC II 360一體式 CPU水冷散熱器
MB:GIGABYTE X670E AORUS MASTER BIOS122
VGA:GIGABYTE RTX 4090 GAMING OC (Driver 528.49)
RAM:G.SKILL Trident Z5 Neo RGB DDR5 6000 16GBX2
PSU:GIGABYTE GP5 1000W
OS:Windows11 Pro (22H2 22621.1265)
電源計畫:High Performance
測試設定
WINVER確認 Windows11 Pro版本
開啟遊戲模式
啟用虛擬化型安全性
內顯資訊
Ryzen 9 7950X3D內建 Integrated Graphics AMD Radeon Graphics 2 Core 2200 MHz GPU Base 400 MHz
支援 USB Type-C DisplayPort Alternate Mode
測試項目
A.預設測試諸元及在單線程與多線程負載下之頻率溫度變化
B.一般測試
Ryzen 9 7950X3D的一般效能測試並與 Core i9-13900KS、Core i9-13900K、Ryzen 9 7950X做比較
1.CrossMark 1.0.1.77 Pro
2.AIDA64 Cache & Memory Benchmark
3.Cinebench R23
4.PCMark10 applications
5.POV-Ray Benchmark
6.X264 FHD Benchmark
7.V-ray Benchmark
8.3DMark CPU Profile
9.WebXPRT3
10.Geekbench 5.4
11.CPUZ-Bench
12.SuperPi 32M
13.SPECworkstation 3.1 Workloads
A.General Operations
a.7zip
b.octave
c.python36
B.Media and Entertainment
a.Blander
3BMWs:
Island:
b.Handbrake
c.luxrender
14.UL Procyon Video Editing Benchmarks
15.UL Procyon Photo Editing Benchmarks
C.遊戲測試
Ryzen 9 7950X3D+RTX 4090的遊戲效能測試並與 Core i9-13900KS、Core i9-13900K、Ryzen 9 7950X做比較
a.Far Cry 5 Benchmark《極地戰嚎5》
b.Assassin's Creed Origins Benchmark《刺客教條:起源》
c.UNIGINE Superposition Benchmark
d.3DMark Time Spy Extreme
e.Final Fantasy XV Benchmark《太空戰士15:新帝國》
f.Far Cry 6《極地戰嚎6》
g.《 DIRT 5 》《大地長征 5》
h.Assassin's Creed Odyssey《刺客信條奧德賽》
i.Total War: Three Kingdoms《全軍破敵:三國》
j.Total War: Warhammer《全軍破敵:戰鎚》
k.Tom Clancy's Ghost Recon: Breakpoint Benchmark《火線獵殺:絕境》
l.Ashes of the Singularity Benchmark《奇點灰燼》
m.Gears 5 《戰爭機器 5》
n.Final Fantasy XIV Benchmark《太空戰士14:重生之境》
Ryzen 9 7950X3D上機
RTX 4090燈效
A.預設測試諸元及在單線程與多線程負載下之頻率溫度變化
Ryzen 9 7950X3D idle時在 GIGABYTE X670E AORUS MASTER最高頻率來到 5.75GHz DDR5 6000 待機溫度 39°C
Ryzen 9 7950X3D在 Cinebench R23單線程測試時之頻率最高來到 5750MHz,最高溫度 55°C
Ryzen 9 7950X3D 在 Cinebench R23多線程測試時之 All Core頻率來到 5100MHz,最高溫度 81°C
Ryzen 9 7950X3D 在 SuperPI 32M單線程測試時之頻率最高來到 5750MHz,溫度 46°C
Ryzen 9 7950X3D SuperPI 32M的分數也跑進了 5分鐘
Ryzen 9 7950X3D 在 CPUMARK99單線程測試時之頻率最高來到 5750MHz ,最高溫度 51°C
Ryzen 9 7950X3D AIDA64 ExtremeCPU FPU Stress燒機測試 ,最高溫度 79°C
Ryzen 9 7950X3D AIDA64 Extreme CPU FPU Stress 頻率維持在 All Core 4950MHz 功耗為 111W
頻率功耗溫度比較表
⇧單位: 頻率、度C、瓦數
B.一般測試
1.CrossMark 1.0.1.77 Pro
CrossMark是一種新型的跨平台基準測試,用於衡量系統效能和使用對效能特徵建模的常見和相關工作負載的響應能力真實世界的應用程式,CrossMark使用開源和專有的組合工作負載來評估生產力、創造力和響應性 CrossMark安裝迅速,只需幾分鐘即可得出結果,整體性能評分旨在跟踪 SYSmark 25的評分,CrossMark還允許在一系列操作系統中進行比較
CrossMark為商業和政府 IT決策者、媒體、渠道購買者、顧問、系統和組件設計者和製造商,政府和非政府機構以及標準機構一種客觀,易於使用的評估 PC 的工具用戶可能遇到的各種活動的性能
CrossMark的其他功能和亮點包括:
• 跨架構系統基準測試 – 在 Windows、iOS 和 macOS上運行以評估性能,與操作系統無關。未來將添加更多平台
• 以真實應用為模型的系統基準測試-通過以下方式衡量普通用戶的性能使用開源和專有工作負載對真實應用程序進行建模
• 真實的性能擴展-在 CPU頻率上與實際應用程序類似地擴展,內核和線程、系統記憶體、存儲、GPU和其他功能
• 具有支持觸摸屏的直觀界面的輕量級安裝 – 簡化用戶從不到一分鐘的快速安裝過程開始的經驗,需要更少超過 1GB的存儲空間-用戶可以通過單擊或點擊屏幕開始基準測試
• 自動運行時支持-提供自動基準測試的選項,以簡化和簡化系統測量
• 在線系統性能數據庫-支持在線結果提交,以實現實時設備比較和評估
CrossMark Results
Ryzen 9 7950X3D
Ryzen 9 7950X3D Overall 2264、Productivity 2046、Creativity 2676、Responsiveness 1860
對照組
Ryzen 9 7950X
R
Ryzen 9 7950X Overall 2213、Productivity 2028、Creativity 2554、Responsiveness 1871
對照組
Core i9-13900KS
Core i9-13900KS Overall 2797、Productivity 2499、Creativity 3122、Responsiveness 2800
CrossMark Benchmark比較表
⇧單位: Performance Score (數字愈大愈好)
2.AIDA64 Cache & Memory Benchmark
AIDA64 Cache & Memory Benchmark可測量 CPU高速緩存和系統記憶體的頻寬和延遲。通過雙擊窗口中的任何矩形,列或行,我們可以單獨啟動基準測試或基準測試類型。例如,如果我們雙擊 “Memory”,則只會運行系統內存讀取,寫入,複製和延遲基準測試,即只執行給定行中的操作。同樣,如果我們雙擊 “Read”,則只會對所有記憶體類型運行讀取基準測試,即只執行給定列中的操作。如果我們雙擊任何矩形,則只會運行選定的單個基準
右鍵單擊 “Start Benchmark”按鈕將打開一個上下文菜單,我們可以在其中選擇運行所有基準測試或僅運行記憶體或緩存基準測試
Ryzen 9 7950X3D EXPO DDR5 6000 30-38-38-96 CR1
AIDA64 Cache & Memory Benchmark Results
Read 86,480MB/s
Write.90,411MB/s
Copy.127,920MB/s
Latency 66.1ns
對照組
Ryzen 9 7950X EXPO DDR5 6000 30-38-38-96 CR1
對照組
7950X EXPO DDR5 6000 AIDA64 Cache & Memory Benchmark Results
Read 78,0768MB/s
Write.80,302MB/s
Copy.73,110MB/s
Latency 58.3ns
對照組
13900KS DDR5 8000 AIDA64 Cache & Memory Benchmark Results
Read 119,180MB/s
Write.100,080MB/s
Copy.105,870MB/s
Latency 60.9ns
AIDA64 Cache & Memory Benchmark比較表
⇧單位: MB/s (數字愈大愈好)
3.Cinebench R23 CPU Test
Cinebench是一個真實的跨平台測試套件,用於評估計算機的硬件功能,現有最新版本已至 R23版本,由於它是 以 Cinema 4D動畫製作軟體為基礎進行測試,所以能夠反應出多線程處理器與顯示卡面對實際應用軟體所能發揮的效能,且能在短時間內得知測試結果,是一個能快速得知是否能 All Core 5GHz的測試軟體
Cinebench Release 20的改進反映了近年來 CPU和渲染技術的整體進步,為 Cinema 4D利用多個 CPU核心和普通用戶可用的現代處理器功能提供了更準確的測量,最重要的是它是免費的
Cinebench R23 Results
Ryzen 9 7950X3D 1T 2069pts、nT 37594pts
對照組
Cinebench R23 Ryzen 9 7950X 1T 2060pts、nT 38362pts
對照組
Core i9-13900KS 1T 2388pts、nT 41388pts
Cinebench R23 Benchmark比較表
⇧單位: Performance Score (數字愈大愈好)
4.PCMark10 applications
PCMark10 applications應用程式測試通過在 Microsoft Word、Excel、PowerPoint和 Edge中運行的測試來衡量適用於現代工作場所的實用、真實的 PC性能,通過此測試,您還可以對由 Windows 11 PC進行基準測試,其結果可與基於 x86的傳統設備的分數相媲美
- 衡量真實世界的表現
- 基於 Microsoft應用程式的相關測試
- 測試和比較基於 Arm 和 x86 的設備
PCMark10 applications Results
Ryzen 9 7950X3D 「Overall」 16357分,「Word」 7575分 「Excel」40429分,「PowerPoint」17312分,「Edge」13502分
對照組
Ryzen 9 7950X 「Overall」 16675分,「Word」 8577分 「Excel」33137分,「PowerPoint」19666分,「Edge」13835分
對照組
Core i9-13900KS 「Overall」 17957分,「Word」 8800分 「Excel」40706分,「PowerPoint」19822分,「Edge」14644分
PCMark10 applications benchmark比較表
⇧單位: Performance Score (數字愈大愈好)
5.POV-Ray Benchmark
POV-Ray全名是 Persistence of Vision Raytracer,是一個使用光線跟蹤繪製三維圖像的開放原始碼自由軟體。運行 POV腳本語言。它是基於 DKBTrace來開發的,DKBTrace是由 David Kirk Buck和 Aaron A. Collins編寫在 Amiga上的。POV-Ray早期也受到了 Polyray raytracer作者 Alexander Enzmann的幫助。很多漂亮的圖片就是由 POV-Ray來製作的
POV-Ray Benchmark Results
Ryzen 9 7950X3D POV-Ray Benchmark Results 612.95s
對照組
Ryzen 9 7950X POV-Ray Benchmark Results 589.92s
對照組
Core i9-13900KS POV-Ray Benchmark Results 561.05s
POV-Ray Benchmark比較表
⇧單位: S (數字愈小愈好)
6.X264 FHD Benchmark
X264 FHD Benchmark是一套可以同時測試浮點運算及多媒體的轉檔效能的測試軟體,勉強設定下的處理器頻率與電壓將很難完成測試
X264 FHD Benchmark Results
Ryzen 9 7950X3D X264 FHD Benchmark Score 110.11fps
對照組
Ryzen 9 7950X X264 FHD Benchmark Score 104.06fps
對照組
Core i9-13900KS X264 FHD Benchmark Score 137.23fps
X264 FHD Benchmark比較表
⇧單位: Performance Score (數字愈大愈好)
7.V-ray Benchmark
V-Ray Benchmark是一款免費的獨立應用程式,可幫助您測試硬件渲染的速度。基準測試包括兩個測試場景:一個用於 V-Ray,另一個用於 V-Ray GPU,具體取決於您要測量的渲染引擎
借助V-Ray Next Benchmark,您可以快速輕鬆地評估運行V-Ray Next的機器性能。了解您的計算機如何與其他人一起排名並了解不同的硬件如何影響您的渲染速度。使用V-Ray Next Benchmark,您可以測試系統的功率和性能,並將組件推向極限
V-ray Benchmark Results
Ryzen 9 7950X3D V-ray Benchmark 22s
對照組
Ryzen 9 7950X V-ray Benchmark 22s
對照組
Core i9-13900KS V-ray Benchmark 21s
V-ray Benchmark比較表
⇧單位:S (數字愈小愈好)
8.3DMark CPU Profile
3DMark CPU Profile引入了一種新的 CPU基準測試方法。 3DMark CPU配置文件不是生成單個數字,而是顯示 CPU性能如何隨使用的內核和線程數量而變化。 3DMark CPU配置文件有六項測試,可幫助您對一系列場景的 CPU 性能進行基準測試和比較
3DMark CPU Profile Results
Ryzen 9 7950X3D Max threads 16355、16 threads 13539、8 threads 7741、4 threads 4211、2 threads 2169、1 threads 1102
對照組
Ryzen 9 7950X Max threads 16491、16 threads 13196、8 threads 7615、4 threads 4060、2 threads 2177、1 threads 1099
對照組
Core i9-13900KS 3DMark CPU Profile Results
Max threads 16728、16 threads 11756、8 threads 8902、4 threads 4746、2 threads 2457、1 threads 1236
3DMark CPU Profile比較表
⇧單位: Performance Score (數字愈大愈好)
9.WebXPRT3
WebXPRT 3是一個瀏覽器基準測試,可以比較幾乎所有支持 Web的設備的性能。它包含六個基於 HTML5和 JavaScript的場景,用於反映您每天執行的任務:照片增強、使用 AI 組織相冊、股票期權定價、加密筆記和 OCR掃描、銷售圖表和在線作業。使用 WebXPRT可以準確了解不同設備處理實際任務的情況,WebXPRT 是 Web基準測試的黃金標準,可以免費使用,並且可以直接從您的瀏覽器運行。立即嘗試或查看來自各種設備的發布結果
WebXPRT3 Results
Ryzen 9 7950X3D WebXPRT3 Results 517
對照組
Ryzen 9 7950X WebXPRT3 Results 517
對照組
Core i9-13900KS WebXPRT3 Results 478
WebXPRT3 Benchmark比較表
⇧單位: Performance Score (數字愈大愈好)
10.Geekbench5.4
Geekbench是一款跨平台的處理基準測試程序,其評分系統可分為單核和多核性能,以及模擬真實使用場景的工作負載能力。有 Geekbench 2、Geekbench 3,Geekbench4以及 Geekbench 5。軟體基準測試適用於 macOS、Windows、Linux、Android和 iOS。Geekbench 4、Geekbench5還測量 GPU性能包括圖像處理和計算機視覺等領域
Ryzen 9 7950X3D Geekbench5 Results Single-Core Score 2271 Multi-Core Score 24727
對照組
Ryzen 9 7950X Geekbench5 Results Single-Core Score 2154 Multi-Core Score 23269
對照組
Core i9-13900KS Geekbench5 Results
Core i9-13900KS Single-Core Score 2171 Multi-Core Score 26731
Geekbench 5 Benchmark比較表
⇧單位: Performance Score (數字愈大愈好)
11.CPU-Z Bench
CPU-Z為一個中央處理器、記憶體及主機板資訊的 Windows軟體,在近年新增了 Bench item,提供處理器的快速簡單測試
Ryzen 9 7950X3D CPU-Z Bench Results
Single Thread 729.8 Multi Thread 15509.9
對照組
Ryzen 9 7950X CPU-Z Bench Results
Single Thread 769.9 Multi Thread 15474.5
對照組
Core i9-13900KS CPU-Z Bench Results
Single Thread 982.0 Multi Thread 18313.0
CPU-Z Benchmark比較表
⇧單位: Performance Score (數字愈大愈好)
12.SuperPi 32M
SuperPi 32M是一個計算圓周率的浮點運算程式,最大精確到小數點以後的 3200萬位數,該程式採用高斯-勒讓德演算法,並且於 1995年被日本電腦科學家金田康正使用 Windows環境下計算出精確到 232次方的圓周率,是一款在檢測單工效能時常用的程式,但在需要多工測試時亦可同時開啟多個程式同時運算
Ryzen 9 7950X3D SuperPI 32M的分數 5m 20.95s
對照組
Ryzen 9 7950X SuperPI 32M的分數 5m 23.826s
對照組
Core i9-13900KS SuperPI 32M的分數 4m 36.991s
SuperPI 32M比較表
⇧單位: m.s(數字愈小愈好)
13.SPECworkstation 3.1 Workloads
A.General Operations
General Operations對工作站市場上廣泛使用的幾個應用程式進行測試
a.7zip
免費軟體 7zip程序在處理器之間提供了良好的縮放性能,以壓縮和提取文件層次結構
b.octave
此工作負載使用 Octave(一種用於科學計算的編程語言)來計算各種數學運算
c.python36
此工作負載使用 Python 3.6對各種數學運算進行基準測試,包括使用 numpy 和 scipy 數學庫的運算,以及製作圖表和多線程矩陣功能
B.Media and Entertainment
a.Blander
此工作負載使用開源 Blender (blender.org) 應用程序來衡量內容創建工作流的性能。它包含以下測試:
3BMWs:
這是一個具有約 470K頂點和約 900K三角形的場景。場景包括三個相同的汽車模型。當相機平移 360 度時,它使用 OpenGL渲染器進行渲染。
BMW1M:這是一個有 ~91K頂點和 ~172K三角形的場景。它使用單一車型。使用 Blender Cycles光線追踪渲染器渲染單個幀。
Island:
這是一個具有約 16K頂點和 32K三角形的場景。它包括一個代表大量鳥類的粒子系統。
BWM27:此場景描繪了使用 Blender Cycles光線追踪渲染器渲染的兩輛汽車。它包含 99K頂點和 187K三角形。
Classroom:具有大量光源和反射光的室內場景,包括懸浮在空氣中的灰塵顆粒和穿過窗戶並從燈發出的光。
b.Handbrake
此工作負載基於開源媒體編碼器 Handbrake ( www.handbrake.fr )。它需要一個 4K mp4文件並使用 H.265 編碼器以兩種不同的分辨率對其進行轉碼。第一次轉碼將文件從 4K下採樣到 2K。第二個轉碼從 H264 4K到 H265 4K
c.luxrender
LuxRender 使用 LuxMark(基於新的 LuxCore 基於物理的渲染器的基準)來渲染位於海灘場景中數字網格上的 chrome球體
A.General Operations
a.7zip (Score數字愈小愈好)
Ryzen 9 7950X3D
decompress 31.5
compress 41.27
對照組
Ryzen 9 7950X
decompress 29.97
compress 128.28
對照組
Core i9-13900KS
decompress 25.09
compress 133.53
b.octave (數字愈小愈好)
Ryzen 9 7950X3D
obench.m 351.45
benchmark.m 6.8
對照組
Ryzen 9 7950X
obench.m 349.45
benchmark.m 6.69
對照組
Core i9-13900KS
obench.m 374.59
benchmark.m 8.59
c.python36 (數字愈小愈好)
Ryzen 9 7950X3D
NumPy 35.49
SciPy 37.09
Multithread Matrix 37.66
對照組
Ryzen 9 7950X
NumPy 38.78
SciPy 38.92
Multithread Matrix 39.06
對照組
Core i9-13900KS
NumPy 33.67
SciPy 33.42
Multithread Matrix 31.41
B.Media and Entertainment
a.Blander (數字愈小愈好)
Ryzen 9 7950X3D
classroom 256.31
BMW27 38.67
3BMWs 39.08
BMW1M 19.56
island 54.26
對照組
Ryzen 9 7950X
classroom 254.48
BMW27 41.94
3BMWs 22.44
BMW1M 19.59
island 56.34
對照組
Core i9-13900KS
classroom 262.33
BMW27 37.09
3BMWs 39.83
BMW1M 18.81
island 47.69
b.Handbrake (數字愈小愈好)
Ryzen 9 7950X3D
High Quality 33.66
Default 130.88
對照組
Ryzen 9 7950X
High Quality 33.94
Default 129.72
對照組
Core i9-13900KS
High Quality 37.42
Default 132.78
c.luxrender (數字愈小愈好)
Ryzen 9 7950X3D
GPU Test 25.63
CPU Test 10.81
對照組
Ryzen 9 7950X
GPU Test 11.2
CPU Test 11.03
對照組
Core i9-13900KS
GPU Test 60753
CPU Test 15264
SPECworkstation 3.1 Workloads比較表
⇧單位: Performance Score (數字愈小愈好)
14.UL Procyon Video Editing Benchmarks
使用 Adobe Premiere Pro對 PC性能進行 Benchmark,UL Procyon Benchmark盡可能使用真實應用程序來測試性能。UL Procyon Video Editing Benchmark典型的影片編輯工作流程中使用 Adobe Premiere Pro,從 Premiere Pro導出影片文件對創作者來說是死時間。即使是短影片也可能需要幾分鐘才能導出。具有圖層、顏色分級和復雜效果的較長序列可能需要一個小時或更長時間。更快的創作者 PC需要更少的時間來導出影片文件,從而為創作者提供更多時間,基準測試從導入兩個影片項目文件開始。項目時間表包括各種編輯、調整和效果。第二個項目使用了幾個 GPU加速的效果。每個影片項目都以 H.264 編碼的全高清格式導出,並以 HEVC (H.265) 編碼的 4K UHD 格式導出。Nenchmark分數基於導出所有四個影片所需的時間
Ryzen 9 7950X3D UL Procyon Video Editing Results 9782
對照組
Ryzen 9 7950X UL Procyon Video Editing Benchmarks Score 9377
對照組
Core i9-13900KS UL Procyon Video Editing Results 10136
UL Procyon Video Editing Benchmark比較表
⇧單位: Performance Score (數字愈大愈好)
15.UL Procyon Photo Editing Benchmarks
UL Procyon Benchmarks盡可能使用真實應用程序來測試性能。UL Procyon Photo Editing Benchmarks在包括批處理和圖像修飾的典型照片編輯工作流程中使用 Adobe Lightroom Classic 和 Adobe Photoshop,UL Procyon照片編輯基準首先將數字負片 (DNG) 圖像文件導入 Adobe Lightroom Classic 並應用各種預設。一些圖像被裁剪、拉直和修改。在測試的第二部分,在 Adobe Photoshop 中對照片應用多重編輯和圖層效果。基準分數是衡量 PC執行這些任務的速度
Ryzen 9 7950X3D UL Procyon Photo Editing Results : 11948
對照組
Ryzen 9 7950X UL Procyon Photo Editing Results : 10541
對照組
Core i9-13900KS UL Procyon Photo Editing Results 10788
UL Procyon Photo Editing Benchmark比較表
⇧單位: Performance Score (數字愈大愈好)
D.遊戲測試
測試諸元
Ryzen 9 7950X3D+RTX 4090
對照組
Ryzen 9 7950X+RTX 4090
對照組
Core i9-13900KS測試諸元
Core i9-13900KS+RTX 4090
a.Far Cry 5 Benchmark
Far Cry 5 Benchmark《極地戰嚎5》
Far Cry 5《極地戰嚎5》是一個自帶 Benchmark的新遊戲,是由育碧蒙特婁、育碧多倫多開發和育碧軟體發行的開放世界第一人稱動作冒險遊戲
4K Far Cry 5 Benchmark Ave Results
Ryzen 9 7950X3D Far Cry 5 4K Benchmark Ave 192fps
對照組
Ryzen 9 7950X Far Cry 5 Benchmark Ave Results Ave 177fps
對照組
Core i9-13900KS Far Cry 5 4K Benchmark Ave 191ps
Far Cry 5 4K Benchmark比較表
⇧單位: Performance Score (數字愈大愈好)
b.Shadow of the Tomb Raider 《古墓奇兵:暗影》
《古墓奇兵:暗影》(英語:Shadow of the Tomb Raider)是一款由藝奪蒙特婁開發,史克威爾艾尼克斯發行的動作冒險遊戲,是繼2013年《古墓奇兵》和2015年《古墓奇兵:崛起》後古墓奇兵重啟系列的第三部作品,也是該系列第11部主要系列作品。遊戲在2018年9月14日發行於Microsoft Windows、PlayStation 4和Xbox One平台。本作包含繁簡中文字幕及中文配音。遊戲的macOS、Linux版本由Feral Interactive於2019年11月5日發行,Stadia版則在2019年11月19日發布
Ryzen 9 7950X3D Shadow of the Tomb Raider 4K Benchmark Results:352fps
對照組
Ryzen 9 7950X Shadow of the Tomb Raider Benchmark Results:280fps
對照組
Core i9-13900KS Shadow of the Tomb Raider Benchmark Results:310fps
Shadow of the Tomb Raider 4K Benchmark比較表
⇧單位: Performance Score (數字愈大愈好)
c.UNIGINE Superposition Benchmark
UNIGINE是一款專有的跨平台遊戲引擎,由俄羅斯軟件公司 UNIGINE Corp開發。除了用作遊戲引擎外,它還用於虛擬現實系統,嚴肅遊戲和可視化
UNIGINE最強大的功能是它的高級渲染器,支持 OpenGL 4.0和 DirectX 11,Superposition則為 2017版本,包含極端性能和穩定性測試:視頻卡,電源,冷卻系統,檢查預設和超頻模式與真實負載及在環境中的互動體驗
UNIGINE Superposition Benchmark 1080P Extreme Results
UNIGINE Superposition 4K Benchmark Extreme Results
Ryzen 9 7950X3D 4K UNIGINE Superposition Benchmark Extreme:33586分
對照組
Ryzen 9 7950X 4K UNIGINE Superposition Benchmark Extreme:33123分
對照組
Core i9-13900KS 4K UNIGINE Superposition Benchmark:33604分
UNIGINE Superposition 4K Benchmark比較表
⇧單位: Performance Score (數字愈大愈好)
d.3DMark Time Spy Extreme
3DMark Time Spy用來測試處理器及顯示卡之 3D圖形表現和工作負載,現由 UL擁有,主要是針對 DirectX 12的效能,測試有三個部分,第一個為顆粒陰影、曲面細分等效果,第二個則是光線追蹤的體積光照明技術,最後則是 CPU效能測試,在前兩個測試中,包含了數千萬個頂點跟多邊形,上百萬個曲面細分,這些都是 FireStrike的幾十倍,而 3DMark Time Spy Extreme是 3DMark Time Spy的 4K版本,所有圖形都是 4K規格
3DMark Time Spy Extreme Benchmark Results
Ryzen 9 7950X3D 3DMark Time Spy Extreme:17857分
對照組
Ryzen 9 7950X 3DMark Time Spy Extreme:17951分
對照組
Core i9-13900KS 3DMark Time Spy Extreme:18276分
3DMark Time Spy Extreme比較表
⇧單位: Performance Score (數字愈大愈好)
e.Final Fantasy XV Benchmark
Final Fantasy XV《太空戰士 15》的 Benchmark,是一款由史克威爾艾尼克斯在 2016年 11月推出的動作角色扮演遊戲《Final Fantasy系列》的第 15部,依照傳統,太空戰士都有 Benchmark的項目
Final Fantasy XV Benchmark 4K Results
Ryzen 9 7950X3D 4K Final Fantasy XV Benchmark:15721分
對照組
Ryzen 9 7950X Final Fantasy XV Benchmark:15276分
對照組
Core i9-13900KS 4K Final Fantasy XV Benchmark:15857分
Final Fantasy XV 4K Benchmark比較表
⇧單位: Performance Score (數字愈大愈好)
f.Far Cry 6《極地戰嚎6》
Far Cry 6《極地戰嚎6》(英語:Far Cry 6,中國大陸譯作「孤島驚魂6」)是一款由育碧多倫多開發並由育碧發行在 Amazon Luna、Microsoft Windows、PlayStation 4、PlayStation 5、Xbox One、Xbox Series X/S和 Google Stadia平台上的動作冒險第一人稱射擊遊戲,是極地戰嚎系列的第六部正統作品
《極地戰嚎6》支援 AMD FidelityFX Super Resolution (FSR)、AMD FreeSync Premium Pro,以及 AMD FidelityFX視覺工具套件,包括在未使用 FSR時的對比調適銳化(CAS)這項不受硬體限制的動態銳化濾鏡可改善低對比畫面區域的細節,提高影像清晰度並針對因後製而導致柔化的影像進行銳化處理,確保在激烈對戰時視線不會被阻擋
畫質設定:高
7950X3D Far Cry 6 4K Result : 166fps
對照組
Ryzen 9 7950X Far Cry 6 Benchmark 4K Ave Results Ave :156fps
對照組
Core i9-13900KS Far Cry 6 4K Result 166fps
Far Cry 6 4K Benchmark比較表
⇧單位: Performance Score (數字愈大愈好)
g.《 DIRT 5 》《大地長征 5》
《 DIRT 5 》《大地長征 5》是一款專注於越野賽車的賽車遊戲。遊戲中的紀律包括拉力賽,冰上賽車,體育場超級卡車和越野車。玩家可以在亞利桑那州,巴西,摩洛哥,中國,意大利,紐約市和挪威等眾多地區的比賽項目中比賽。遊戲包含動態天氣系統和季節,影響賽車;例如,玩家只能在冬季參加紐約的冰上比賽。遊戲中還引入了四人分屏系統
《 DIRT 5 》還具有敘述性的職業生涯模式,在一系列錦標賽中,玩家角色與競爭對手布魯諾·杜蘭德(Blano Durand)(由諾蘭·諾斯(Nolan North)表達)相對。玩家還有一位名為 Alex“ AJ”Janiček的導師(由 Troy Baker講),在整個職業生涯中為他們提供建議
7950X3D 4K Results:196.6fps
對照組
Ryzen 9 7950X DIRT 5 4K Benchmark Results:190.1fps
對照組
Core i9-13900KS 4K Ultra High Results:191.3fps
DIRT5 4K Benchmark比較表
⇧單位: Performance Score (數字愈大愈好)
h.Assassin's Creed Odyssey《刺客信條奧德賽》
(英語:Assassin's Creed Odyssey,中國大陸譯作「刺客信條:奧德賽」) 是由魁北克育碧( Ubisoft Quebec)開發,育碧( Ubisoft)發行的動作角色扮演視頻遊戲。這是《刺客教條》系列的第十一個主要部分,總體上是第 21個,是 2017年《刺客教條》起源的繼任者。該情節設定於公元前 431-422年,講述了雅典和斯巴達之間的伯羅奔尼撒戰爭的神話歷史。玩家控制男性或女性傭兵(古希臘: μίσθιος misthios )在試圖團結家人的同時在衝突雙方中戰鬥的人
7950X3D 4K Assassin's Creed Odyssey Results:142fps
對照組
Ryzen 9 7950X Assassin's Creed Odyssey Benchmark Results:128fps
對照組
Core i9-13900KS 4K Results:142fps
Assassin's Creed Odyssey 4K Benchmark比較表
⇧單位: Performance Score (數字愈大愈好)
i.Total War: Three Kingdoms《全軍破敵:三國》
《全軍破敵:三國》(英語:Total War: Three Kingdoms,中國大陸譯作「全面戰爭:三國」)是一款由 Creative Assembly開發、由 SEGA發行的回合制策略遊戲。該遊戲原計劃於 2018年秋季發售,後經過兩次跳票延期至 2019年 5月 23日發售,首周單周銷量達 100萬,19萬玩家同時線上,創下全軍破敵系列之最
7950X3D 4K Total War: Three Kingdoms Results:118fps
對照組
Ryzen 9 7950X Total War: Three Kingdoms Benchmark Results:117.8fps
對照組
Core i9-13900KS 4K Results:119fps
Total War: Three Kingdoms 4K Benchmark比較表
⇧單位: Performance Score (數字愈大愈好)
j.Total War: Warhammer《全軍破敵:戰鎚》
Total War: Warhammer《全軍破敵:戰鎚》(英語:Total War: Warhammer,中國大陸譯作「全面戰爭:戰錘」)是一款由 Creative Assembly開發,經 SEGA公司通過Steam向Microsoft Windows、Linux、Mac OS平台發行的電子遊戲。本作結合了全軍破敵系列的玩法和 Games Workshop公司戰鎚系列的背景設定;所以是全軍破敵系列第一款非歷史背景的作品。本作是《全軍破敵系列》第十部作品及「全軍破敵:戰鎚」三部曲的首作
Setting
Ryzen 9 7950X3D
Battle Benchmark 4K 104.8fps
Ryzen 9 7950X3D
Campaign Benchmark 4K 106.3fps
對照組
Ryzen 9 7950X Battle Benchmark 4K 103.5fps
對照組
Ryzen 9 7950X Campaign Benchmark 103.4fps
對照組
Core i9-13900KS Battle Benchmark 4K 106.3fps
Core i9-13900K Campaign Benchmark 106.7fps
Total War: Warhammer 4K Benchmark比較表
⇧單位: Performance Score (數字愈大愈好)
k.Tom Clancy's Ghost Recon: Breakpoint Benchmark《火線獵殺:絕境》
Tom Clancy's Ghost Recon: Breakpoint Benchmark《火線獵殺:絕境》中國大陸譯作「幽靈行動:斷點」,全稱「湯姆·克蘭西之火線獵殺:絕境」)是一款由育碧巴黎開發,育碧發行的戰術射擊遊戲。本作是火線獵殺系列的第 8部作品。遊戲於 2019年 10月 4日在 PlayStation 4、Xbox One和 Windows平台發售,遊戲在發售後獲得了業界相當一般的評價
Ryzen 9 7950X3D Tom Clancy's Ghost Recon: Breakpoint 4K Benchmark 25654分
對照組
Ryzen 9 7950X Tom Clancy's Ghost Recon: Breakpoint Benchmark 24735分
對照組
Core i9-13900KS Tom Clancy's Ghost Recon: Breakpoint Benchmark 25554分
Tom Clancy's Ghost Recon: Breakpoint 4K Benchmark比較表
⇧單位: Performance Score (數字愈大愈好)
l.Ashes of the Singularity Benchmark《奇點灰燼》
Ashes of the Singularity Benchmark《奇點灰燼》是一款科幻即時戰略遊戲,號稱全球首款基於 Win10系統的 DX12遊戲,采用 Oxide Games的 Nitrous引擎打造,背景設定在遙遠的未來,那時人類完全以意識形態存在,人們已經掌握了上帝一樣的力量。但是人類發現自己已經處於戰爭之中,敵人就是一個叫做 “Haalee”的具有意識形態的 AI,企圖推翻人類在宇宙之中的統治地位
Ryzen 9 7950X3D Ashes of the Singularity Benchmark Results:205.4fps
對照組
Ryzen 9 7950X Ashes of the Singularity Benchmark Results:205fps
對照組
Core i9-13900KS Ashes of the Singularity Benchmark Results:214.4fps
Ashes of the Singularity Benchmark測試比較表
⇧單位:fps數字愈大愈好
m.Gears 5 《戰爭機器 5》
《戰爭機器 5》(英語:Gears 5)是一款已上市的第三人稱射擊的電子遊戲,由 The Coalition 製作,並由 Xbox遊戲工作室作為 Xbox Play Anywhere 的一部份發表於 Microsoft Windows 和 Xbox One 平台上。這是第六款《戰爭機器》系列的遊戲,同時作為 2016年的作品《戰爭機器 4》的續作。該作品已在 2019年 9月 10日正式發行。2020年 3月,The Coalition確認本作將在新世代主機 Xbox Series X發售首日發布對應新平台主機的版本
Ryzen 9 7950X3D Gears 5 Benchmark 4K Results:178.7fps
對照組
Ryzen 9 7950X Gears 5 Benchmark 4K Results:178.1fps
對照組
Core i9-13900KS Gears 5 Benchmark 4K Results:178.7fps
Gears 5 Benchmark測試比較表
⇧單位:fps數字愈大愈好
i.Final Fantasy XIV Benchmark《太空戰士14:重生之境》
《Final Fantasy XIV》(日語:ファイナルファンタジーXIV,英語:Final Fantasy XIV)是 Final Fantasy系列的第 14部本傳遊戲,也是繼《Final Fantasy XI》之後又一款大型多人線上角色扮演遊戲。遊戲由史克威爾艾尼克斯開發並發行,依照傳統,太空戰士都有 Benchmark的項目
Ryzen 9 7950X3D Final Fantasy XIV Benchmark:35172分
對照組
Ryzen 9 7950X Final Fantasy XIV Benchmark:26501分
對照組
Core i9-13900KS Final Fantasy XIV Benchmark:30200分
Final Fantasy XIV Benchmark測試比較表
⇧單位:Score數字愈大愈好
評比 :
在採用 3D V-Cache技術的「Zen 4」 Ryzen 9 7950X3D處理器解禁前,地表最強之遊戲處理器王座仍由 Core i9-13900KS所擁有,而當 Ryzen 9 7950X3D處理器效能解禁之後,採用 3D V-Cache技術的「Zen 4」 Ryzen 9 7950X3D處理器則讓 AMD重返了地表最強遊戲處理器的王座,原因是 Ryzen 9 7950X3D處理器之 L2+L3 Cache由原本的 Ryzen 9 7950X之 16+64MB提升至 16+128MB因而提供了更強悍的效能
在頻率功耗溫度比較方面,Ryzen 9 7950X3D處理器因為頻率略低於 Ryzen 9 7950X,因此功耗亦隨著降低,有關 Ryzen 9 7950X3D、Ryzen 9 7950X、13900KS、13900K之頻率功耗溫度比較請詳下表
頻率功耗溫度比較表
⇧單位: 頻率、°C、W
Ryzen 7000X3D系列處理器擁有更高的頻寬及更低的延遲,由於 3D V-Cache技術將資料保存在邏輯電路附近,也因此縮短了資料處理傳輸間的距離並得以加速運算,Ryzen 9 7950X3D處理器並且將 TDP由 170W降至 120W,但最大 Boost頻率仍維持在 5.7GHz,倘若在 TDP不降的情況下,以相同之供電 Ryzen 7950X3D處理器之效能將更加的強大,但從以上的測試可以看出,在 TDP實測只有 111W的 Ryzen 9 7950X3D仍然奪下地表最強遊戲處理器的王座,惟因頻率較低也使 Ryzen 9 7950X3D在內容創作方面表現不如遊戲的表現那麼亮麗
接著來進行各項遊戲評測比較,首先是 Ryzen 9 7950X3D Far Cry 5 4K Benchmark Ave 192fps測試比較,從下面的比較表中我們可以看出 Ryzen 9 7950X3D在 Far Cry 5 4K Benchmark測試項目中對 Core i9-13900KS、Core i9-13900K皆有些微領先,對 R9 7950X則有 8.5%的領先
Far Cry 5 4K Benchmark比較表
⇧ Far Cry 5 《極地戰嚎5》Benchmark比較表 單位:Performance Score(數字愈大愈好)
接著是 Ryzen 9 7950X3D Far Cry 6 4K Benchmark Ave測試比較,從下面的比較表中我們可以看出 Ryzen 9 7950X3D在 Far Cry 6 4K Benchmark測試項目中對 Core i9-13900KS打成平手,對 Core i9-13900K則是些微的勝出,對 R9 7950X則有 6.4%的領先
Far Cry 6 4K Benchmark比較表
⇧單位: Performance Score (數字愈大愈好)
接著是 Ryzen 9 7950X3D Shadow of the Tomb Raider 4K Benchmark測試比較,從下面的比較表中我們可以看出 Ryzen 9 7950X3D在 Shadow of the Tomb Raider 4K Benchmark測試項目中表現特別亮眼,Ryzen 9 7950X3D對 Core i9-13900KS、Core i9-13900KS均有 13.5%的領先,對 R9 7950X則有 25.7%的領先
Shadow of the Tomb Raider 4K Benchmark比較表
⇧單位: Performance Score (數字愈大愈好)
接著是 Ryzen 9 7950X3D 在 DIRT 5試比較,從下面的比較表中我們可以看出 Ryzen 9 7950X3D在 DIRT 5 4K Benchmark測試項目中對 Core i9-13900KS及 Core i9-13900K均為領先,對 R9 7950X則領先幅度多一些
DIRT5 4K Benchmark比較表
⇧單位: Performance Score (數字愈大愈好)
在遊戲 Assassin's Creed Odyssey《刺客信條奧德賽》的 Benchmark方面從下表中看到 Ryzen 9 7950X3D對上 Core i9-13900KS打平,對 Core i9-13900K以及 R9 7950X則均有勝出
⇧ Assassin's Creed Odyssey《刺客信條奧德賽》Benchmark比較表 單位 : Performance Score(數字愈大愈好)
在遊戲 Total War: Warhammer 4K Benchmark的效能上,從下表中看到 Ryzen 9 7950X3D對上 Core i9-13900KS些微落後,對 Core i9-13900K、Ryzen 9 7950X則是些微勝出的
Total War: Warhammer 4K Benchmark比較表
⇧單位: Performance Score (數字愈大愈好)
在遊戲 Tom Clancy's Ghost Recon: Breakpoint Benchmark《火線獵殺:絕境》之效能方面,從下表中看到 Ryzen 9 7950X3D對上 Core i9-13900KS、 Core i9-13900K、Ryzen 9 7950X均是勝出的,對 Ryzen 9 7950X的勝出幅度尤其出色
Tom Clancy's Ghost Recon: Breakpoint Benchmark《火線獵殺:絕境》
⇧單位: Performance Score (數字愈大愈好)
在遊戲 《戰爭機器 5》(英語:Gears 5)中之效能,從下比較表中看到 Ryzen 9 7950X3D對上 Core i9-13900K、Ryzen 9 7950X均勝出,對上 Core i9-13900KS則是平手
《戰爭機器 5》測試比較表
⇧單位:fps數字愈大愈好
接著是 UNIGINE Superposition 4K Benchmark測試比較,從下面的比較表中我們可以看出 Ryzen 9 7950X3D在 UNIGINE Superposition 4K Benchmark測試項目中對 Core i9-13900KS只有些微差距落後,但對 Core i9-13900K亦勝出,對 R9 7950X則有 1.5%的領先
UNIGINE Superposition 4K Benchmark比較表
⇧單位: Performance Score (數字愈大愈好)
在遊戲應用程式 Final Fantasy XV《太空戰士 15》 Benchmark之效能方面,從下表中看到 Ryzen 9 7950X3D對上 Core i9-13900KS兩者效能在誤差範圍之內,對 Core i9-13900K則小幅勝出,對 Ryzen 9 7950X有 2.9%的勝出
Final Fantasy XV 4K Benchmark比較表
⇧ Final Fantasy XV《太空戰士 15》Benchmark比較表 單位 : Performance Score(數字愈大愈好)
在遊戲應用程式 Final Fantasy XIV Benchmark《太空戰士14:重生之境》的 Benchmark之效能比較,從下表中看到 Ryzen 9 7950X3D對上 Core i9-13900KS、Core i9-13900K均為大勝,對 Ryzen 9 7950X之勝差尤其多
Final Fantasy XIV Benchmark《太空戰士14:重生之境》比較表
⇧ Final Fantasy XIV Benchmark《太空戰士14:重生之境》比較表 單位 : Performance Score(數字愈大愈好)
接著來看內容創作,在內容創作效能比較方面,Ryzen 9 7950X3D對上 Core i9-13900KS、Core i9-13900K是互有輸贏,但對 Cire i9-13900K勝率較多,在吾人常用的 WebXPRT 3 Benchmarks以及 UL Procyon Photo Editing兩個重要的的效能比較則均是 Ryzen 9 7950X3D勝出
在WebXPRT 3 Benchmarks之瀏覽器基準測試中,Ryzen 9 7950X3D表現最為出色,Ryzen 9 7950X3D對上 Core i9-13900KS,Ryzen 9 7950X3D比 Core i9-13900Ks的效能高了有 7.5%,對 Ryzen 9 7950X更高出了 19.1%
WebXPRT3 Benchmark比較表
⇧WebXPRT 3 Benchmarks比較表 單位: :Performance Score (數字愈大愈好)
在 UL Procyon Video Editing Benchmarks (Adobe Premiere Pro) 之內容創作測試中,Ryzen 9 7950X3D雖小敗給 Core i9-13900KS,但對 Core i9-13900K則勝出了 4.3%
UL Procyon Video Editing Benchmark比較表
⇧單位: Performance Score (數字愈大愈好)
在 UL Procyon Photo Editing Benchmarks (吾人常用到的 Adobe Lightroom classic、Adobe Photoshop)之創作測試中,Ryzen 9 7950X3D對上 Core i9-13900KS、Core i9-13900K、7950X均為勝出
UL Procyon Photo Editing Benchmark比較表
⇧UL Procyon Photo Editing Benchmarks 比較表 單位: : Performance Score (數字愈大愈好)
接著來看看在 AIDA64 Memory Benchmark記憶體頻寬之效能比較,從下圖可以看出,因為新版 BIOS開放了對 Bandwidth的優化支援,讓 7950X3D之 DDR5 6000頻寬較 7950X高了許多
AIDA64 Cache & Memory Benchmark比較表
⇧單位: MB/s (數字愈大愈好)
綜合以上,Ryzen 9 7950X3D在與 Core i9-13900KS、Core i9-13900K、Ryzen 9 7950X在所有遊戲中的勝率最高,因此 Ryzen 9 7950X3D榮登當今地表最強遊戲處理器實是實至名歸
在這 DDR5跨世代變革之際 AMD之 AM5平台已不再對 DDR4平台的支持,但在 DDR5頻率方面在不挑處理器的情況之下,現階段 AM5平台之 DDR5頻率約略落在 DDR5 6000,相對友商之 DDR5 7200,AMD則還有進步的空間,但這或許 是因為一直以來 AMD對穩定的要求一直比追求效能更為重視,以致與於對 BIOS在 DDR5的開放權限不如友商來的高有關,倘若能將 BIOS在 DDR5的權限適度的多開放一些, Ryzen 9 7950X3D的效能則還會再更加提升
AMD自 2017推出第一代 Ryzen桌上型處理器發表至今已經 5年多,Ryzen桌上型處理器由漸入佳境至碩果累累,為滿足使用者需求,AMD Ryzen桌上型處理器一代強於一代是有目共睹,AMD秉持突破再創新,這一次並以 Ryzen 9 7950X3D處理器繼續引領遊戲與內容創作之高性能先驅,並奪回了地表最強之遊戲處理器王座,再次驗證了 AMD的努力一直都有回報,謝謝收看