前言:
地表最強 5nm非 X版本之 AMD Ryen 7000系列桌上型處理器將於 1/10上市開賣,滄者也在第一時間為您一一奉上 Ryzen 9 7900、Ryzen 7 7700、Ryzen 5 7600之各項測試,而本篇為 Ryzen 7 7700效能測試,所有的測試均有實測圖並與 Ryzen 9 7900X、Ryzen 7 7700X、Ryzen 5 7600X比較;Ryzen 7 7700處理器相對應不鎖頻版本之 Ryzen 7 7700X處理器有著相同的核心數量,不過非 X版本的處理器頻率與功耗本來就比 X版本低,所有非 X版的處理器的功耗均為 65W,而且 Ryzen 9 7900、Ryzen 7 7700還隨盒附贈 Wraith Prism RGB LED CPU cooler,Ryzen 5 7600則附贈 Wraith Stealth CPU cooler,且售價也相對 X版本便宜,有關非 X版 Ryzen 7000系列處理器與不鎖頻的 Ryzen 7000系列處理器版頻率售價功耗比較請詳下表
非 X版 Ryzen 7000系列處理器與不鎖頻的 Ryzen 7000系列處理器版頻率售價功耗比較表
AMD Ryzen 9 7900X:12C24T/ 4.7~5.6GHz / 170W/ $549
AMD Ryzen 9 7900: 12C24T/ 3.6~5.4GHz / 65W /$429 /Wraith Prism RGB LED cooler
AMD Ryzen 7 7700X:8C16T / 4.5~5.4GHz /105W/ $399
AMD Ryzen 7 7700: 8C16T / 3.6~5.3GHz / 65W /$329 /Wraith Prism RGB LED cooler
AMD Ryzen 5 7600X:6C12T / 4.7~5.3GHz/ 105W/ $299
AMD Ryzen 5 7600: 6C12T / 3.8~5.1GHz/ 65W / $229 /Wraith Stealth cooler
另外與本篇同步發表的還有
地表最強 5nm非X版本處理器現身,看 AMD Ryzen 9 7900、Ryzen 7 7700、Ryzen 5 7600開箱及規格介紹
地表最強 5nm非 X版本處理器 Ryzen 9 7900測試,並與 Ryzen 9 7900X、Ryzen 7 7700X、Ryzen 5 7600X效能比較
地表最強 5nm非 X版本處理器 Ryzen 5 7600測試,並與 Ryzen 9 7900X、Ryzen 7 7700X、Ryzen 5 7600X效能比較
歡迎持續關注
測試元件:
Ryzen 7 7700

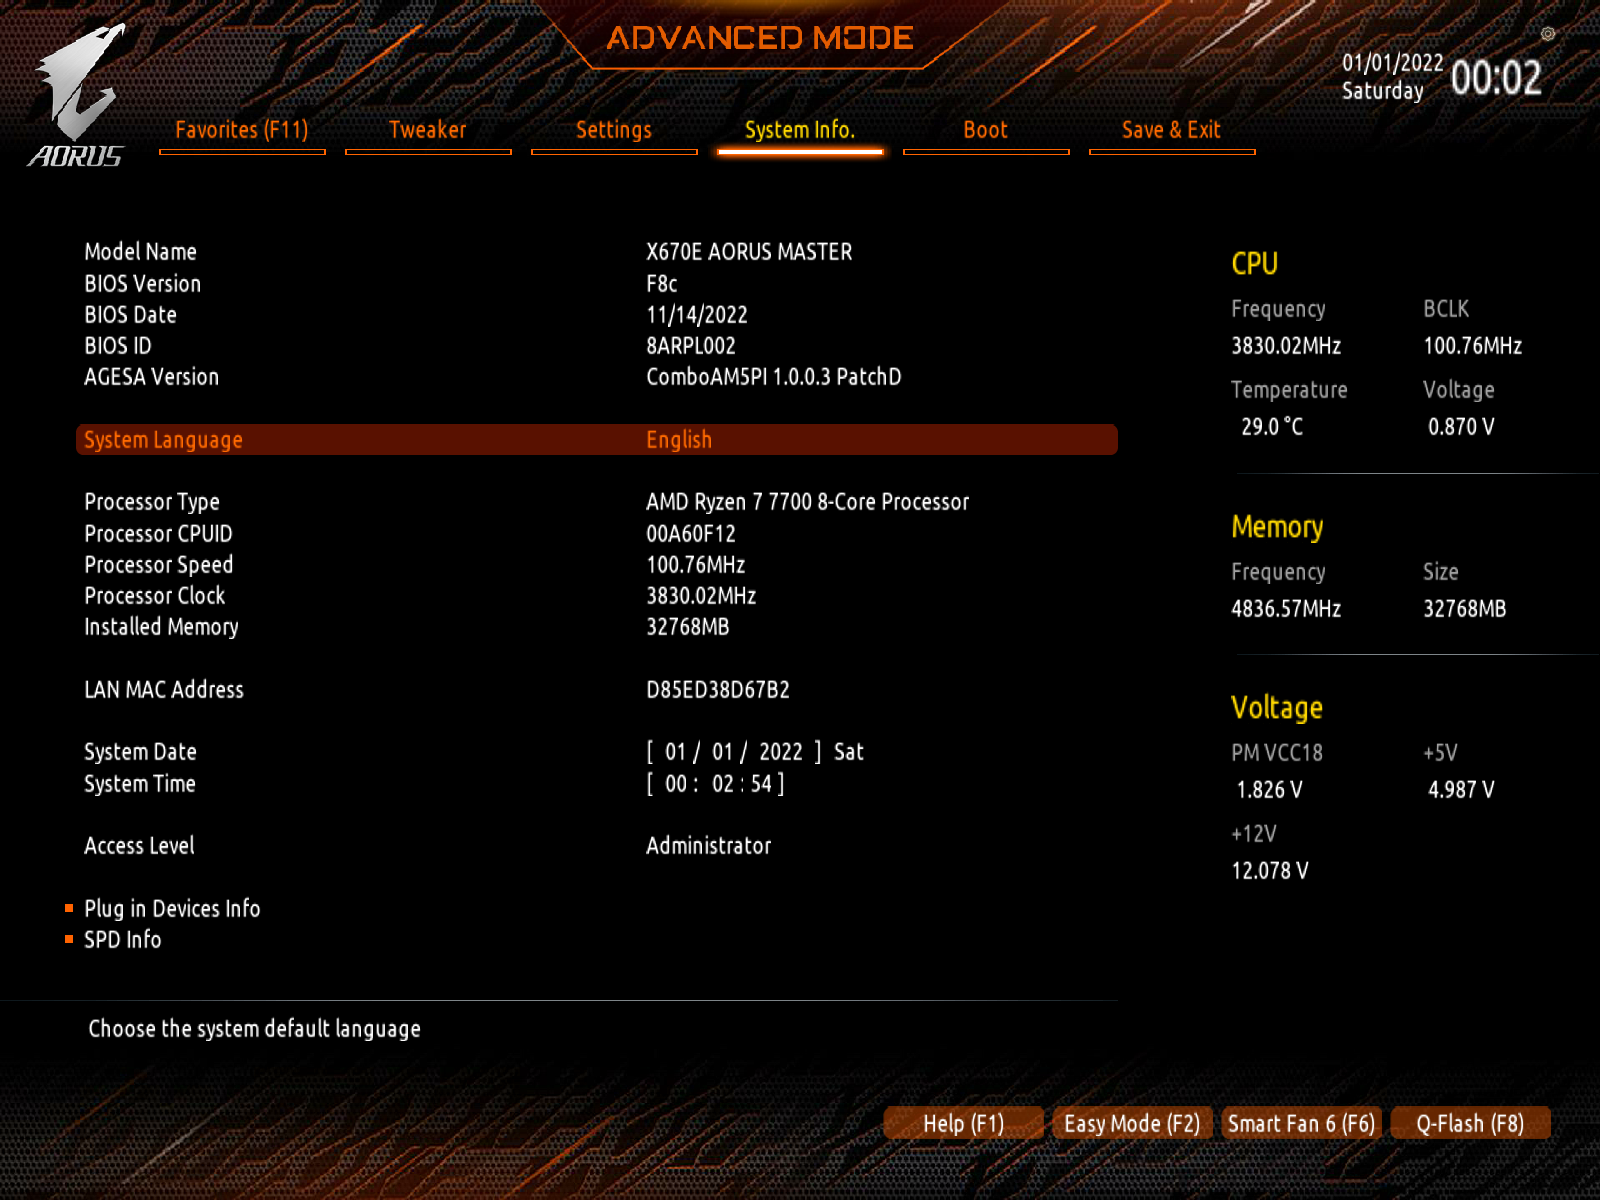
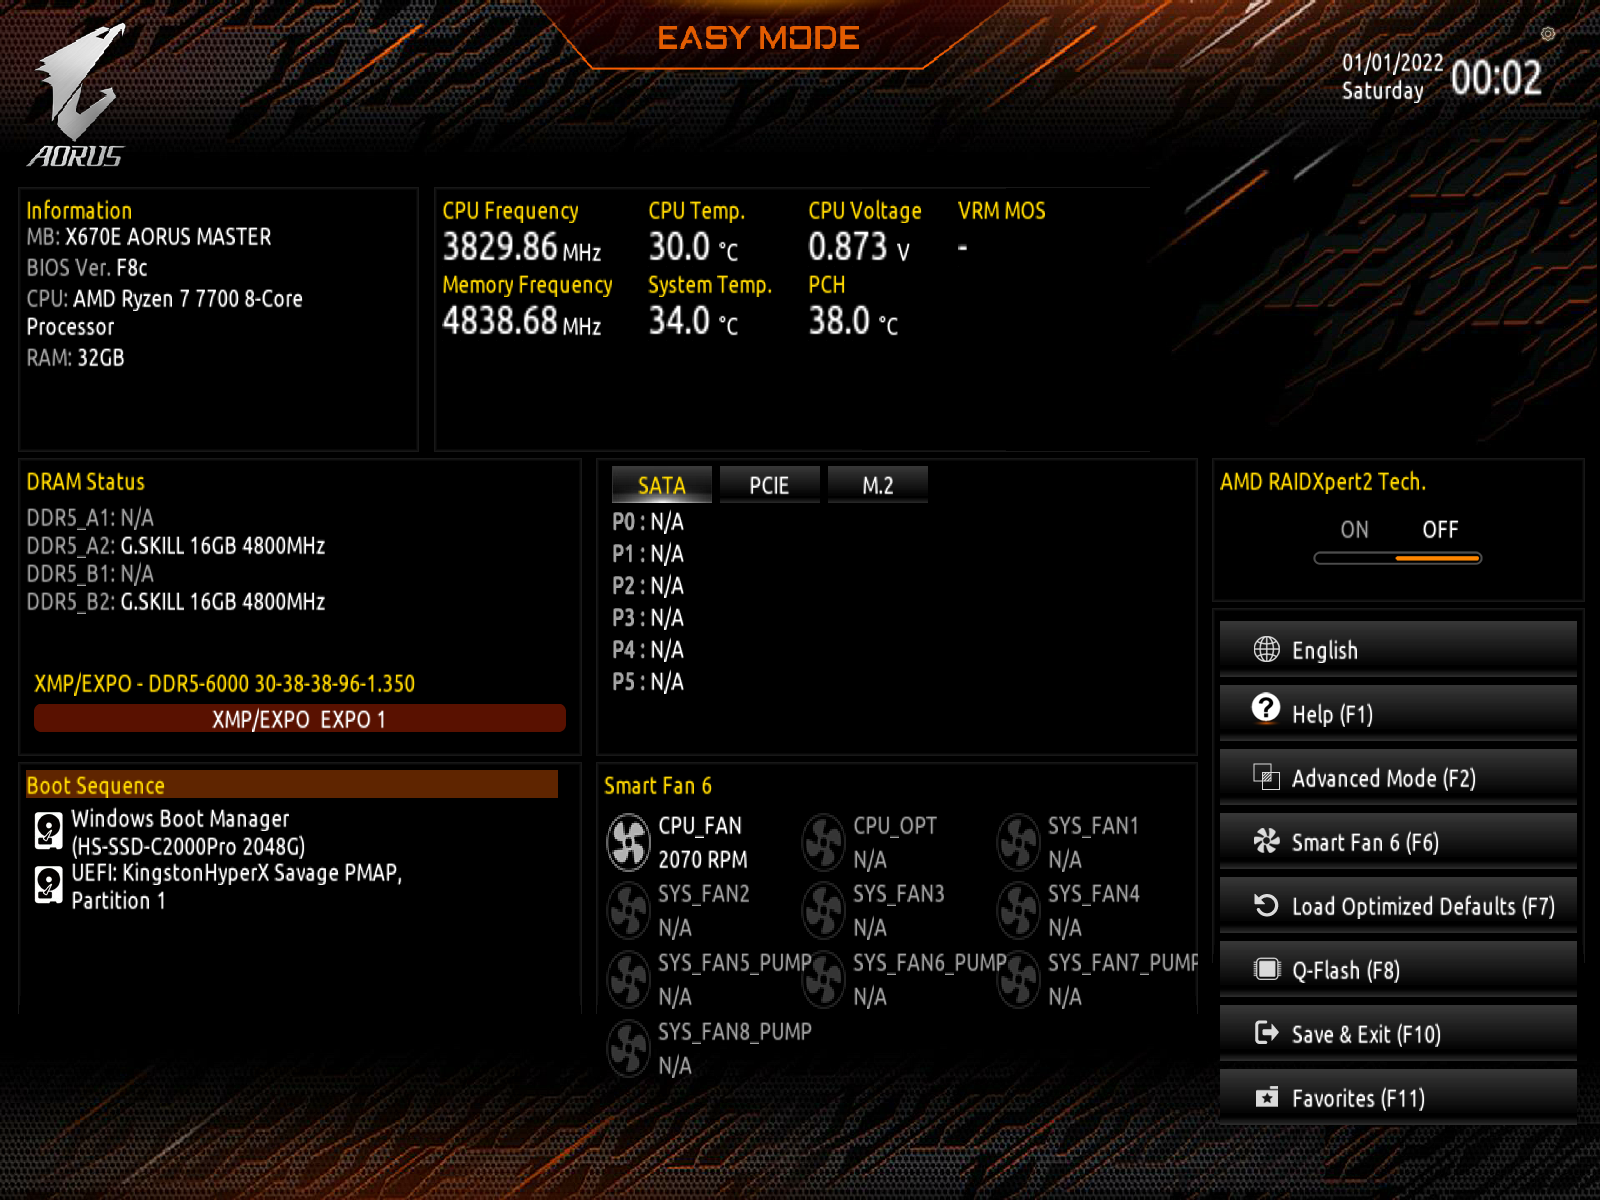
MOBO: GIGABYTE X670E AORUS MASTER
VGA CARD:AMD RX 6900 XT
RAM:G.SKILL Trident Z5 Neo DDR5 6000 16GBX2
測試平台
CPU: Ryzen 7 7700
CPU Cooler:Wraith Prism cooler
MB:GIGABYTE X670E AORUS MASTER
VGA:AMD RX 6900 XT
RAM:G.SKILL Trident Z5 Neo RGB DDR5 6000 16GBX2
RAM:GSKILL Trident Z DDR5 6000 16GB X2
PSU:GIGABYTE UD1000GM
OS:Windows11
電源計畫:Balanced
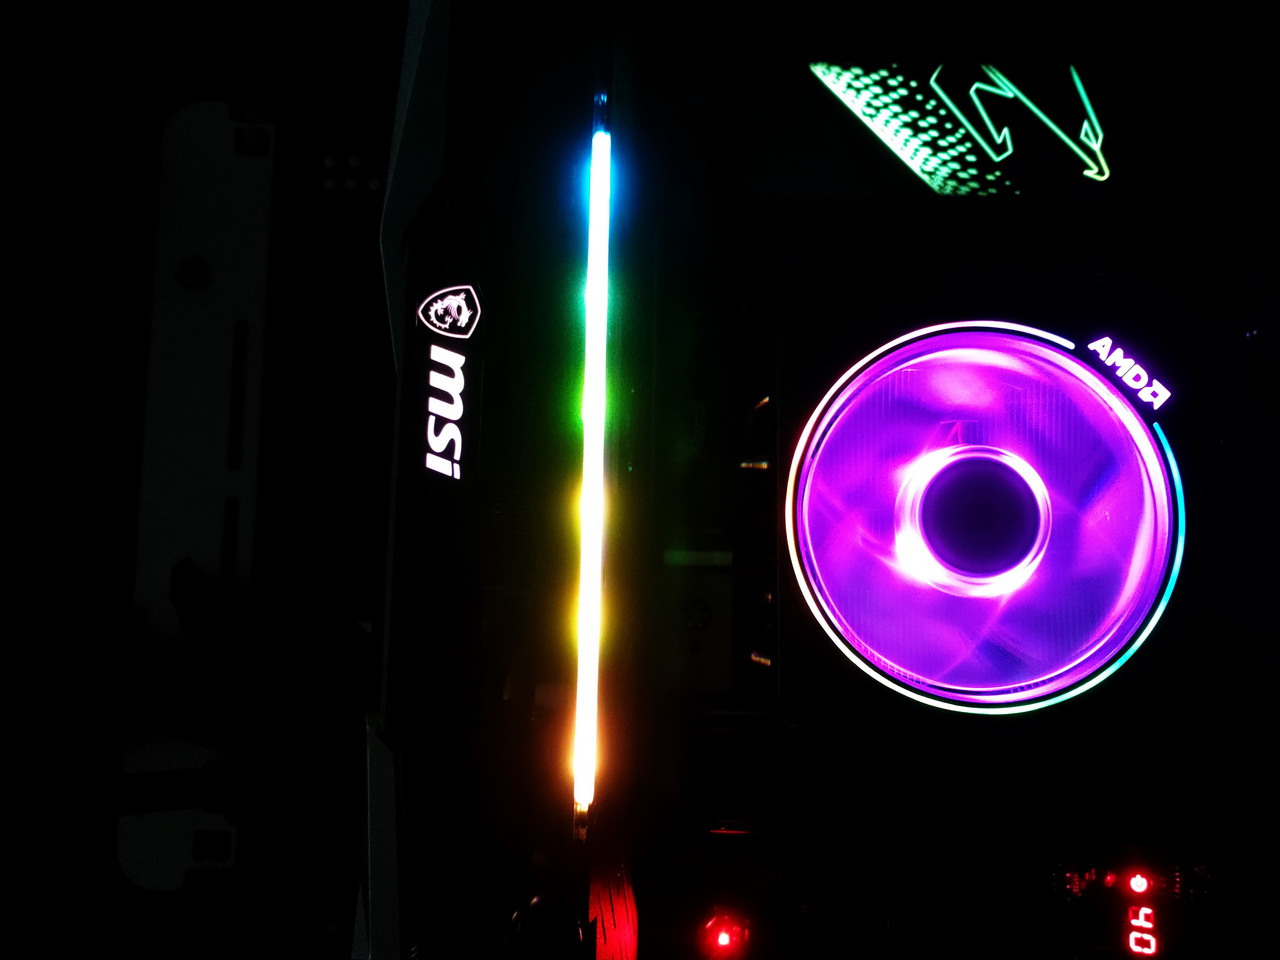
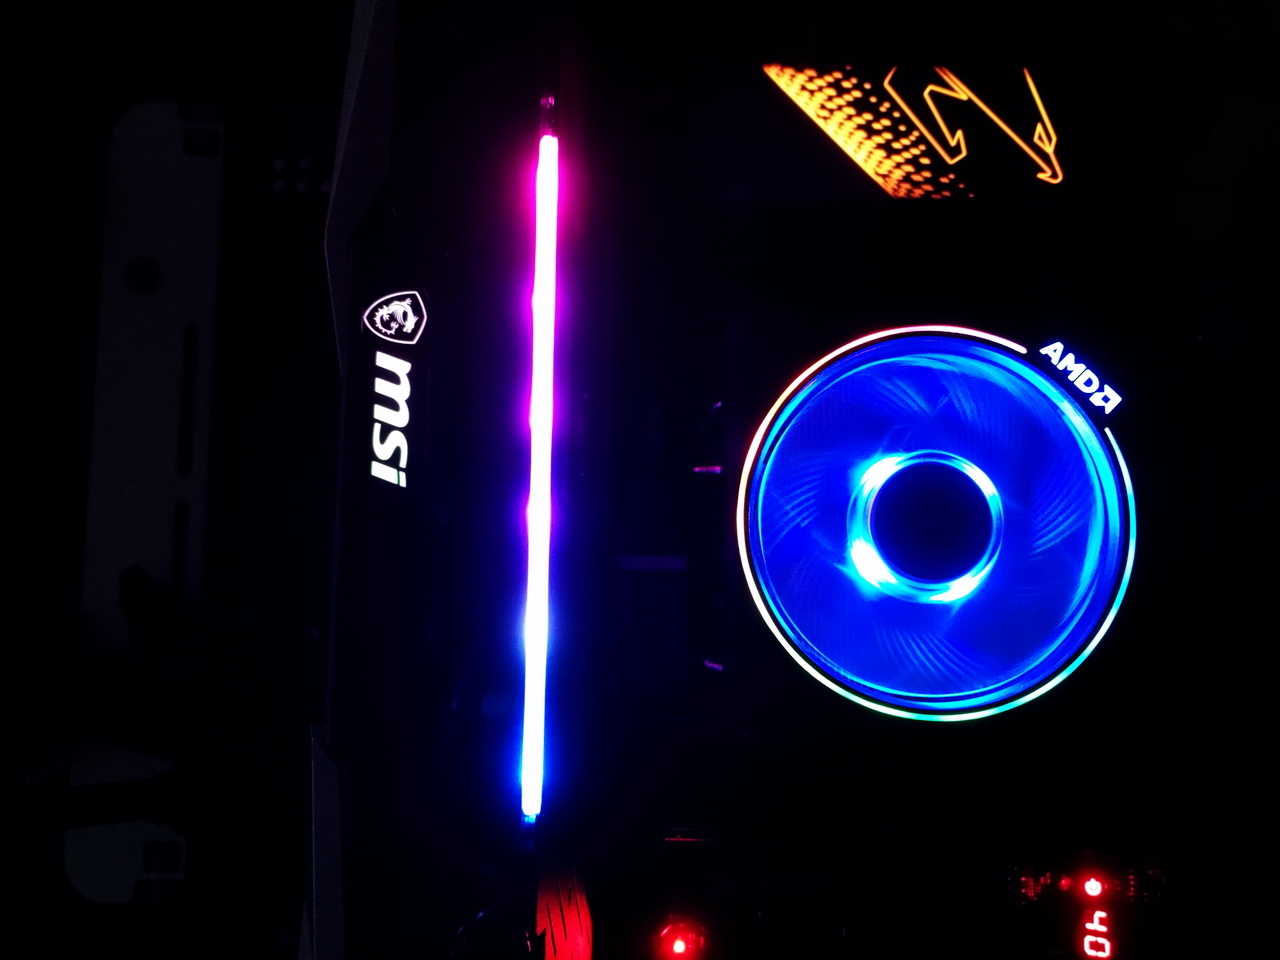
Wraith Prism RGB LED cooler之燈效
測試項目
A.一般測試
1.CrossMark 1.0.1.77 Pro
2.AIDA64 Cache & Memory Benchmark EXPO
3.Cinebench R23
4.PCMark10 applications benchmark
5.POV-Ray Benchmark
6.3DMark CPU Profile
7.WebXPRT3
8.UL Procyon Office Productivity Benchmark
9.WinRAR Benchmark
10.NVMe Gen4 SSD Crystal DiskMark7 Benchmark
11.Geekbench 5.4
12.CPUZ-Bench
13.CPUMark99
B.遊戲測試
a.Far Cry 5 Benchmark《極地戰嚎5》
b.Assassin's Creed Origins Benchmark《刺客教條:起源》
c.UNIGINE Superposition Benchmark
d.3DMark Time Spy
e.3DMark Time Spy Extreme
f.Final Fantasy XV Benchmark《太空戰士15:新帝國》
g.Far Cry 6《極地戰嚎6》
h.《 DIRT 5 》《大地長征 5》
i.Assassin's Creed Odyssey《刺客信條奧德賽》
j.Total War: Three Kingdoms《全軍破敵:三國》
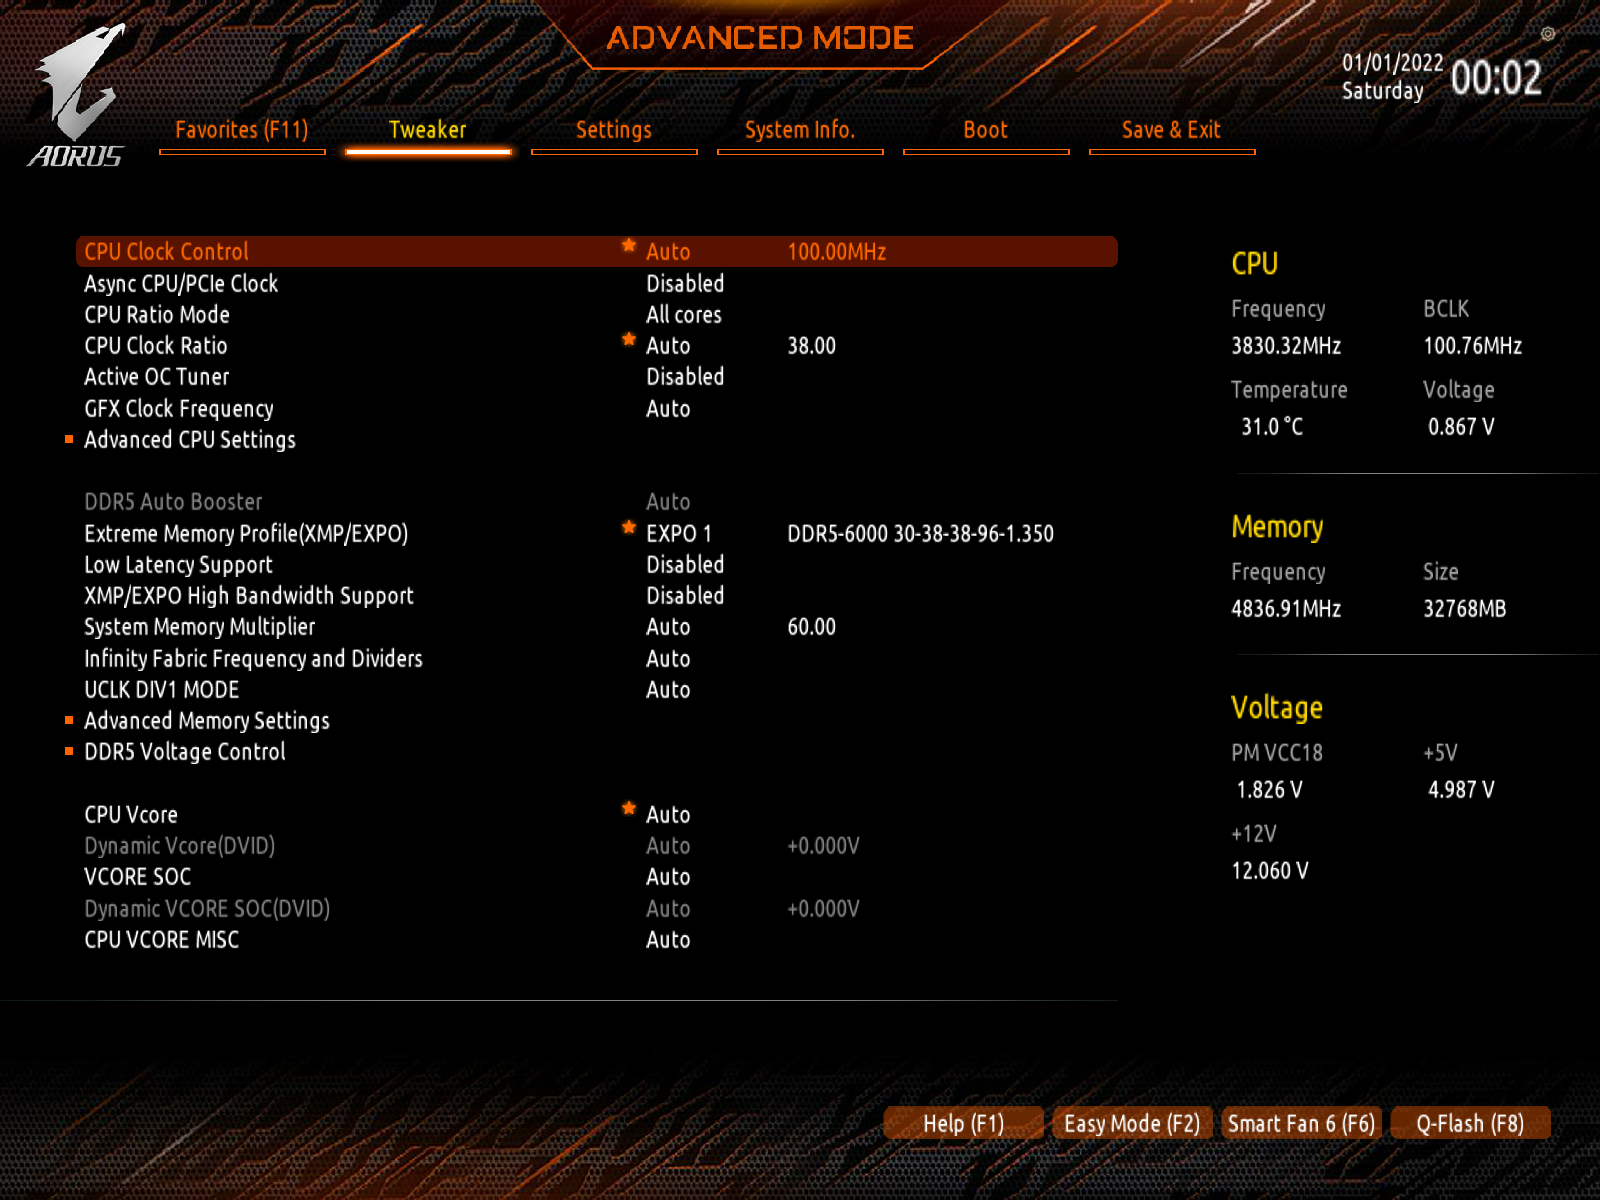
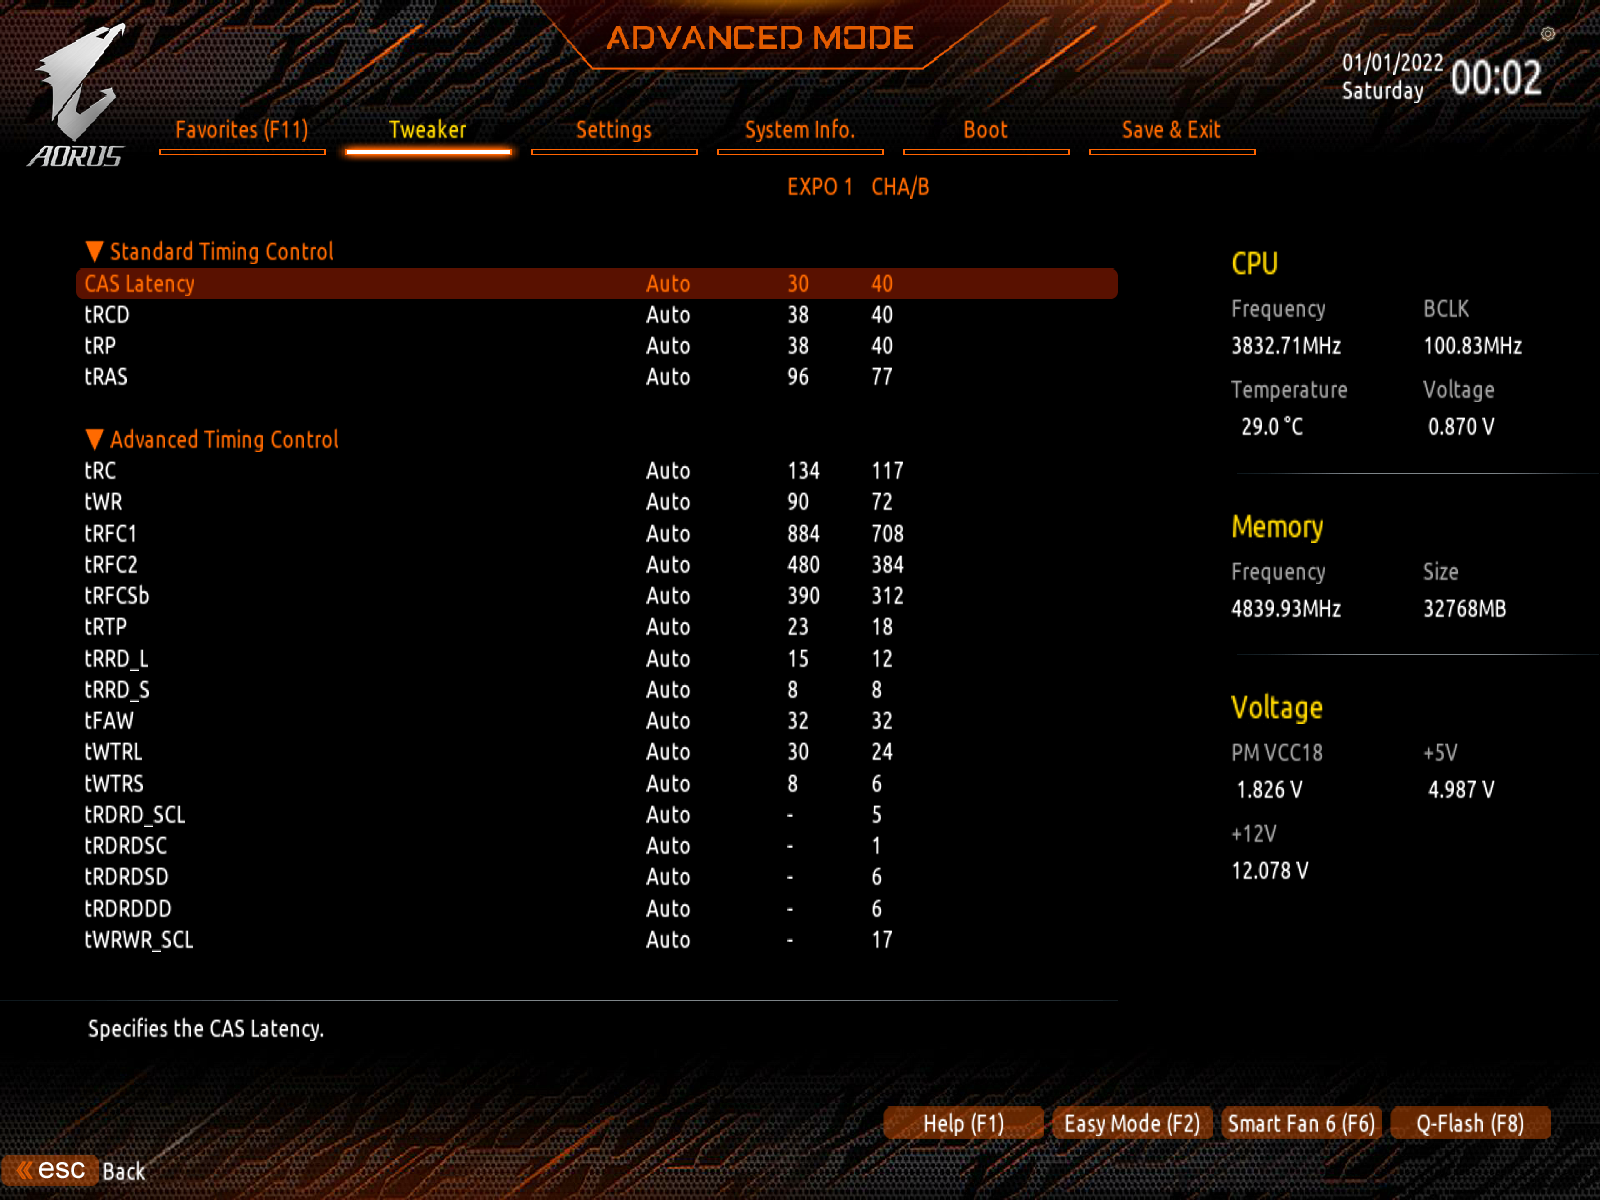
BIOS Setting F8C Ryzen 7 7700 EXPO 6000
A.一般測試[/B]
測試諸元
Ryzen 7 7700
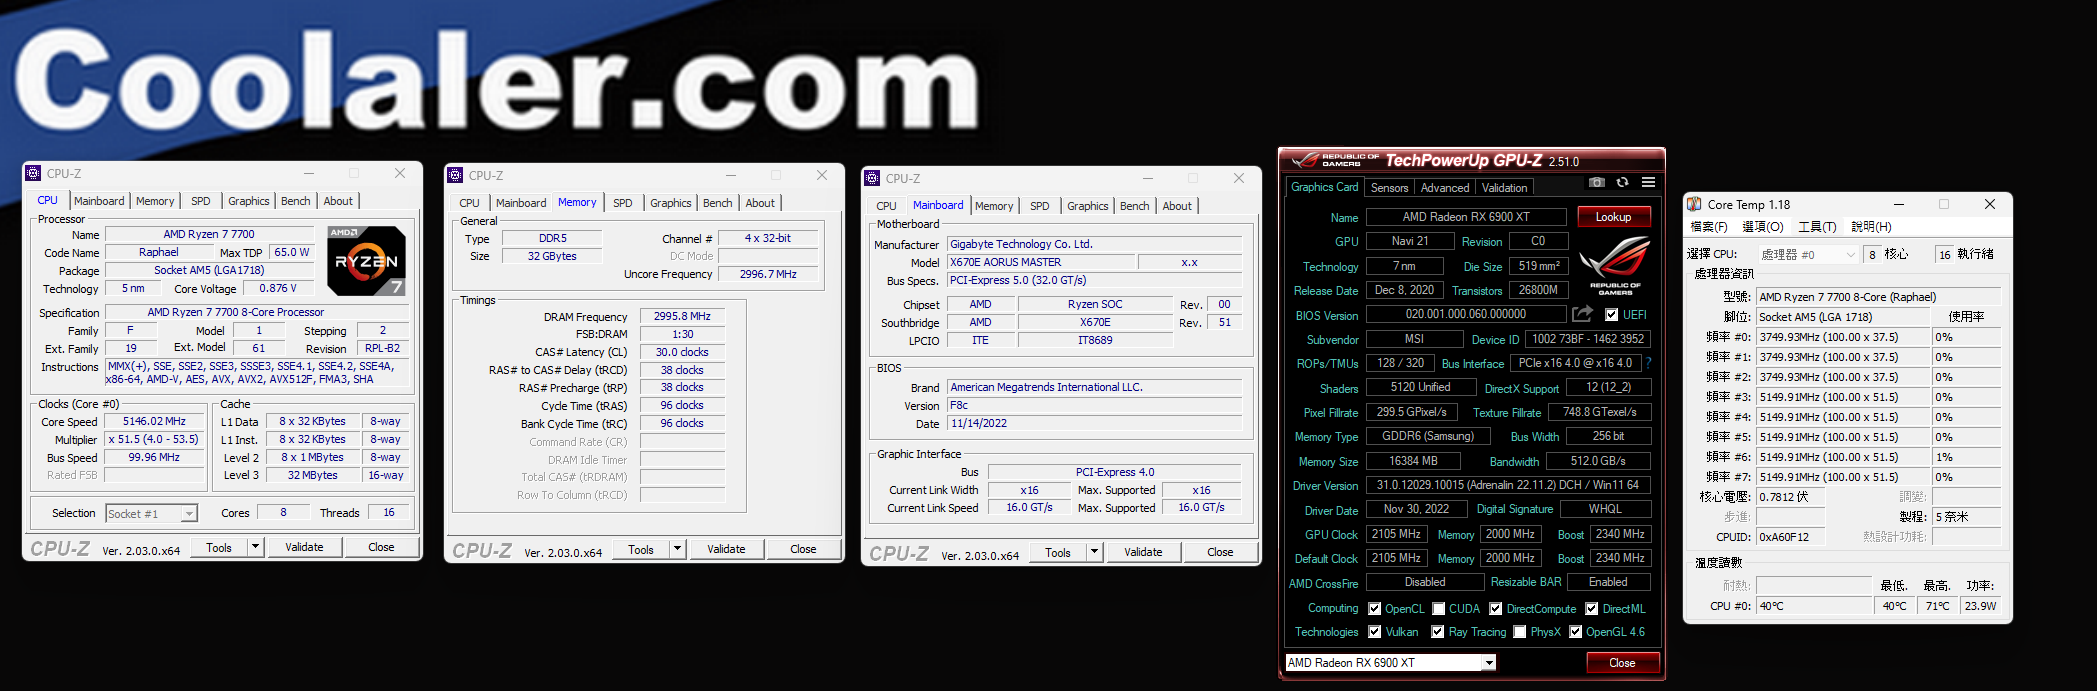
Ryzen 7 7700 AIDA64 Extreme CPU FPU Stress燒機測試 ,燒機頻率 5071MHz,最高溫度 75°C

Ryzen 7 7700 AIDA64 Extreme CPU FPU Stress燒機測試 ,最高功耗 90W

AIDA64 Extreme CPU FPU Stress燒機功耗溫度頻率比較表

1.CrossMark 1.0.1.77 Pro[/B]
CrossMark是一種新型的跨平台基準測試,用於衡量系統效能和使用對效能特徵建模的常見和相關工作負載的響應能力真實世界的應用程式,CrossMark使用開源和專有的組合工作負載來評估生產力、創造力和響應性 CrossMark安裝迅速,只需幾分鐘即可得出結果,整體性能評分旨在跟踪 SYSmark 25的評分,CrossMark還允許在一系列操作系統中進行比較
CrossMark為商業和政府 IT決策者、媒體、渠道購買者、顧問、系統和組件設計者和製造商,政府和非政府機構以及標準機構一種客觀,易於使用的評估 PC 的工具用戶可能遇到的各種活動的性能
CrossMark的其他功能和亮點包括:
• 跨架構系統基準測試 – 在 Windows、iOS 和 macOS上運行以評估性能,與操作系統無關。未來將添加更多平台
• 以真實應用為模型的系統基準測試-通過以下方式衡量普通用戶的性能使用開源和專有工作負載對真實應用程序進行建模
• 真實的性能擴展-在 CPU頻率上與實際應用程序類似地擴展,內核和線程、系統記憶體、存儲、GPU和其他功能
• 具有支持觸摸屏的直觀界面的輕量級安裝 – 簡化用戶從不到一分鐘的快速安裝過程開始的經驗,需要更少超過 1GB的存儲空間-用戶可以通過單擊或點擊屏幕開始基準測試
• 自動運行時支持-提供自動基準測試的選項,以簡化和簡化系統測量
• 在線系統性能數據庫-支持在線結果提交,以實現實時設備比較和評估
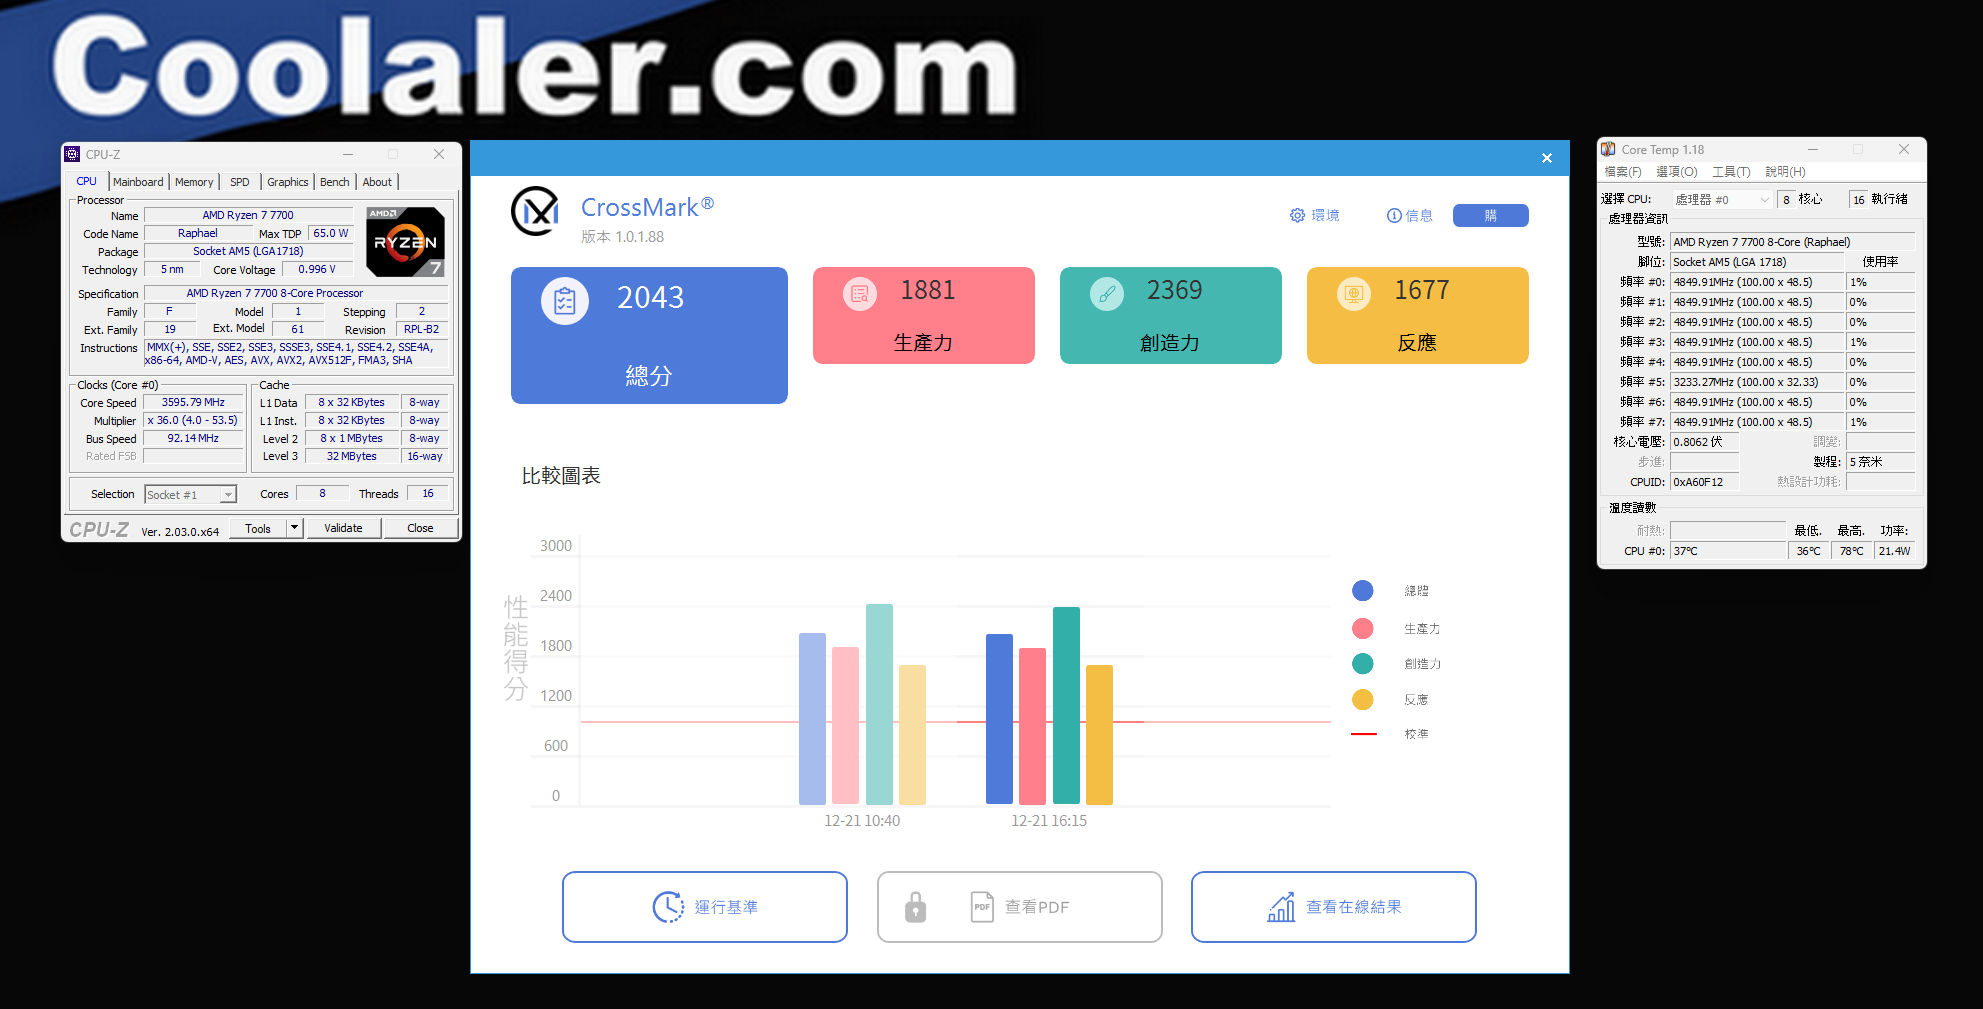
CrossMark Results
Ryzen 7 7700 Overall 2043、Productivity 1881、Creativity 2369、Responsiveness 1677
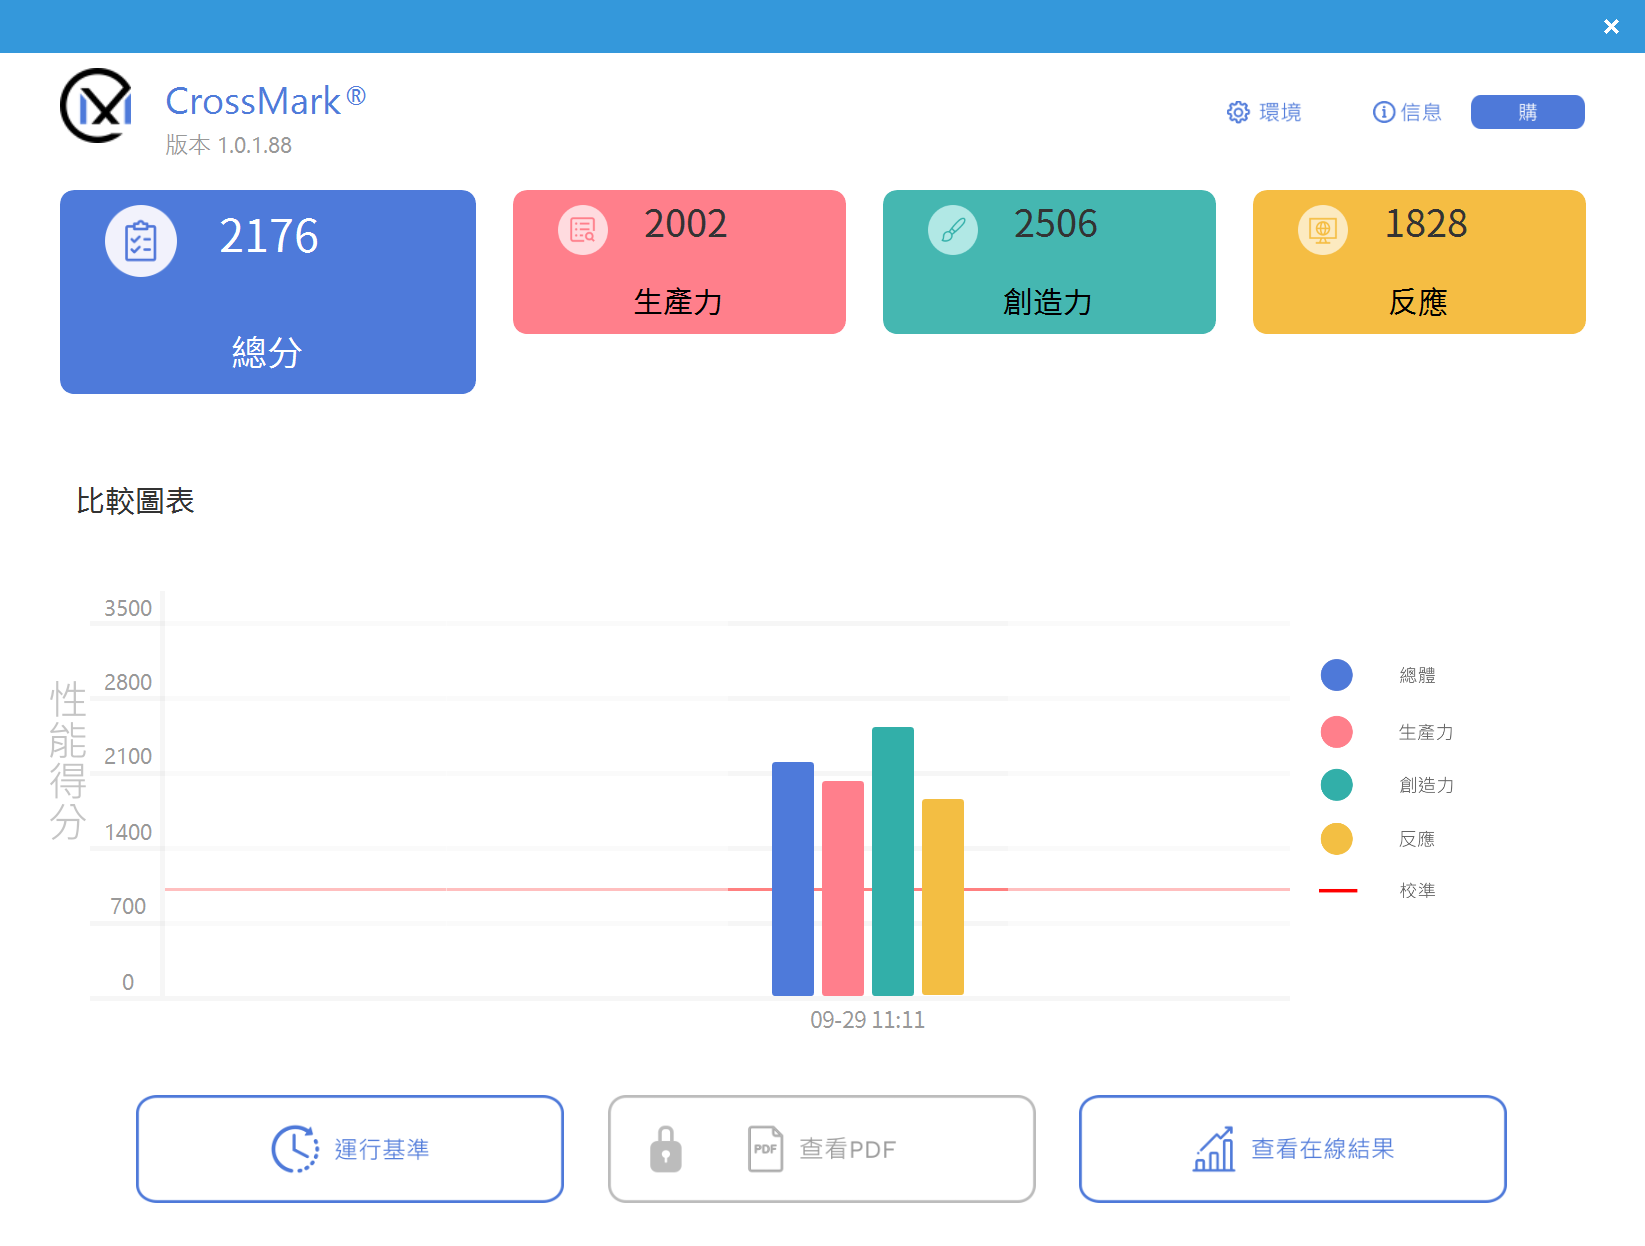
對照組
Ryzen 7 7700X Overall 2176、Productivity 2002、Creativity 2506、Responsiveness 1828
CrossMark Benchmark比較表

⇧單位: Performance Score (數字愈大愈好)
2.AIDA64 Cache & Memory Benchmark EXPO
AIDA64 Cache & Memory Benchmark可測量 CPU高速緩存和系統內存的帶寬和延遲。通過雙擊窗口中的任何矩形,列或行,我們可以單獨啟動基準測試或基準測試類型。例如,如果我們雙擊 “Memory”,則只會運行系統內存讀取,寫入,複製和延遲基準測試,即只執行給定行中的操作。同樣,如果我們雙擊 “Read”,則只會對所有內存類型運行讀取基準測試,即只執行給定列中的操作。如果我們雙擊任何矩形,則只會運行選定的單個基準
右鍵單擊 “Start Benchmark”按鈕將打開一個上下文菜單,我們可以在其中選擇運行所有基準測試或僅運行內存或緩存基準測試
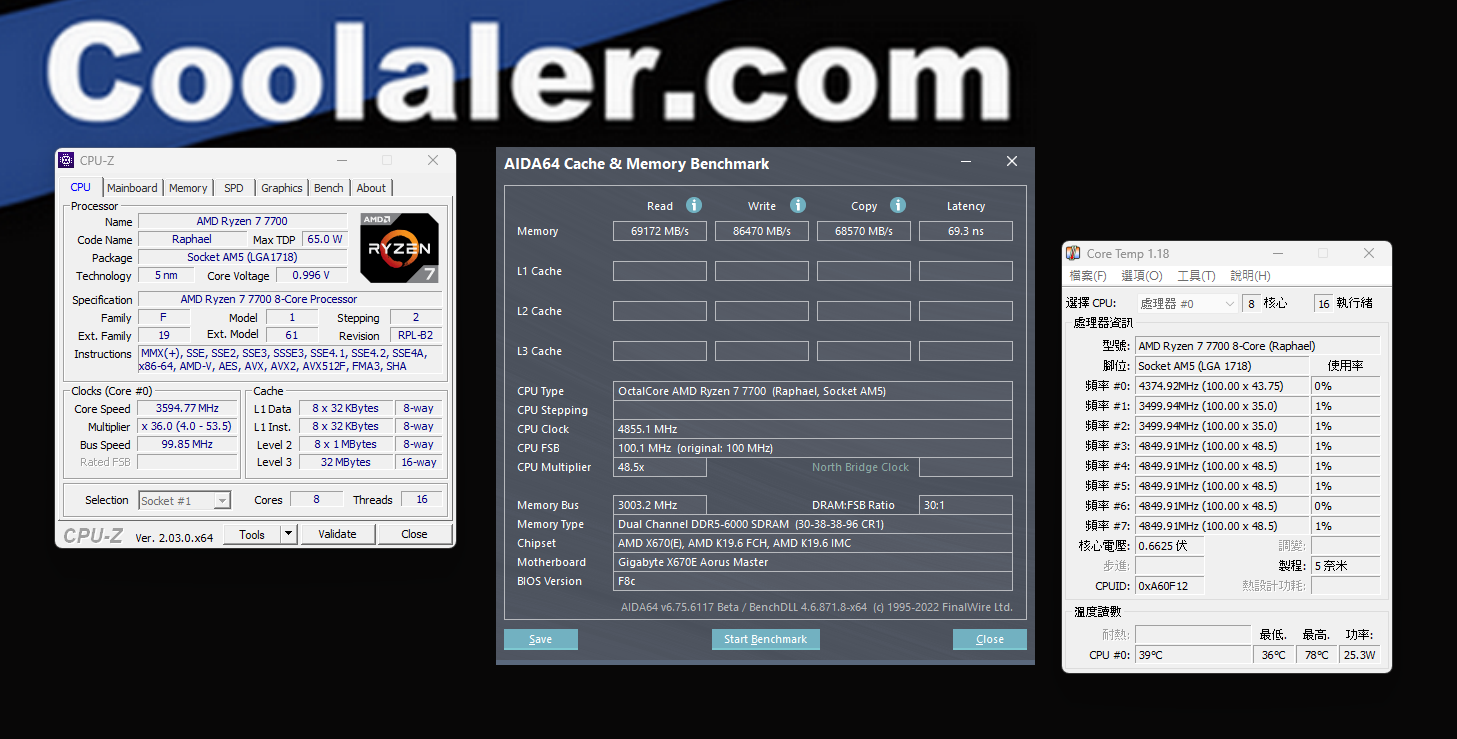
Ryzen 7 7700 EXPO DDR 5 6000 30-38-38-96-CR1
AIDA64 Cache & Memory Benchmark Results
Read 69,172MB/s
Write.86,470MB/s
Copy.68,570MB/s
Latency 69.3ns
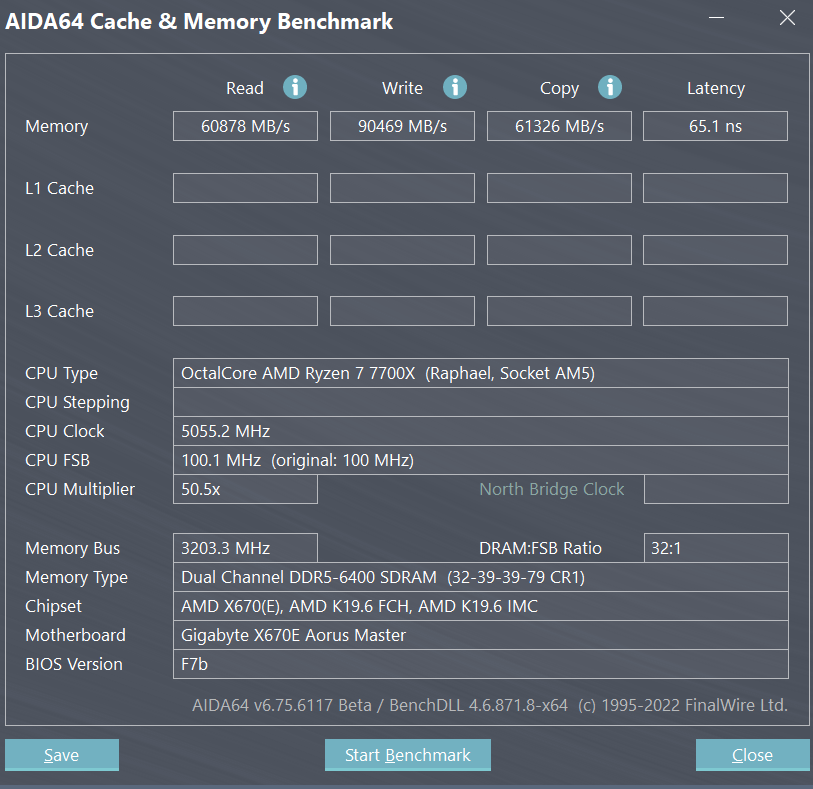
對照組
Ryzen 7 7700X DDR 5 6400 32-39-39-79-CR1
AIDA64 Cache & Memory Benchmark Results
Read 60,878MB/s
Write.90,469MB/s
Copy.61,326MB/s
Latency 65.1ns
3.Cinebench R23 CPU Test
Cinebench是一個真實的跨平台測試套件,用於評估計算機的硬件功能,現有最新版本已至 R23版本,由於它是 以 Cinema 4D動畫製作軟體為基礎進行測試,所以能夠反應出多線程處理器與顯示卡面對實際應用軟體所能發揮的效能,且能在短時間內得知測試結果,是一個能快速得知是否能 All Core 5GHz的測試軟體
Cinebench的改進反映了近年來 CPU和渲染技術的整體進步,為 Cinema 4D利用多個 CPU核心和普通用戶可用的現代處理器功能提供了更準確的測量,最重要的是它是免費的
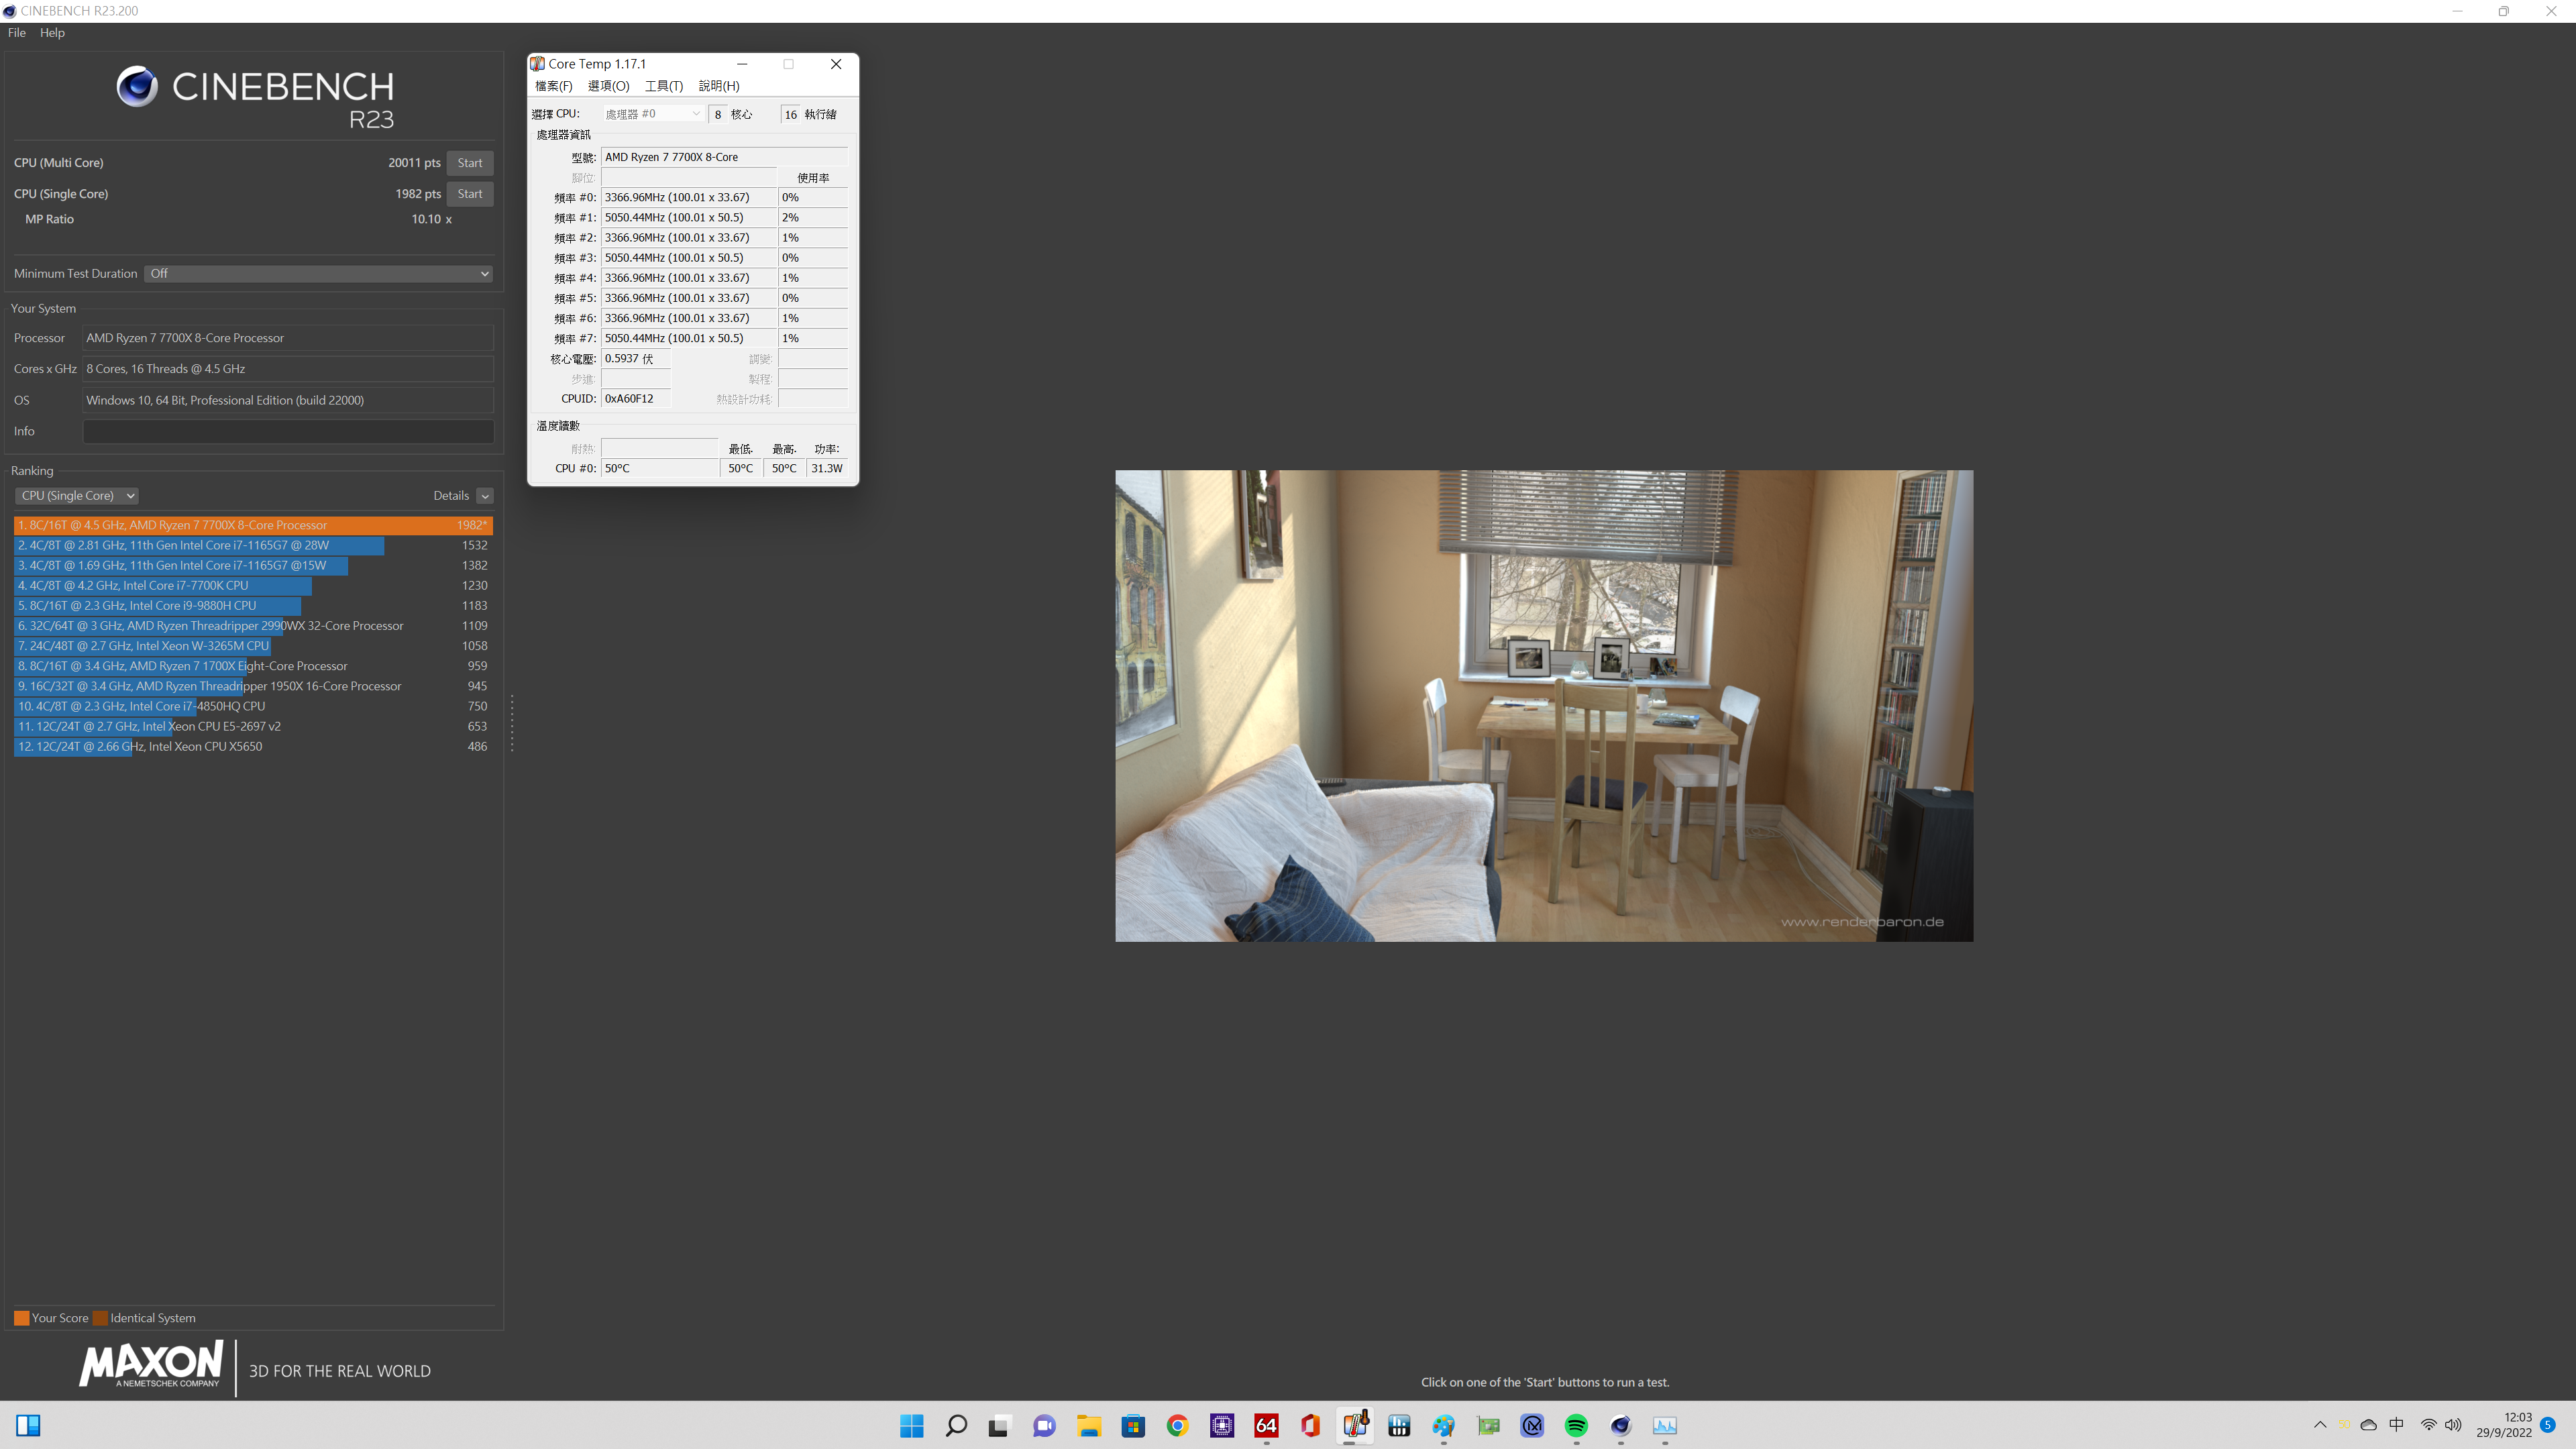
Cinebench R23 Results
Ryzen 7 7700 1T 1928pts、nT 18914pts
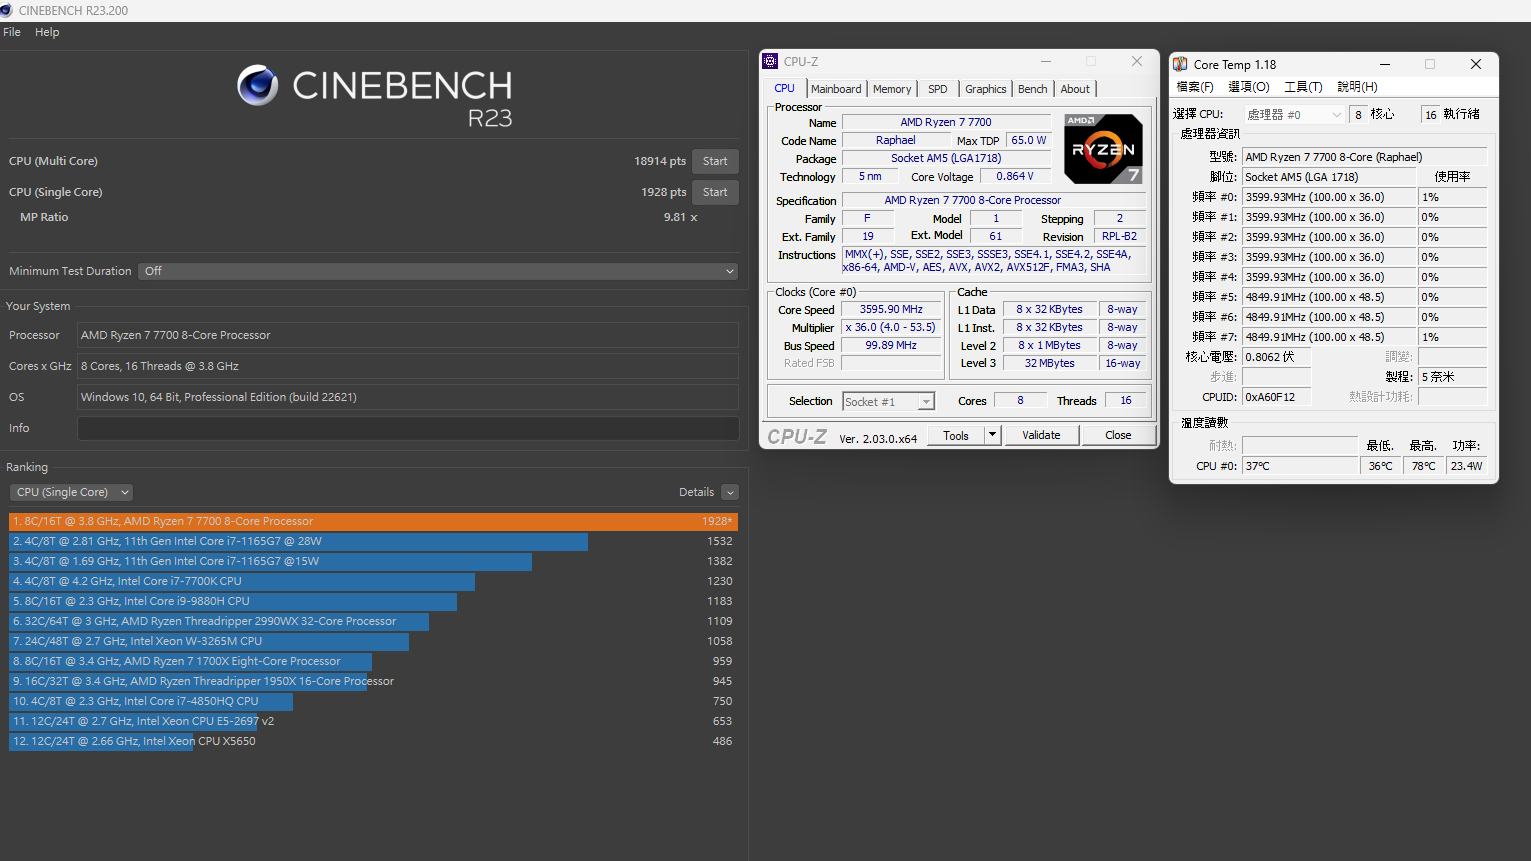
對照組
Ryzen 7 7700X 1T 1982pts、nT 20011pts
Cinebench R23比較表

[/B]
⇧單位: Performance Score (數字愈大愈好)
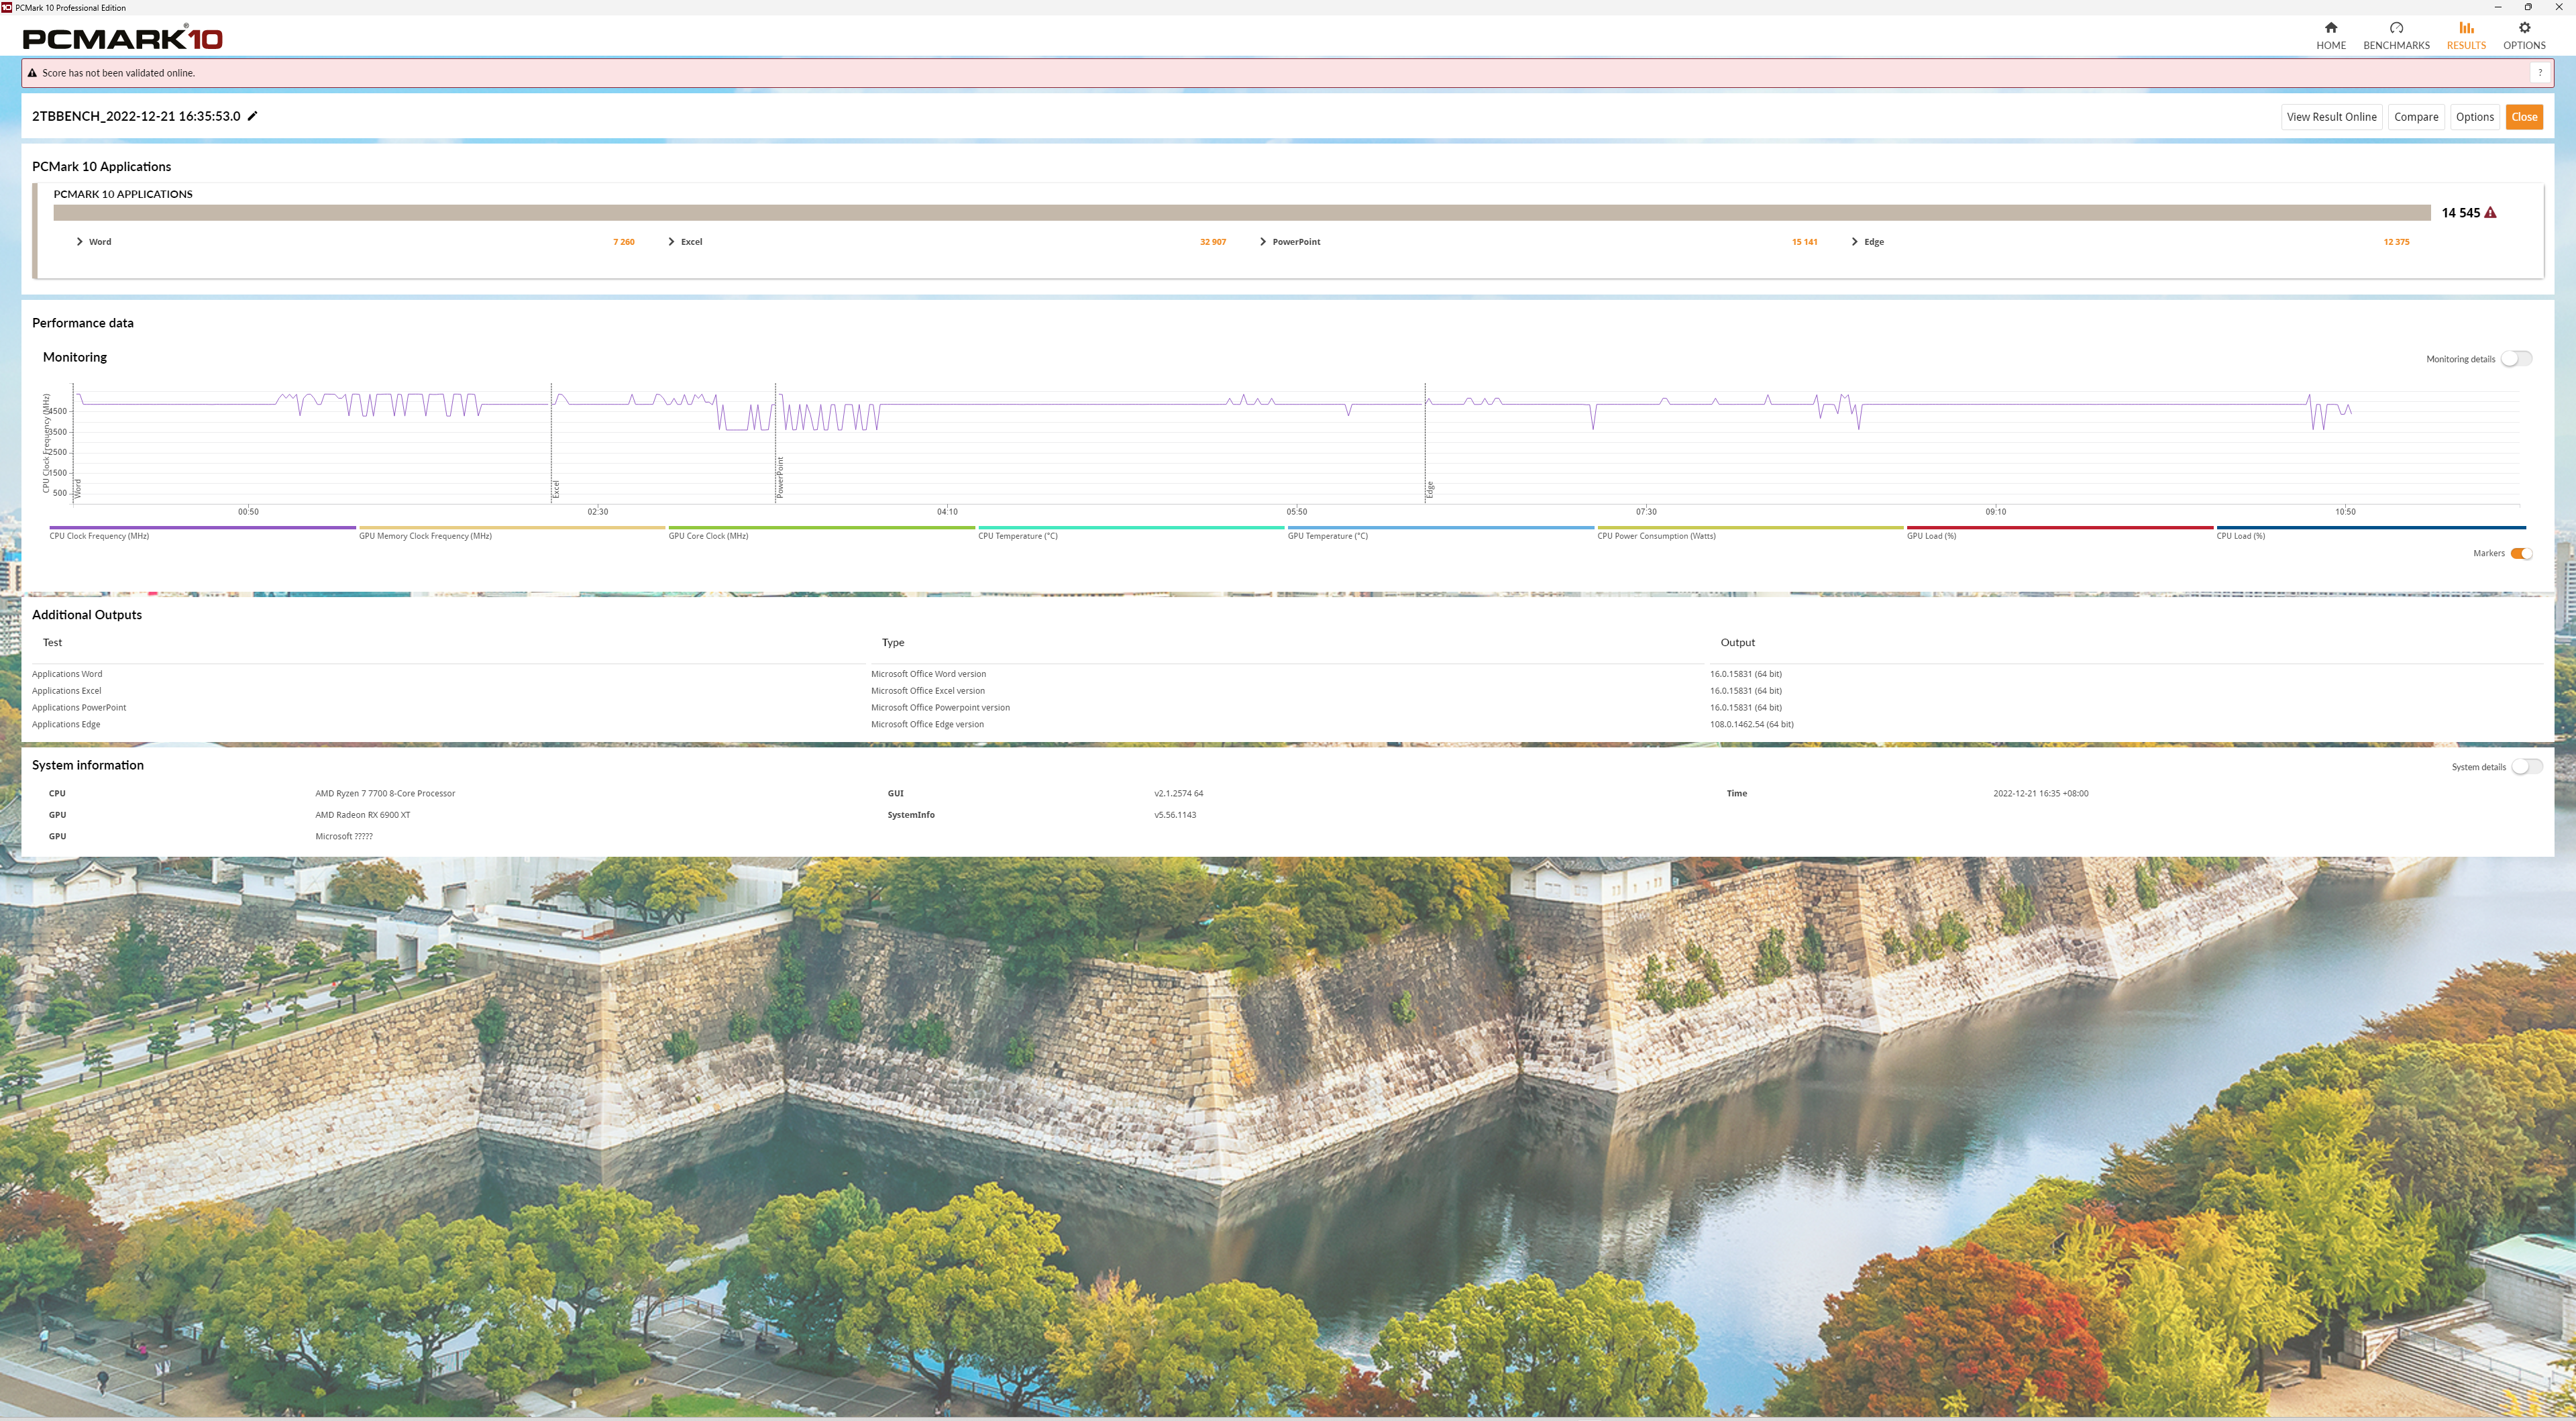
4.PCMark10 applications benchmark
PCMark10 applications benchmark在 Microsoft Word、Excel、PowerPoint和 Edge中運行的測試通過Mark來通過實用測試針對適用於現代工作場所的性能、真實性的 PC進行測試,您還可以通過 Windows 11 PC進行,其結果可與基於 x86的傳統設備的基準測試相媲美
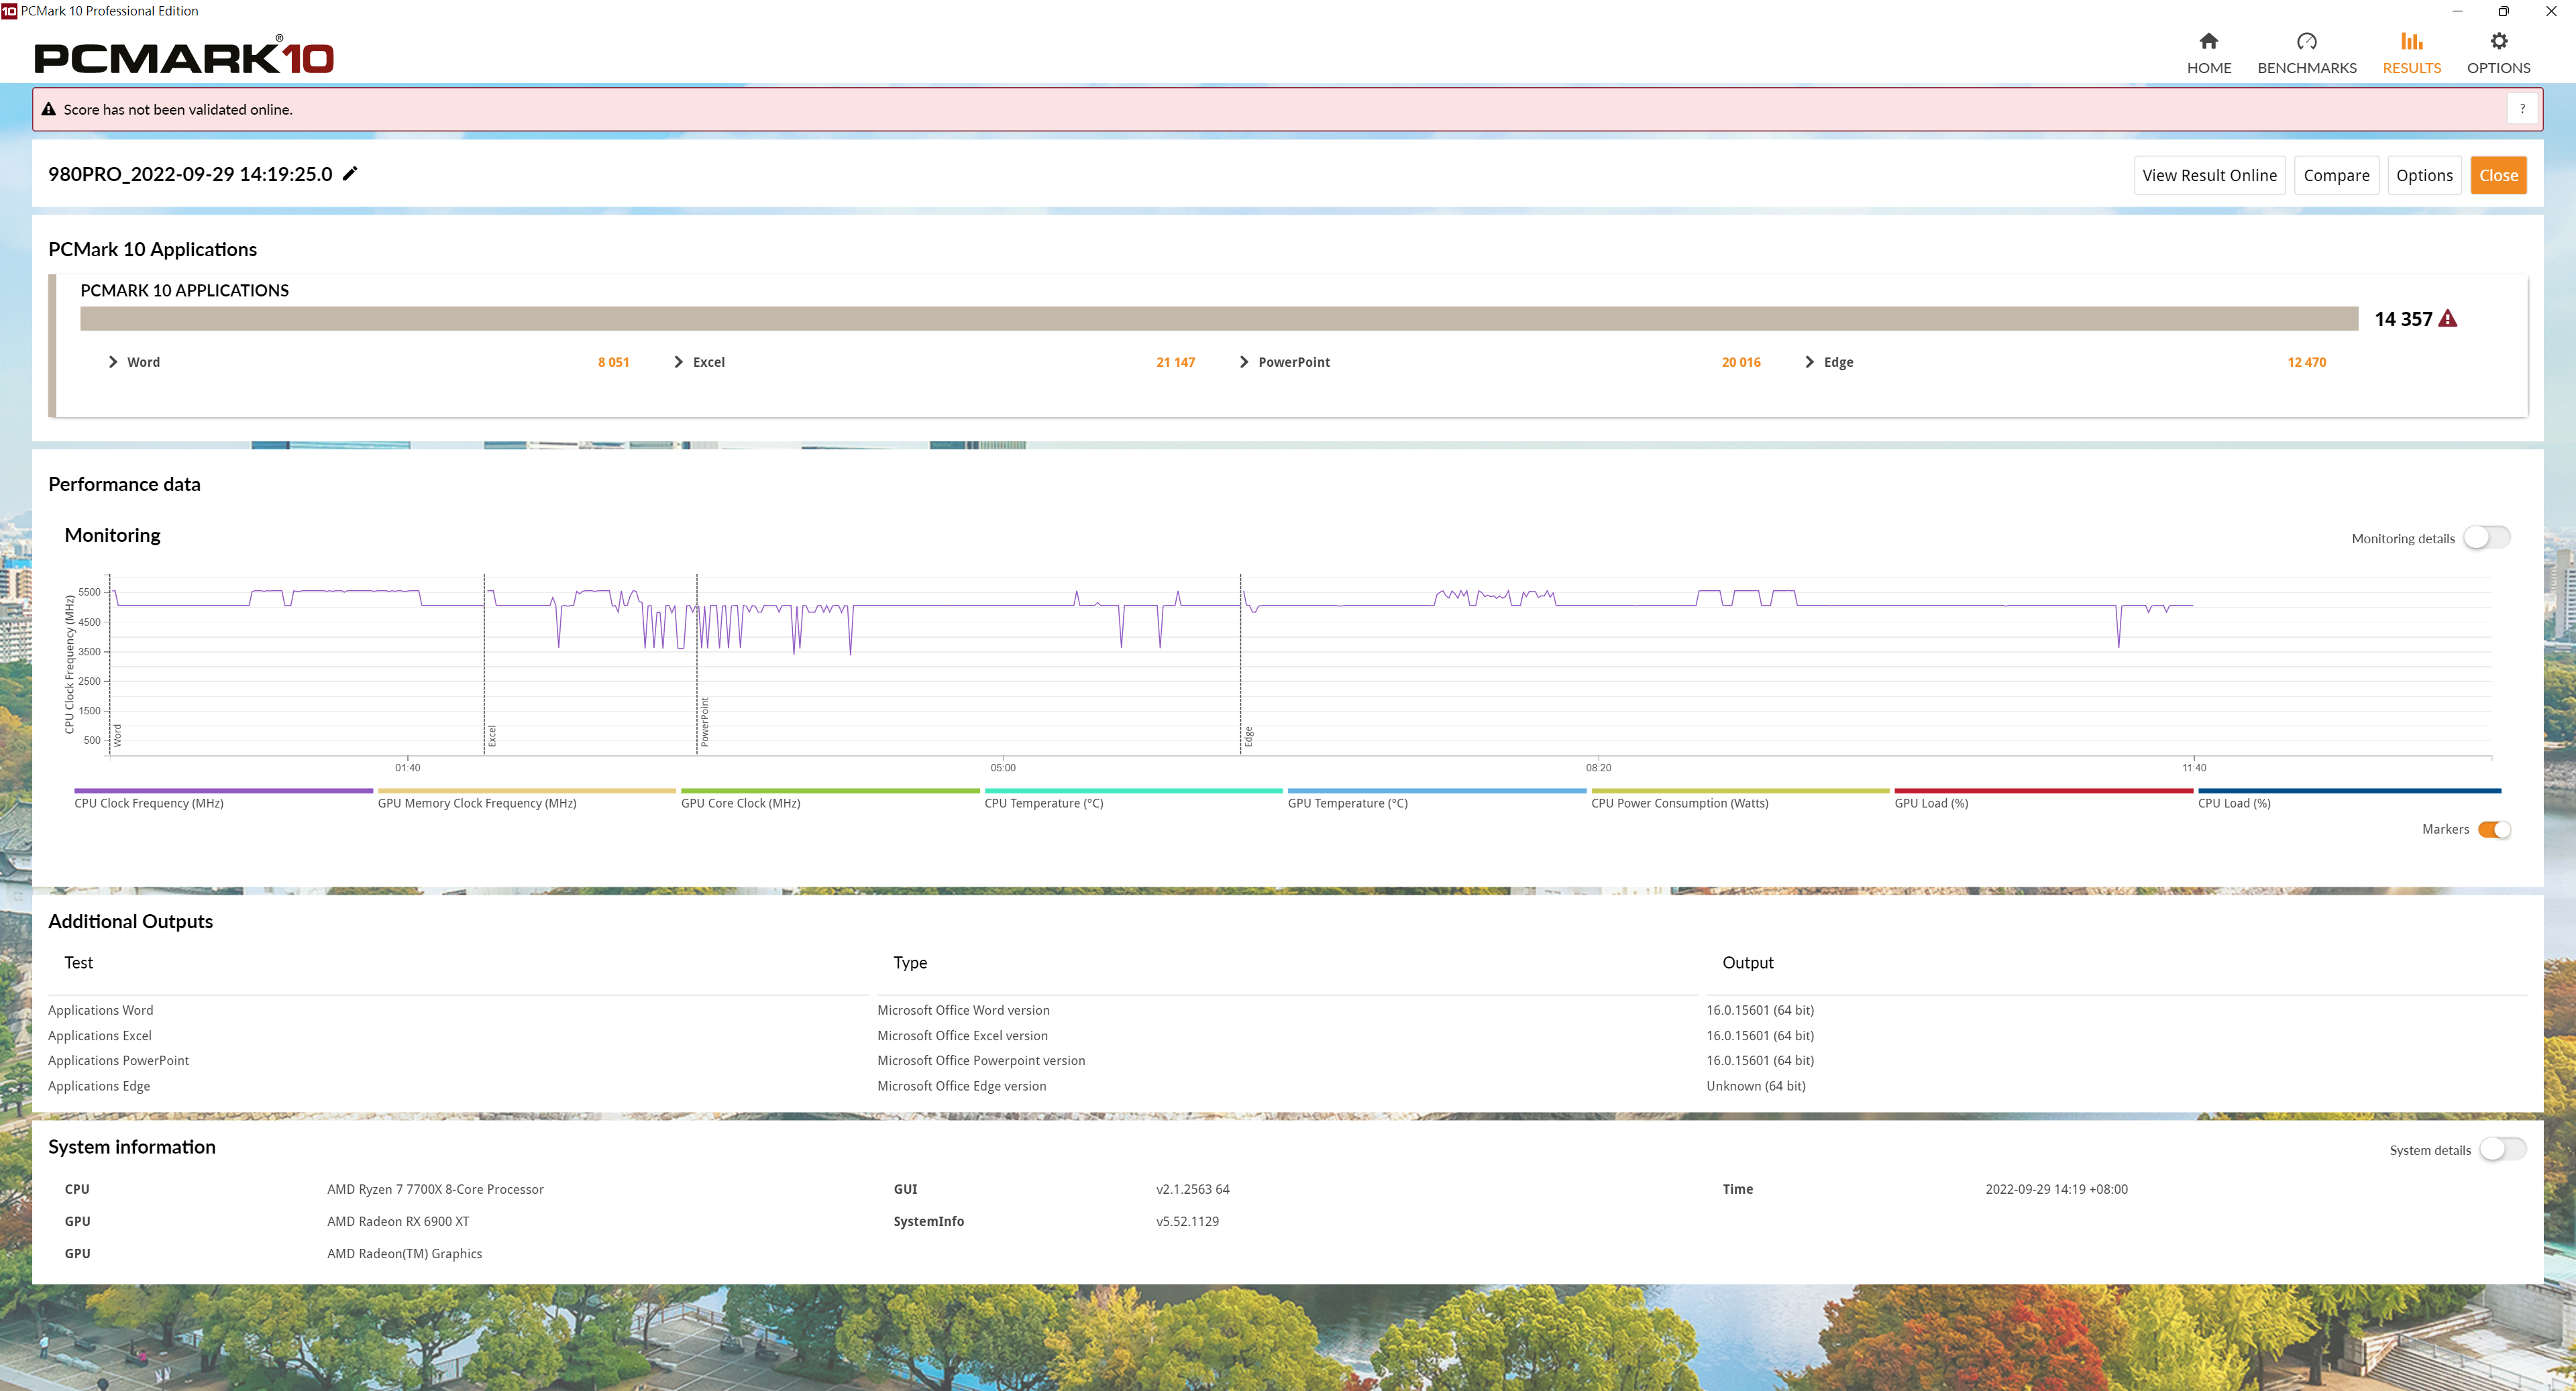
Ryzen 7 7700「Overall」 14545分
[/B]
對照組
Ryzen 7 7700X「Overall」 14357分
PCMark10 applications benchmark比較表

⇧單位: Performance Score (數字愈大愈好)
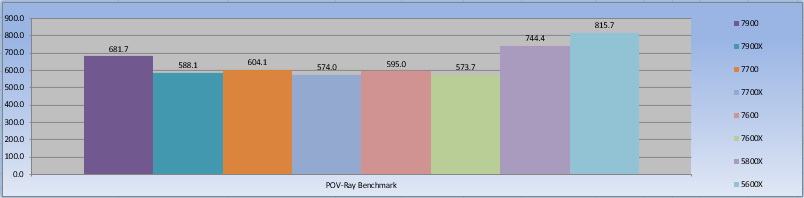
5.POV-Ray Benchmark
POV-Ray全名是 Persistence of Vision Raytracer,是一個使用光線跟蹤繪製三維圖像的開放原始碼自由軟體。運行 POV腳本語言。它是基於 DKBTrace來開發的,DKBTrace是由 David Kirk Buck和 Aaron A. Collins編寫在 Amiga上的。POV-Ray早期也受到了 Polyray raytracer作者 Alexander Enzmann的幫助。很多漂亮的圖片就是由 POV-Ray來製作的

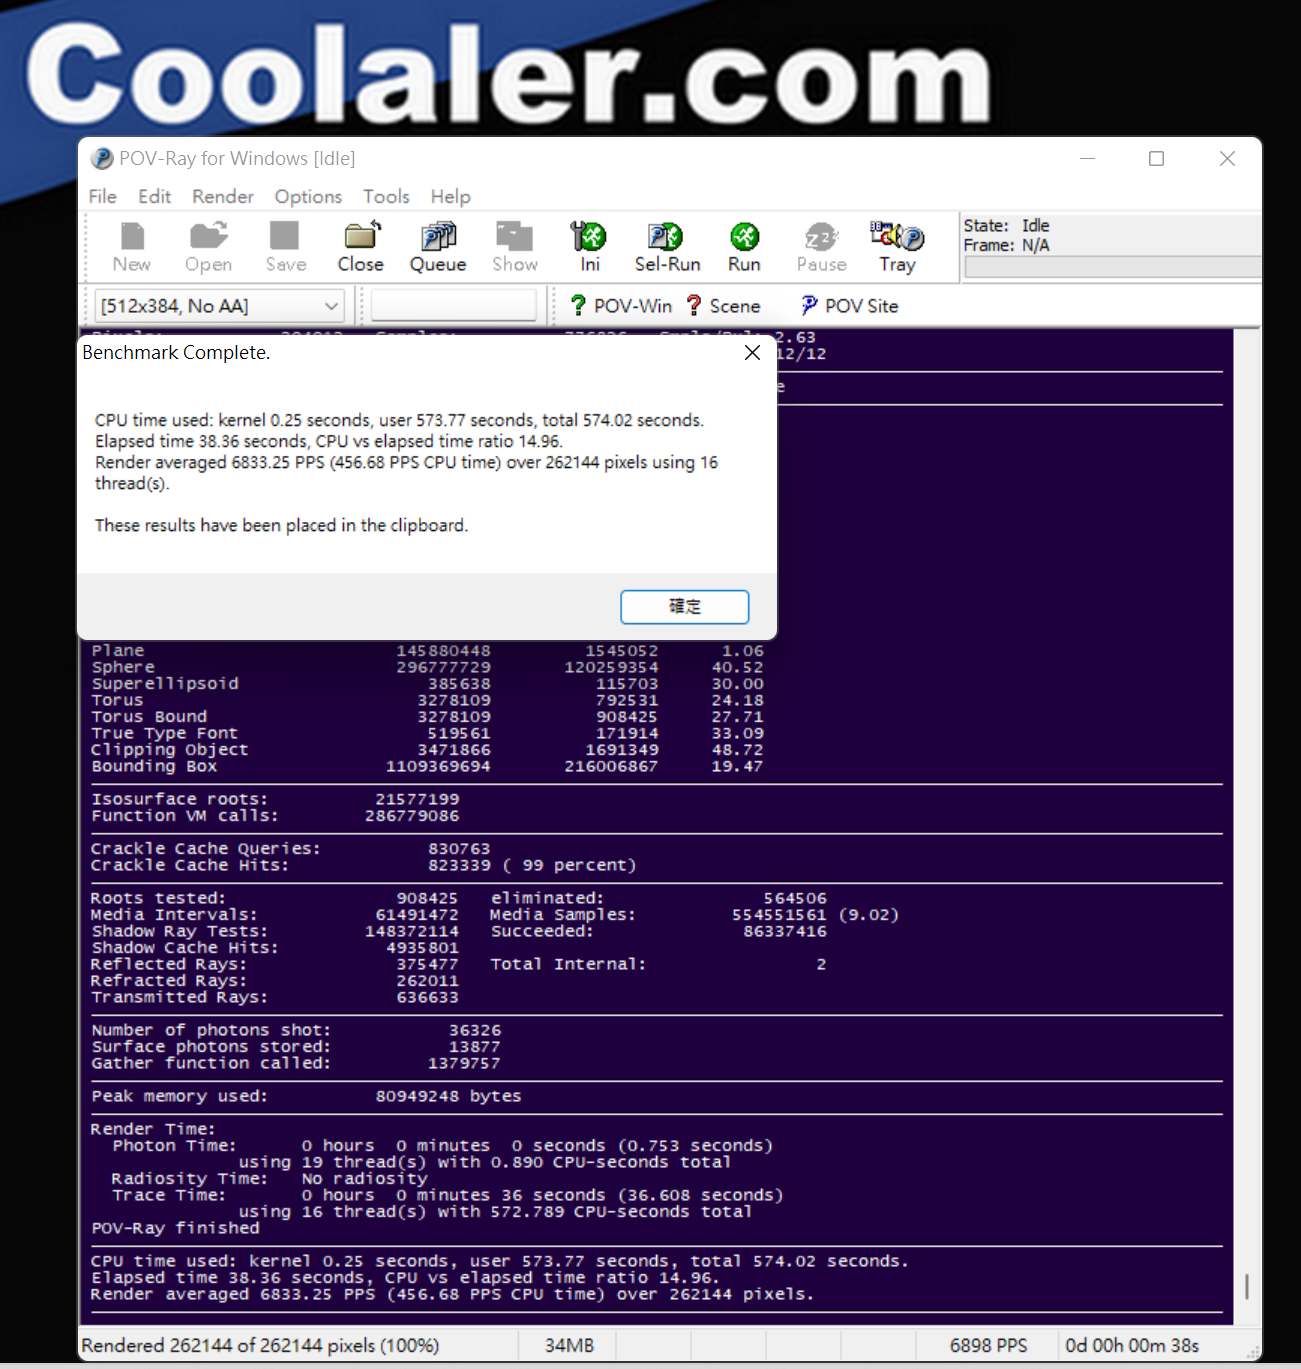
Ryzen 7 7700 POV-Ray Benchmark Results 604.06
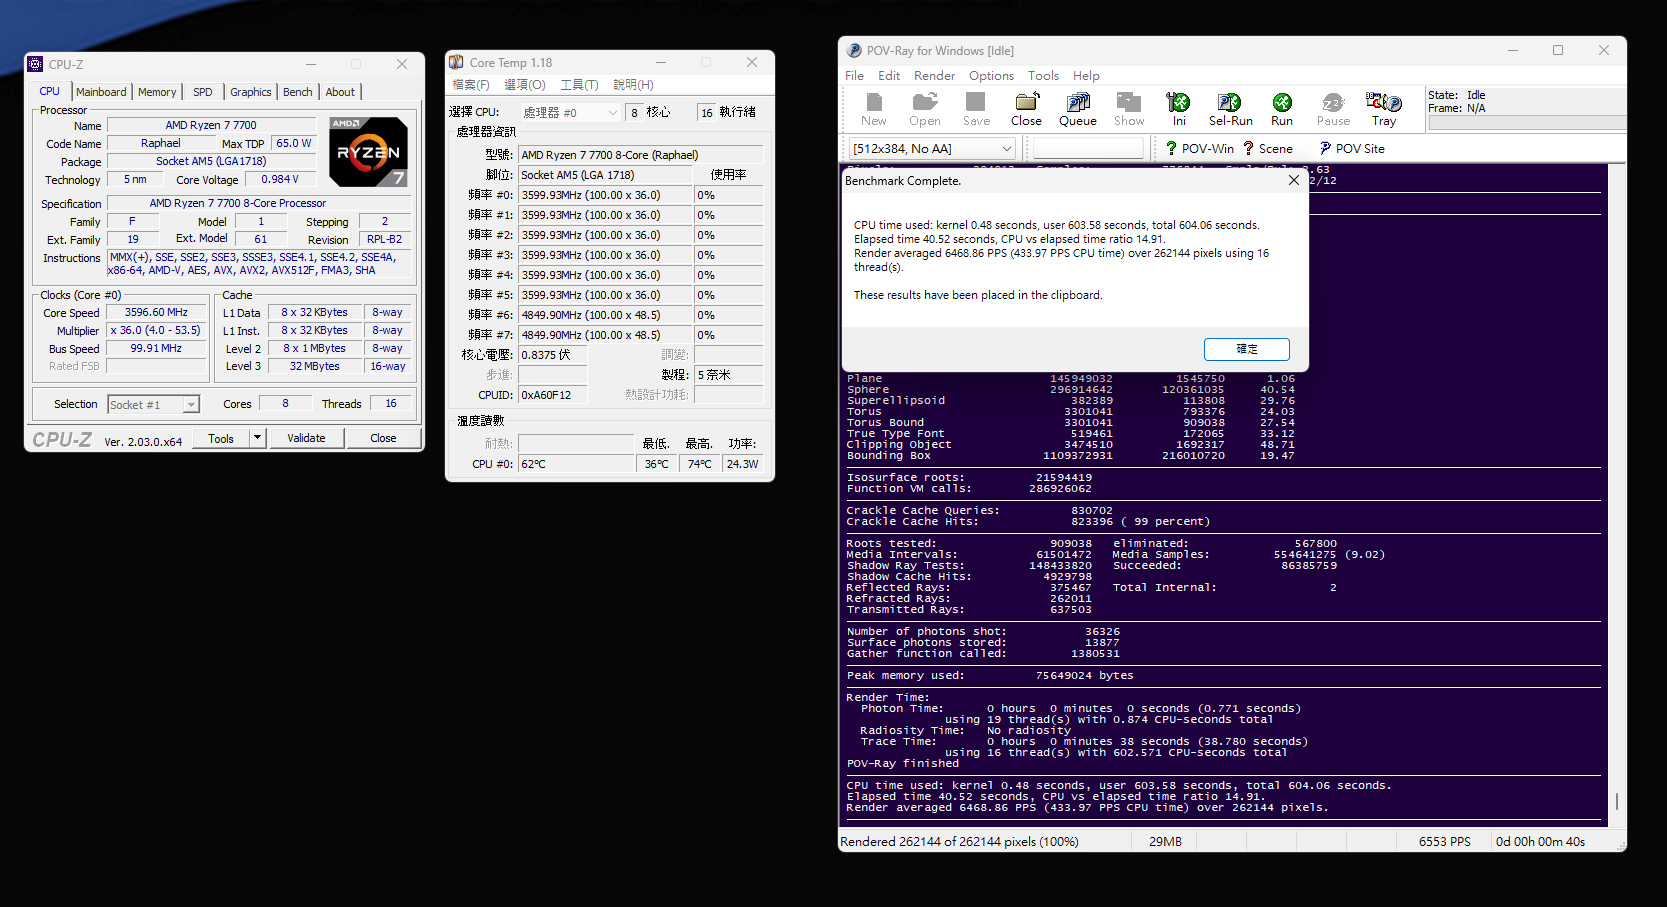
對照組
Ryzen 7 7700X POV-Ray Benchmark Results 574.02s
POV-Ray Benchmark比較表

⇧單位: Performance Score (數字愈大愈好)
6.3DMark CPU Profile
3DMark CPU Profile引入了一種新的 CPU基準測試方法。 3DMark CPU配置文件不是生成單個數字,而是顯示 CPU性能如何隨使用的內核和線程數量而變化。 3DMark CPU配置文件有六項測試,可幫助您對一系列場景的 CPU 性能進行基準測試和比較

3DMark CPU Profile Results
Ryzen 7 7700 Max threads 8613、16 threads 8601、8 threads 7301、4 threads 3946、2 threads 2043、1 threads 1053
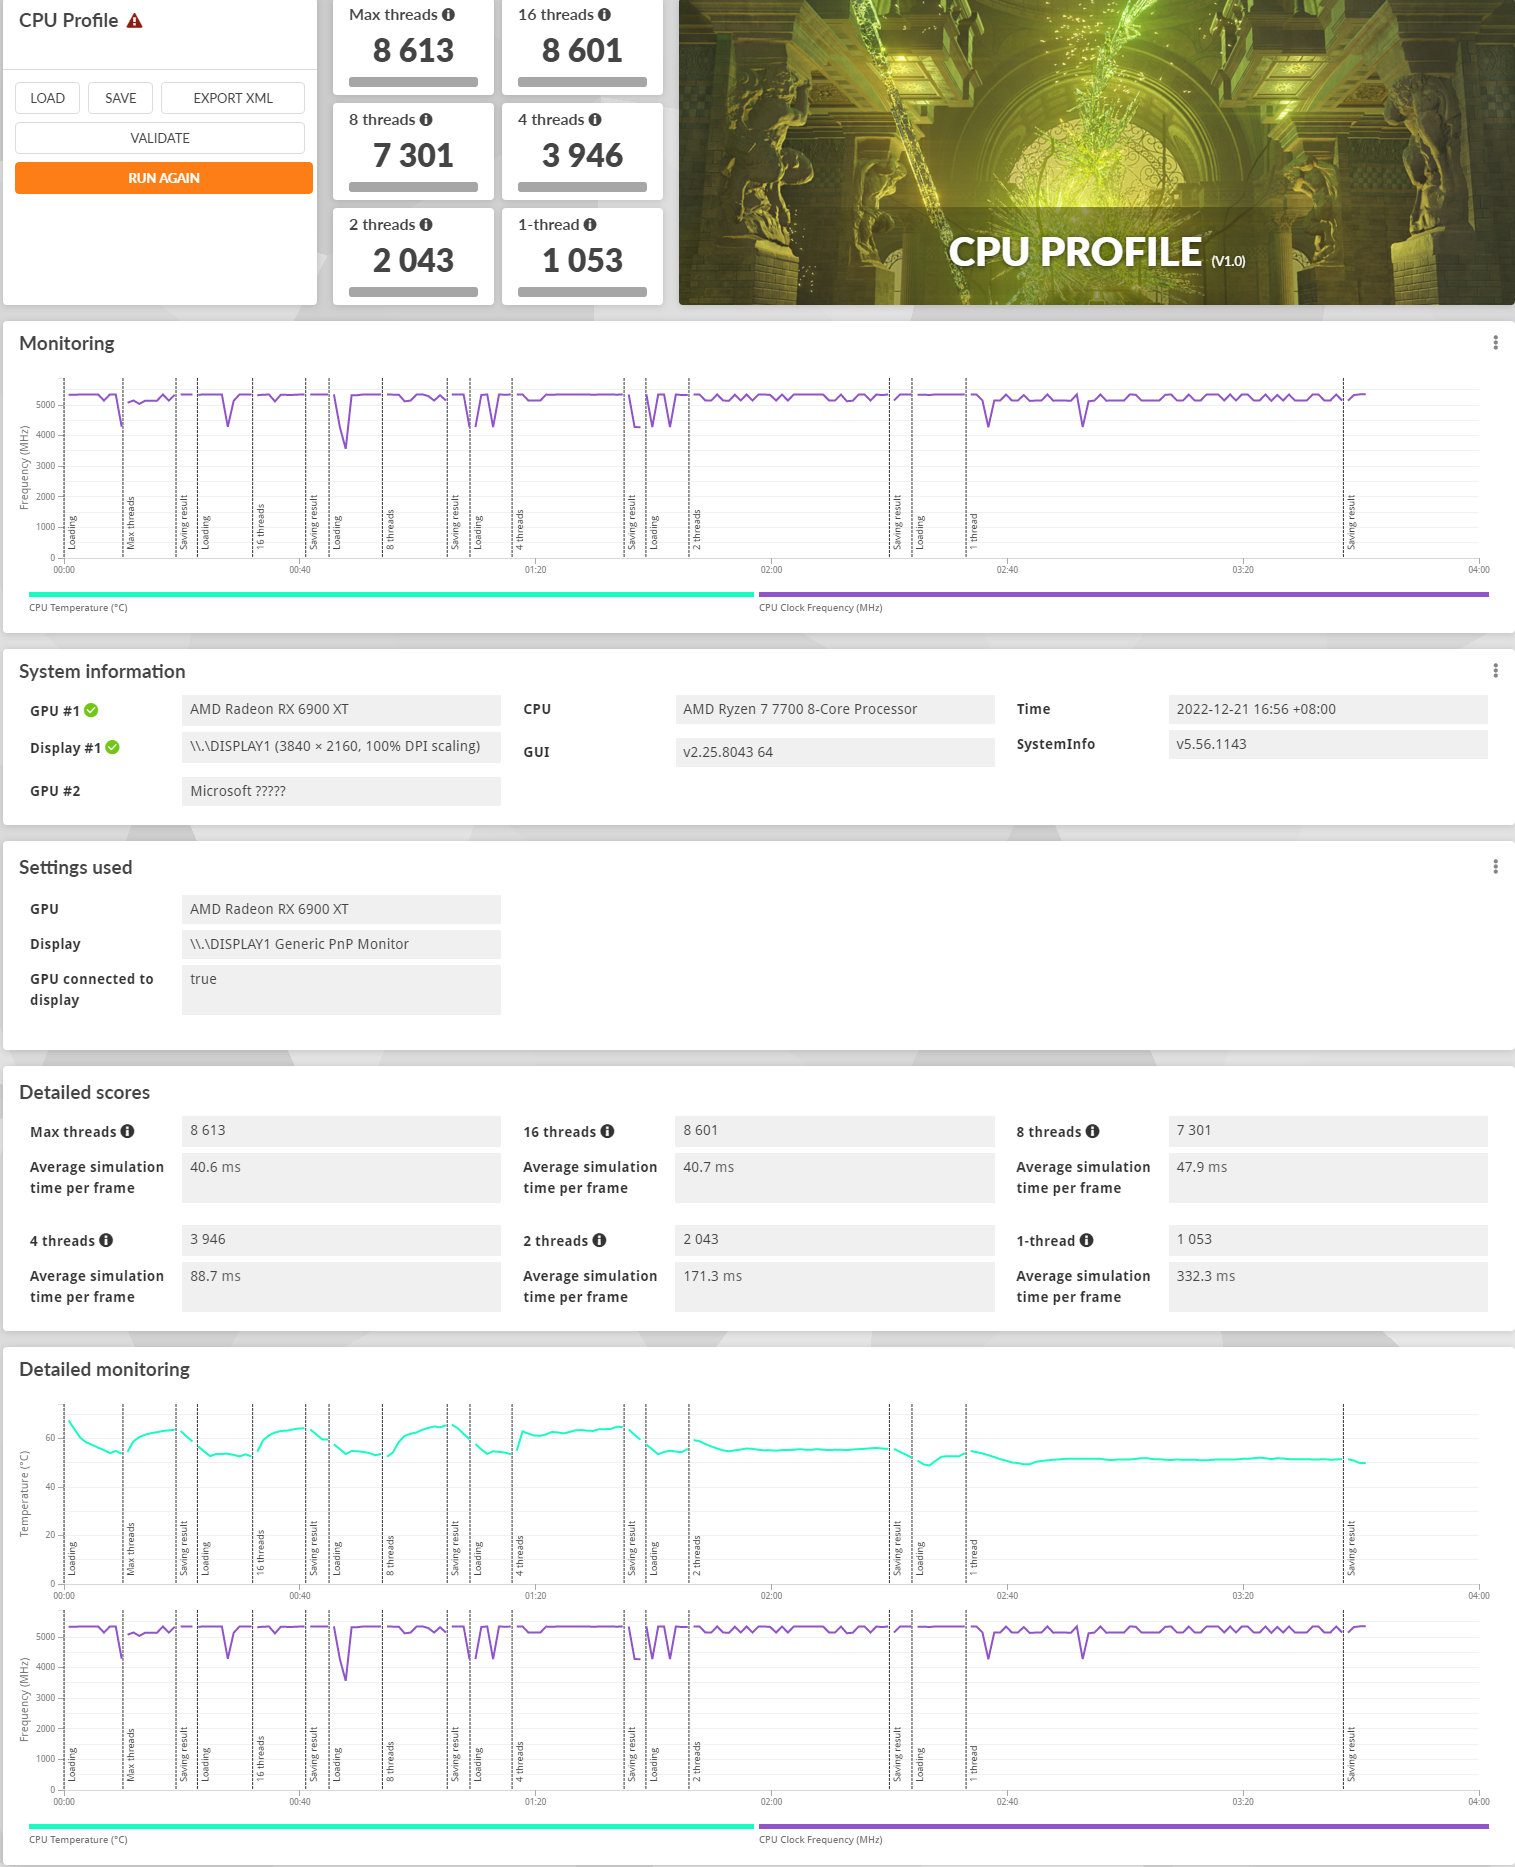
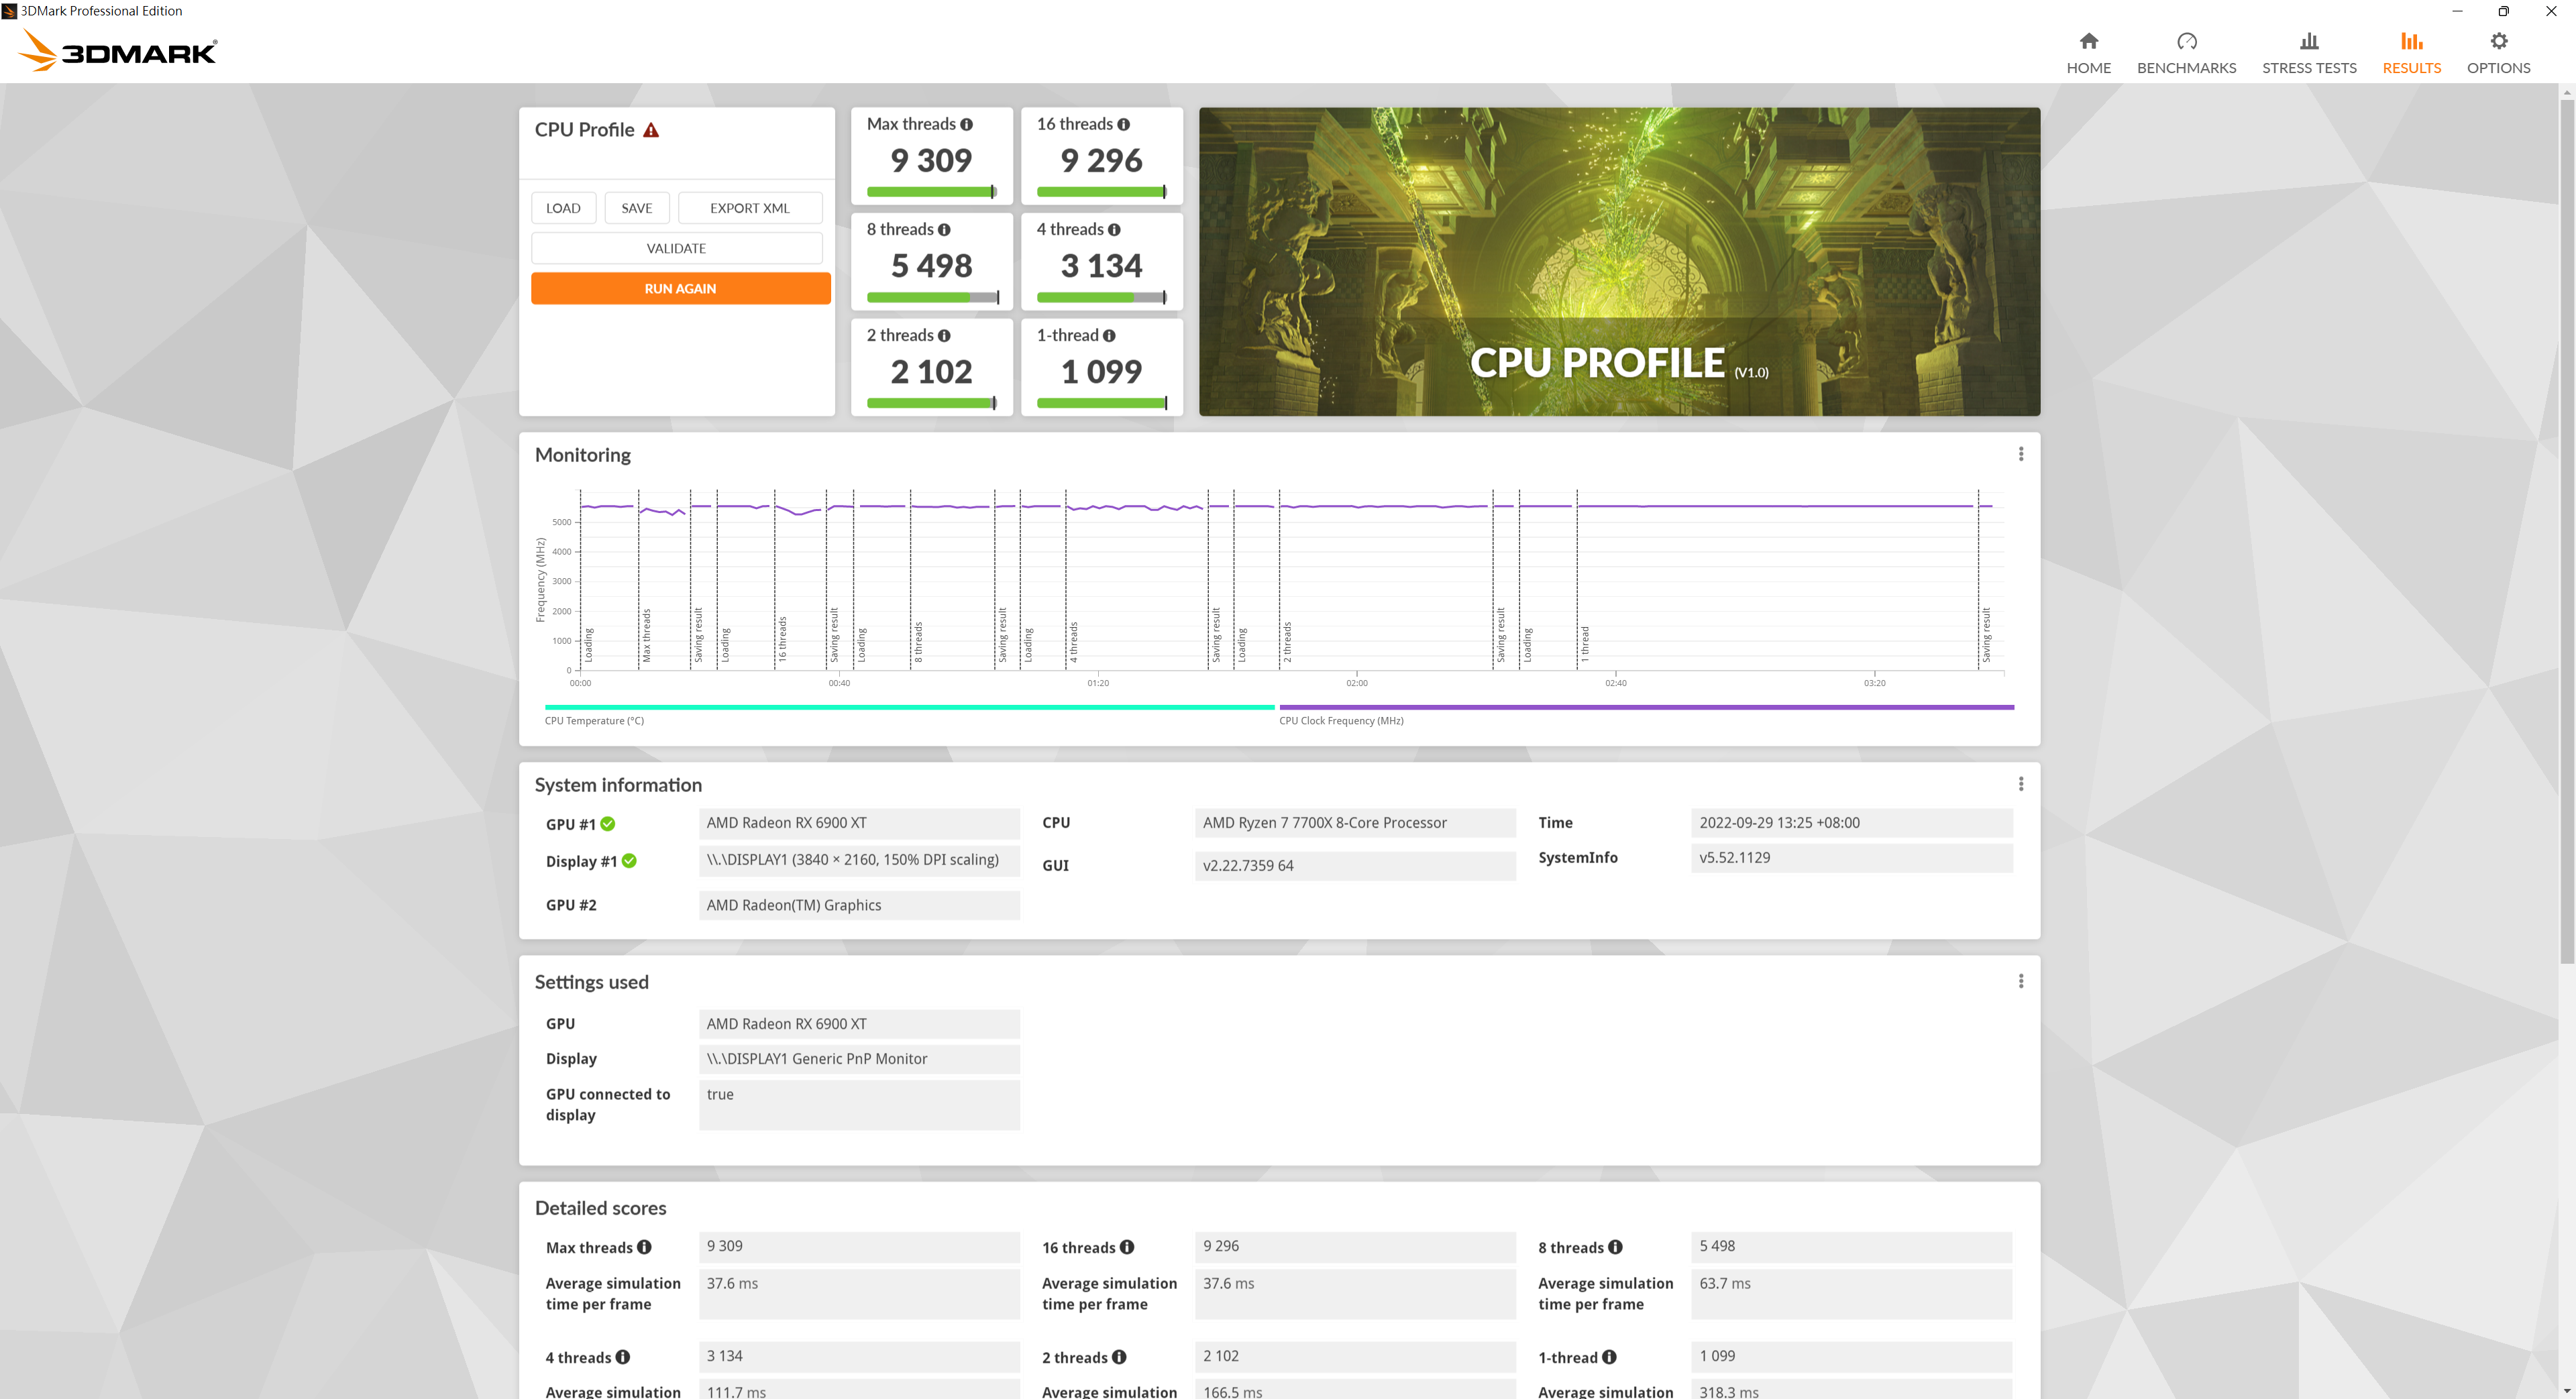
對照組
Ryzen 7 7700X Max threads 9309、16 threads 9296、8 threads 5498、4 threads 3134、2 threads 2102、1 threads 1099
3DMark CPU Profile比較表

[/B]
⇧單位: Performance Score (數字愈大愈好)
7.WebXPRT3
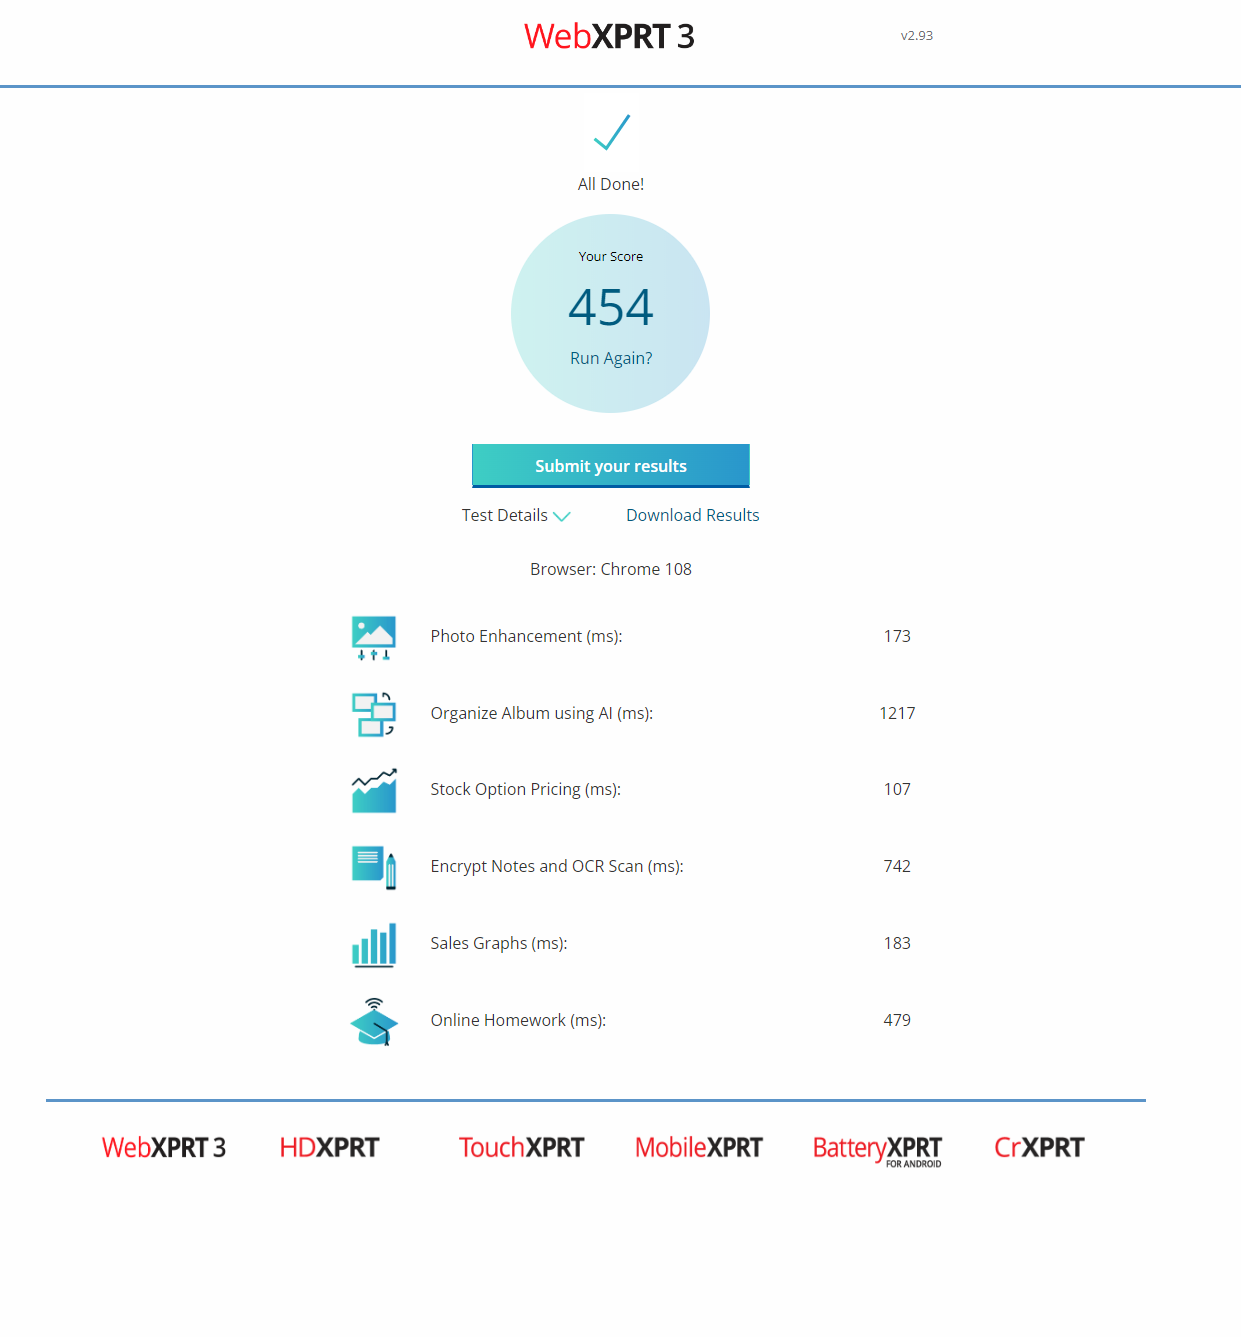
WebXPRT 3是一個瀏覽器基準測試,可以比較幾乎所有支持 Web的設備的性能。它包含六個基於 HTML5和 JavaScript的場景,用於反映您每天執行的任務:照片增強、使用 AI 組織相冊、股票期權定價、加密筆記和 OCR掃描、銷售圖表和在線作業。使用 WebXPRT可以準確了解不同設備處理實際任務的情況,WebXPRT 是 Web基準測試的黃金標準,可以免費使用,並且可以直接從您的瀏覽器運行。立即嘗試或查看來自各種設備的發布結果

WebXPRT3 Results
Ryzen 7 7700 WebXPRT3 Results 454
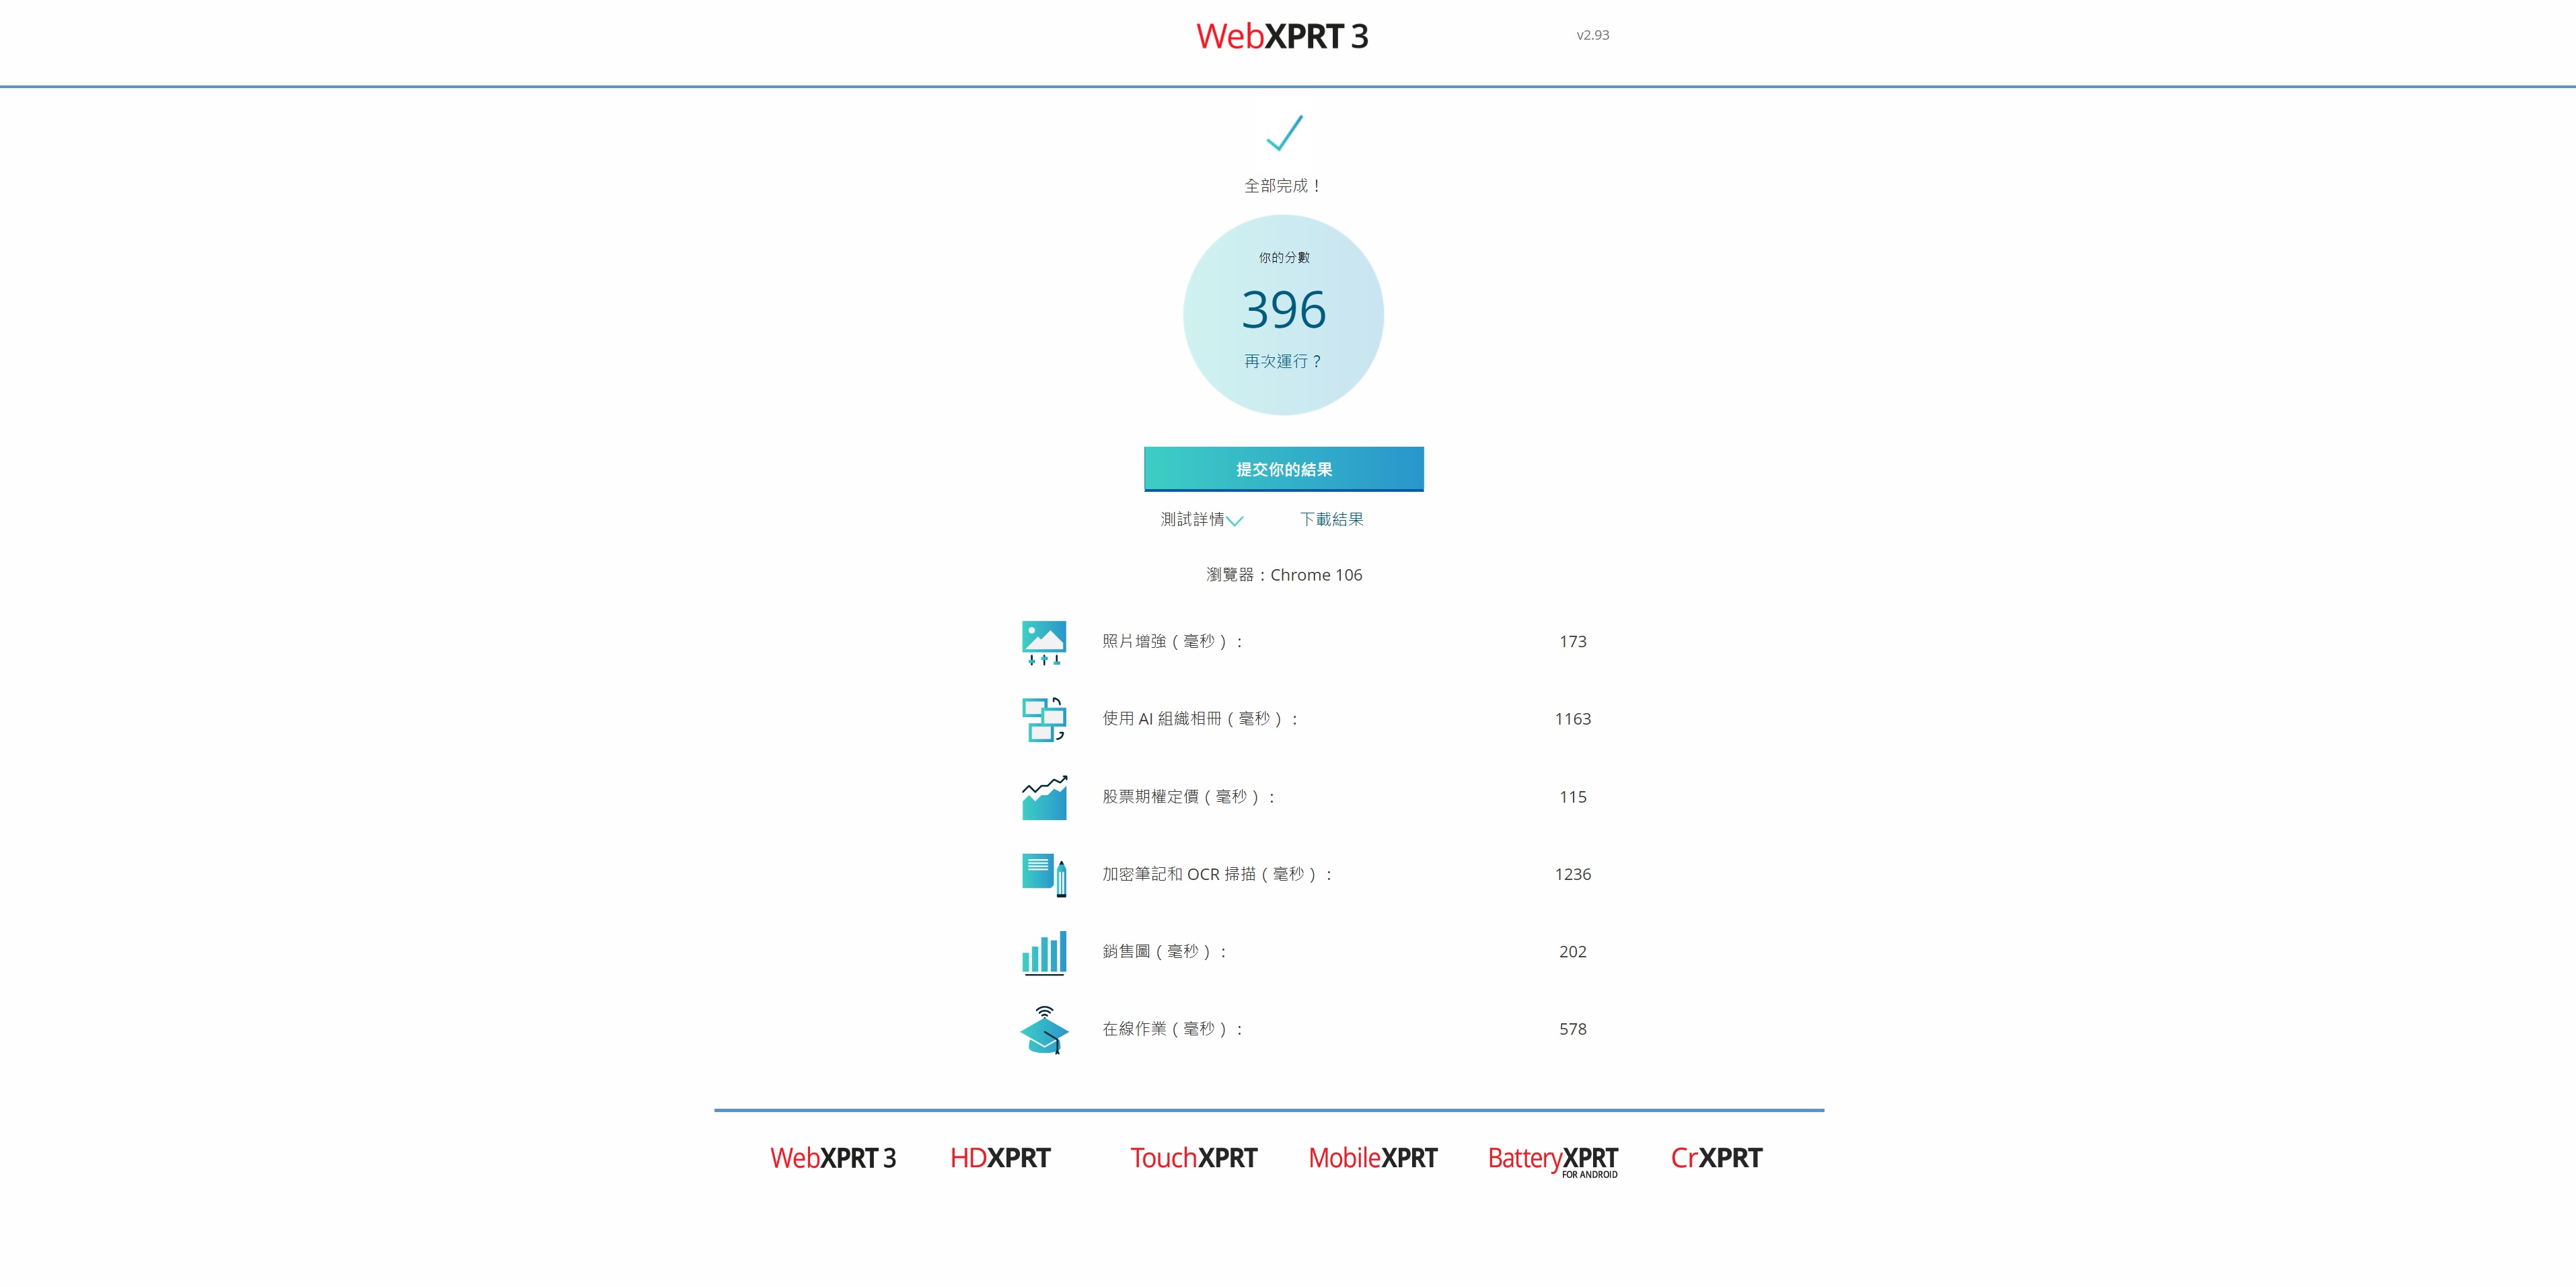
對照組
Ryzen 7 7700X WebXPRT3 Results 396
WebXPRT3 Benchmark比較表

[/B]
⇧單位: Performance Score (數字愈大愈好)
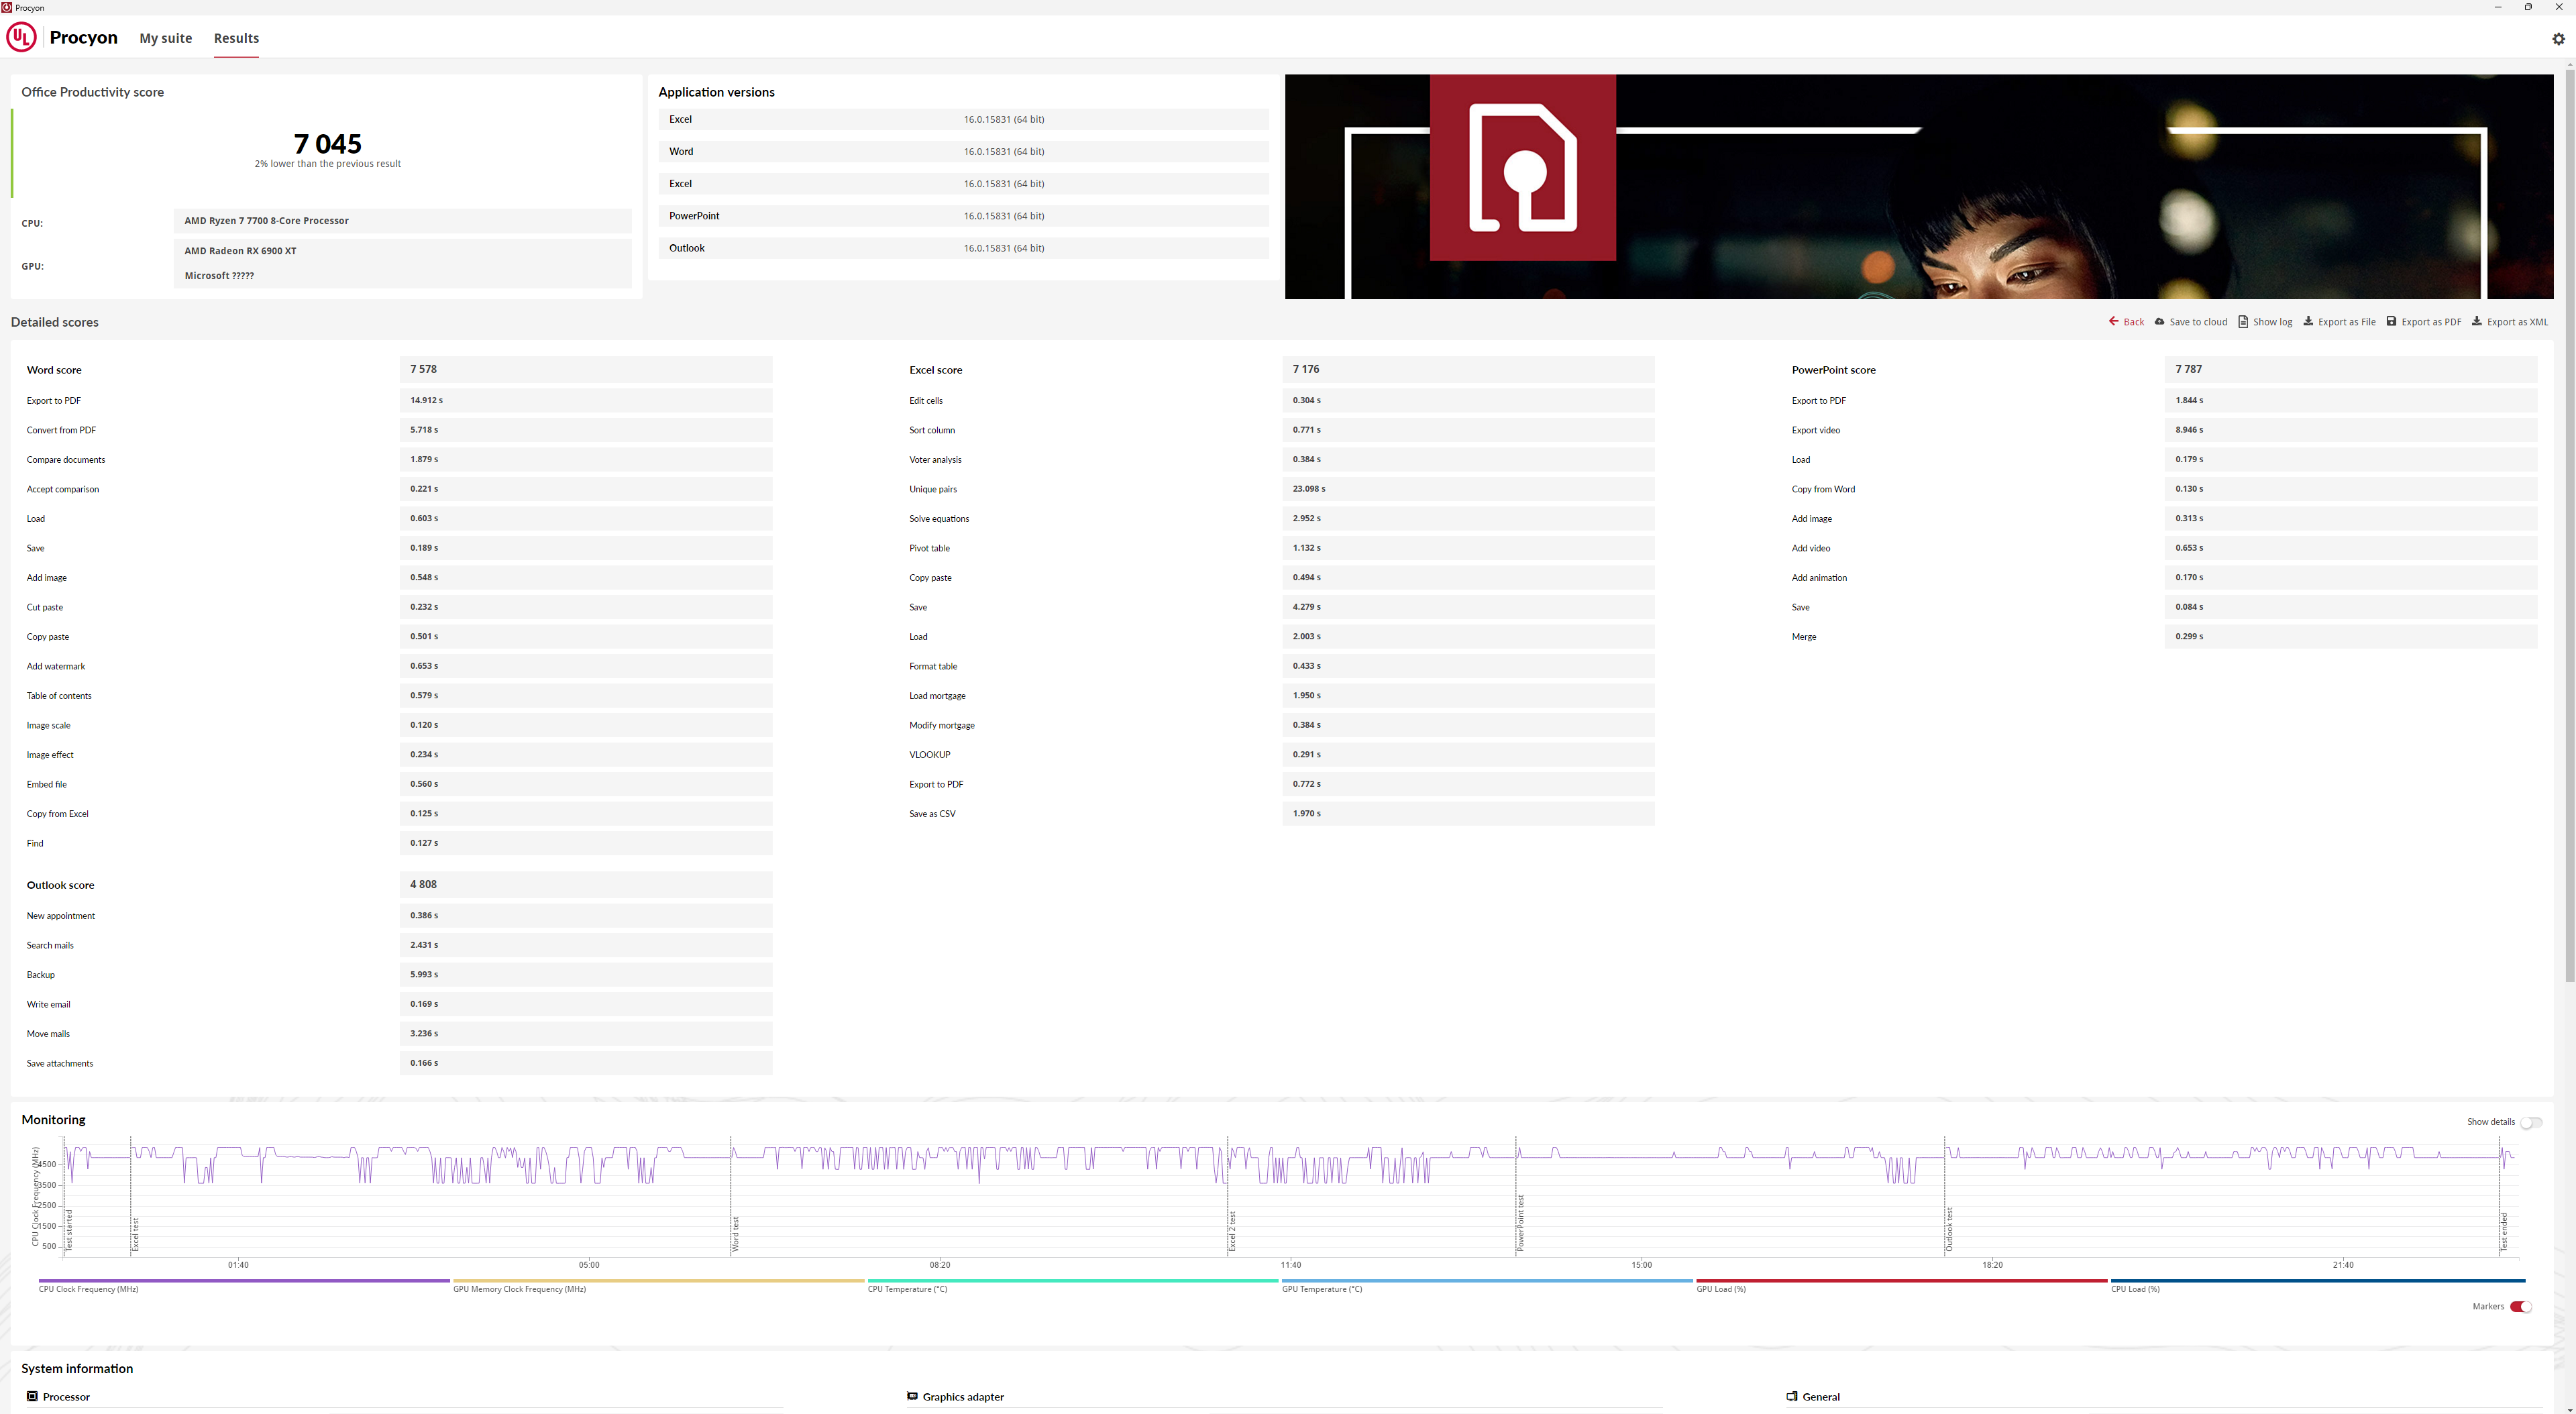
8.UL Procyon Office Productivity Benchmark
UL Procyon Office Productivity Benchmark使用 Microsoft Office應用程式來衡量辦公室生產力工作的 PC性能,基準工作負載具有使用 Microsoft Word、Excel、PowerPoint和 Outlook的相關現實任務,該基準測試將測試性能與辦公室工作人員每天使用的相同應用程序的相關性與標準化測試的便利性相結合,每次都能產生一致、可重複的結果,更重要的是,Office Productivity Benchmark也很容易從 UL Procyon應用程式或命令行安裝和運行,無需提升權限或複雜的配置

Ryzen 7 7700 UL Procyon Office Productivity Benchmark Results 7045
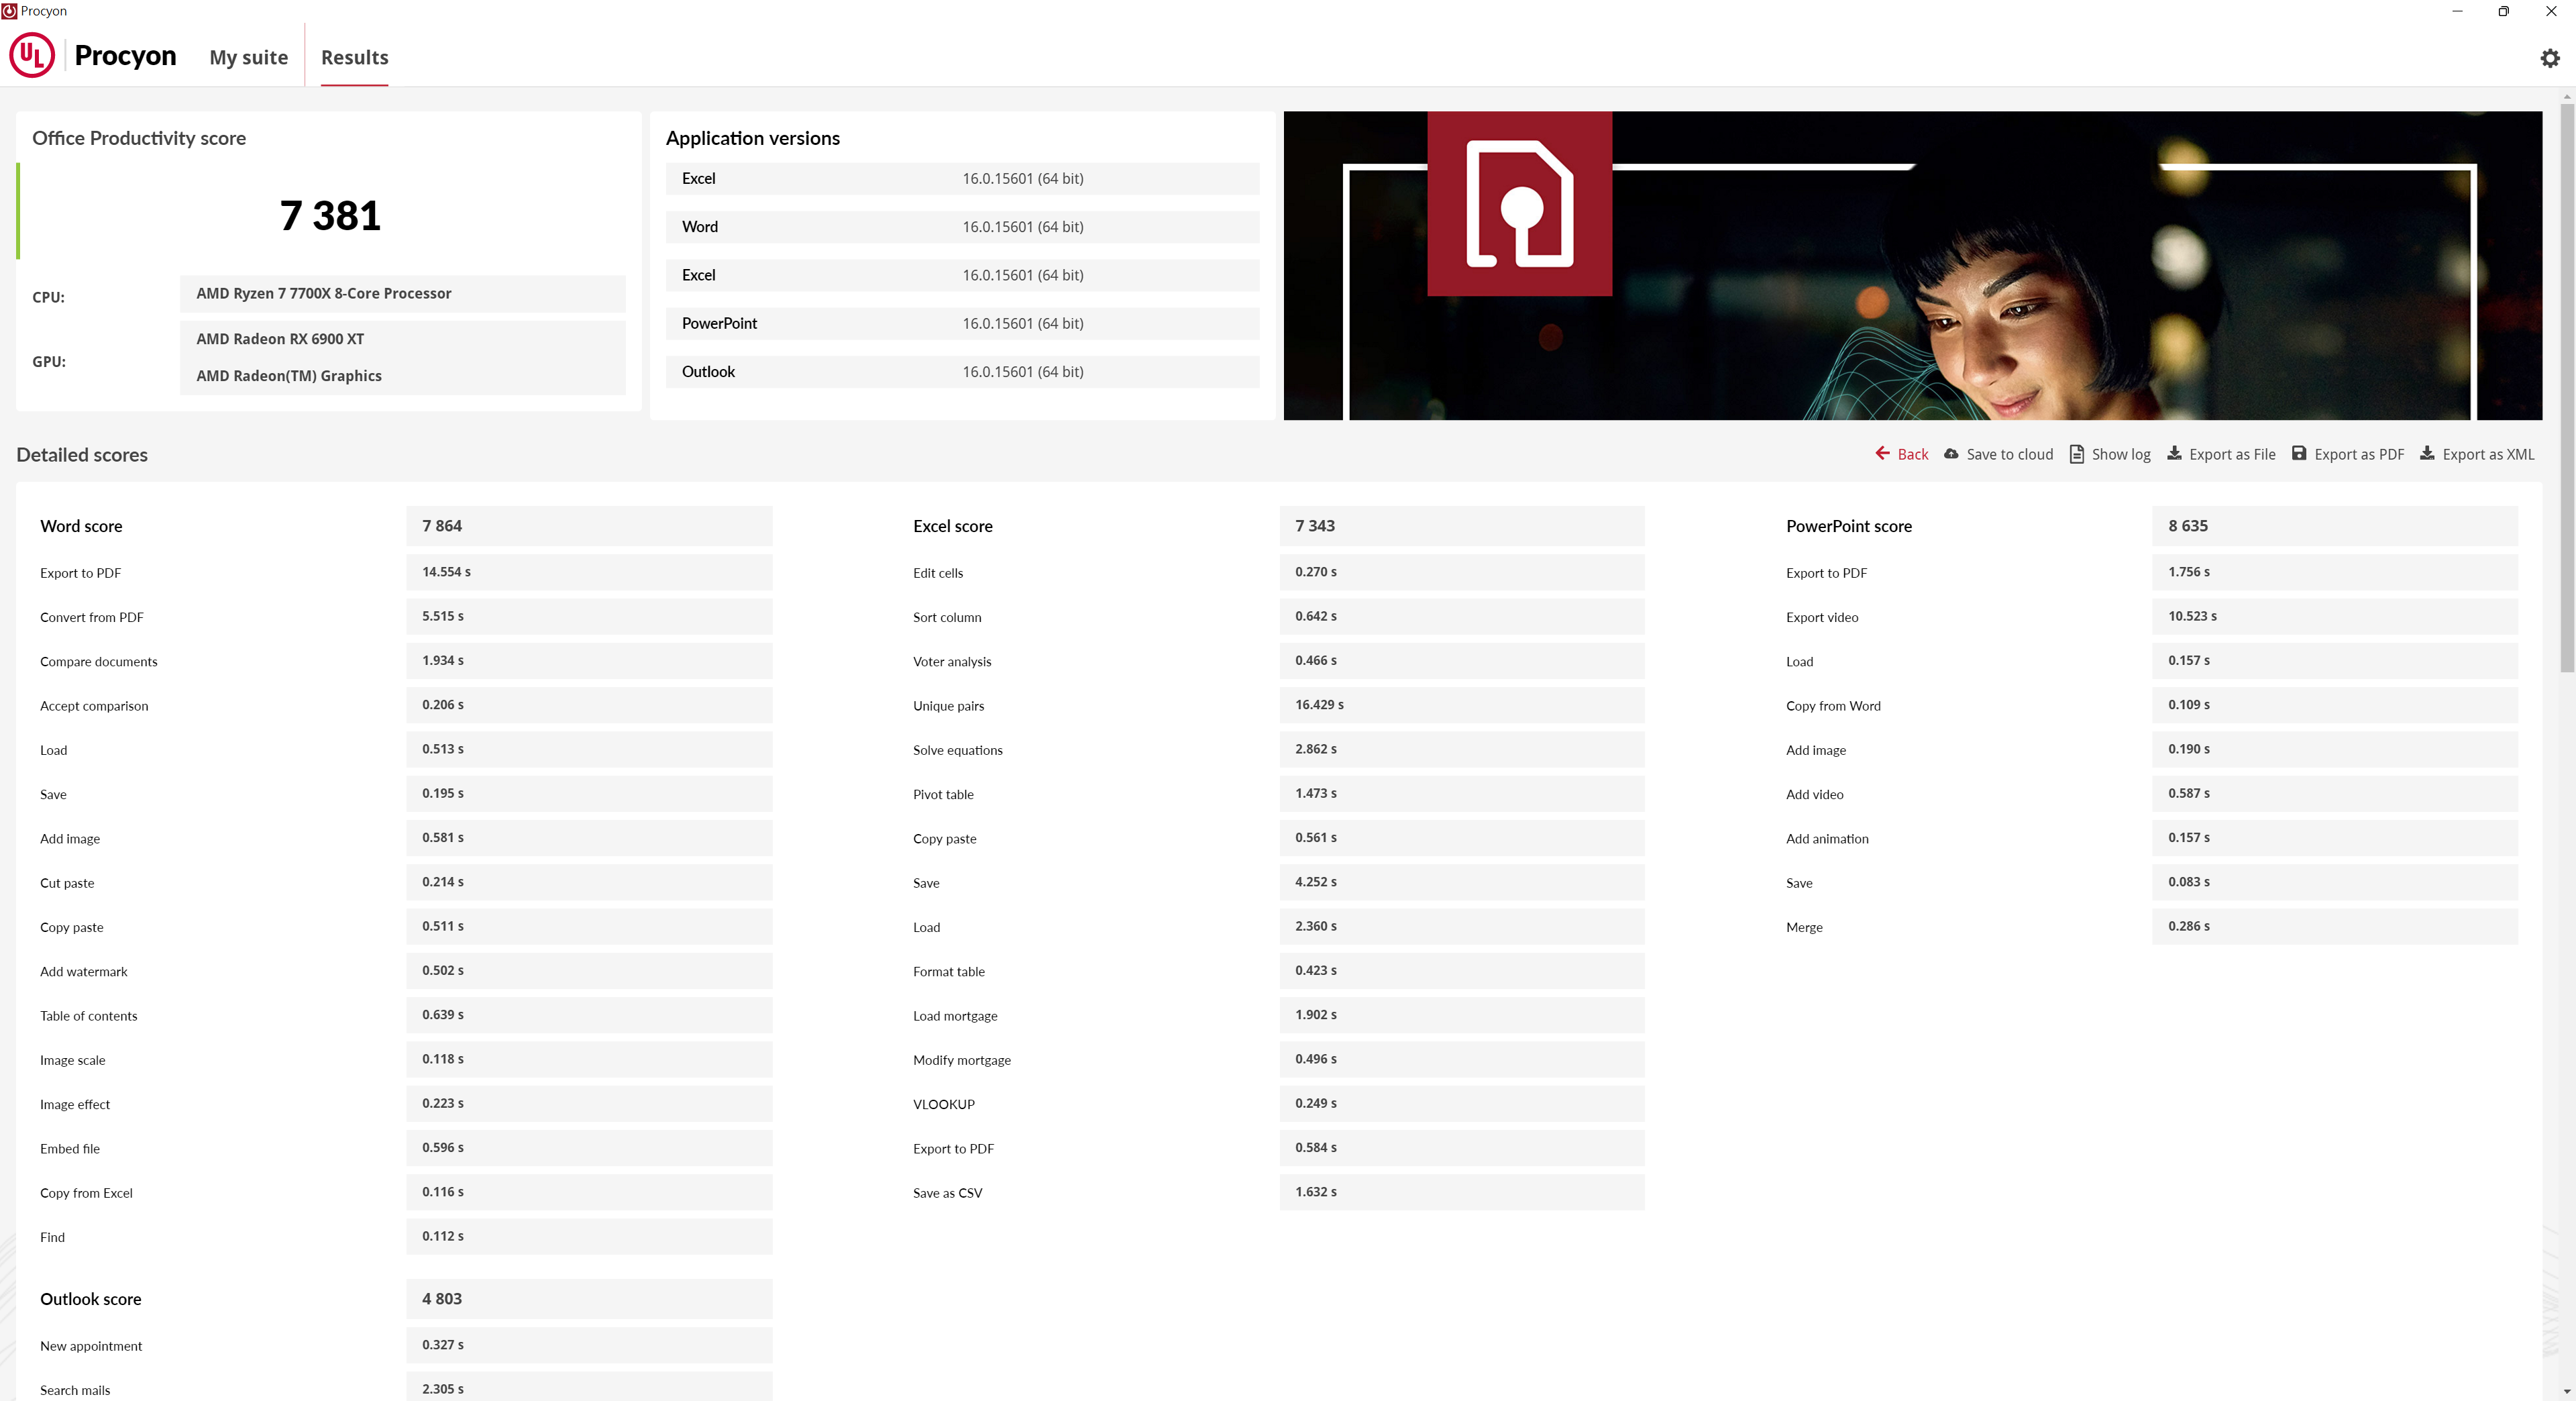
對照組
Ryzen 7 7700X UL Procyon Office Productivity Benchmark Results 7381
UL Procyon Office Productivity Benchmark比較表

[/B]
⇧單位: Performance Score (數字愈大愈好)
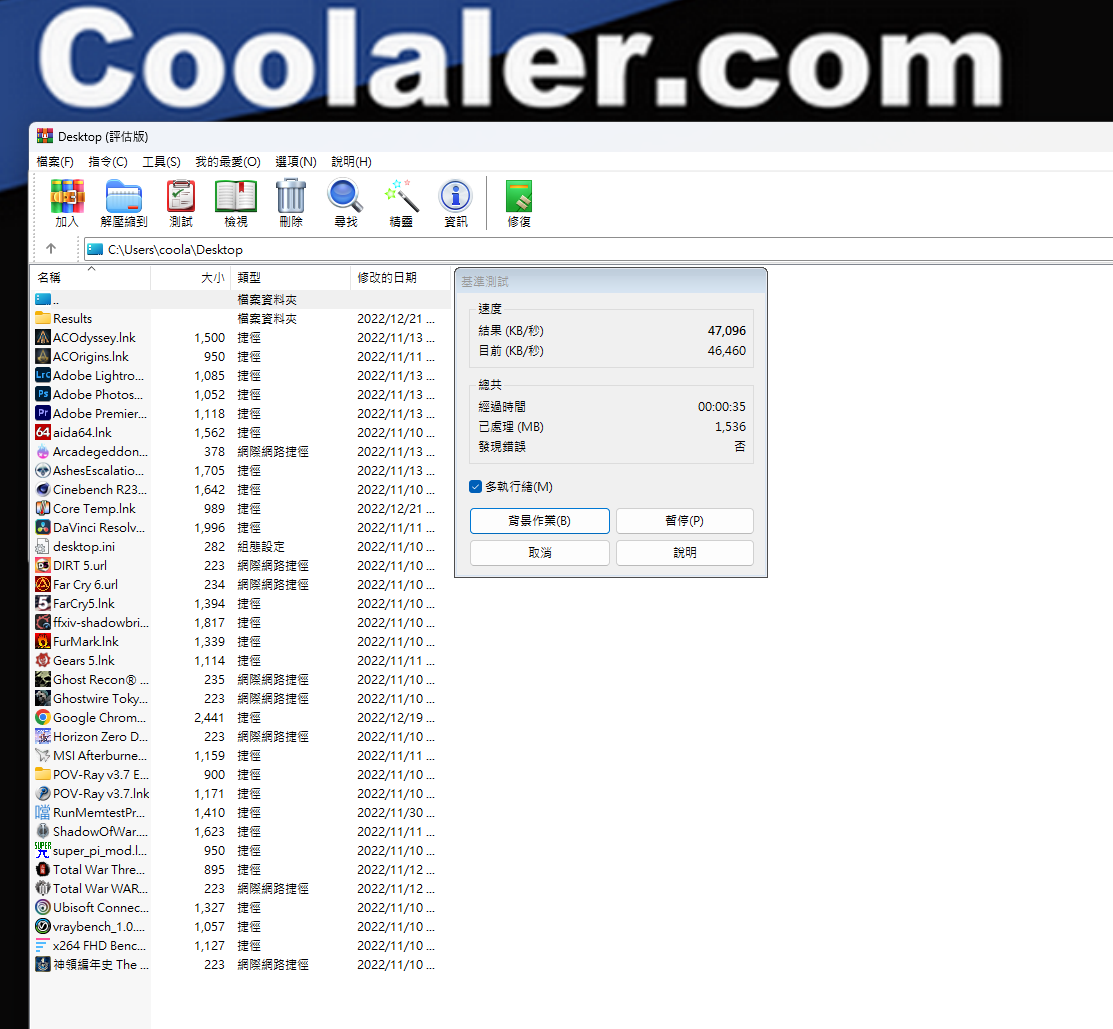
9.WinRAR Benchmark
WinRAR為常用壓縮,支援多線程軟體,內建測試程式,其演算法由作者尤金·羅謝爾研發,享有原創專利
WinRAR Benchmark Results
Ryzen 7 7700 WinRAR 47,096KB/S
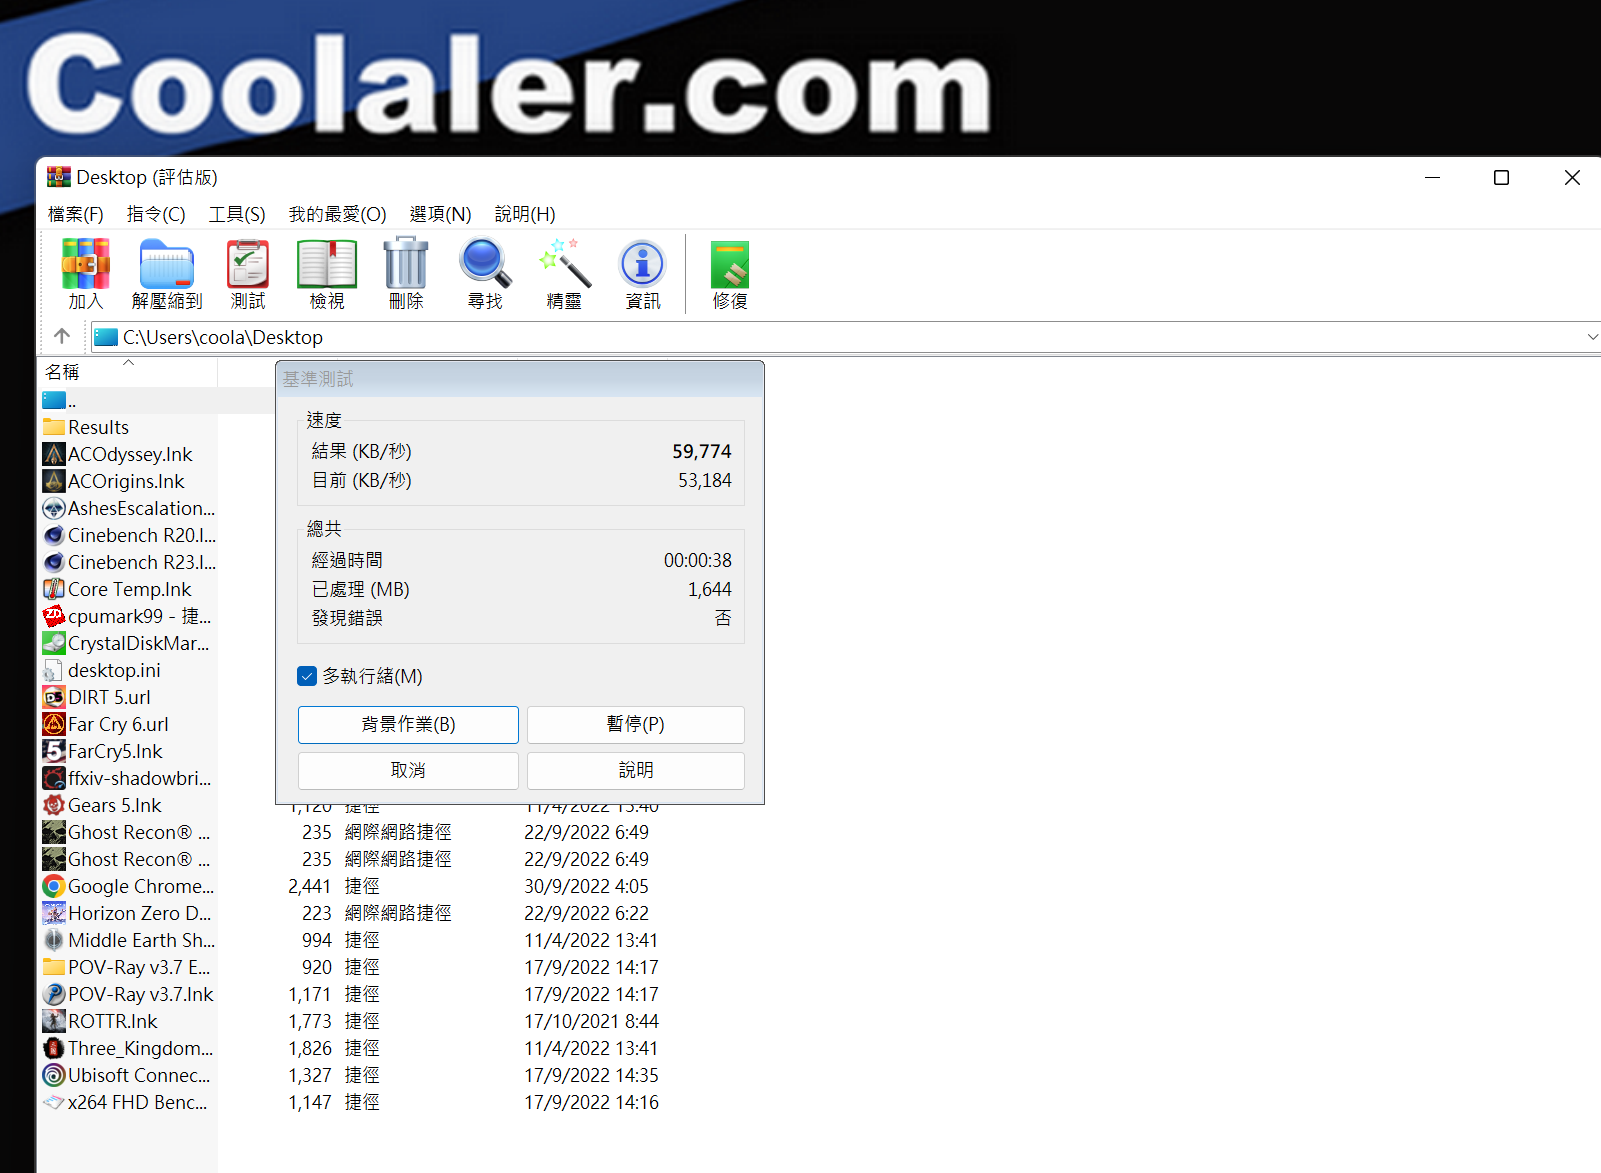
對照組
Ryzen 7 7700X WinRAR 59,774KB/S
WinRAR比 Benchmark比較表

[/B]
⇧單位: Performance Score (數字愈大愈好)
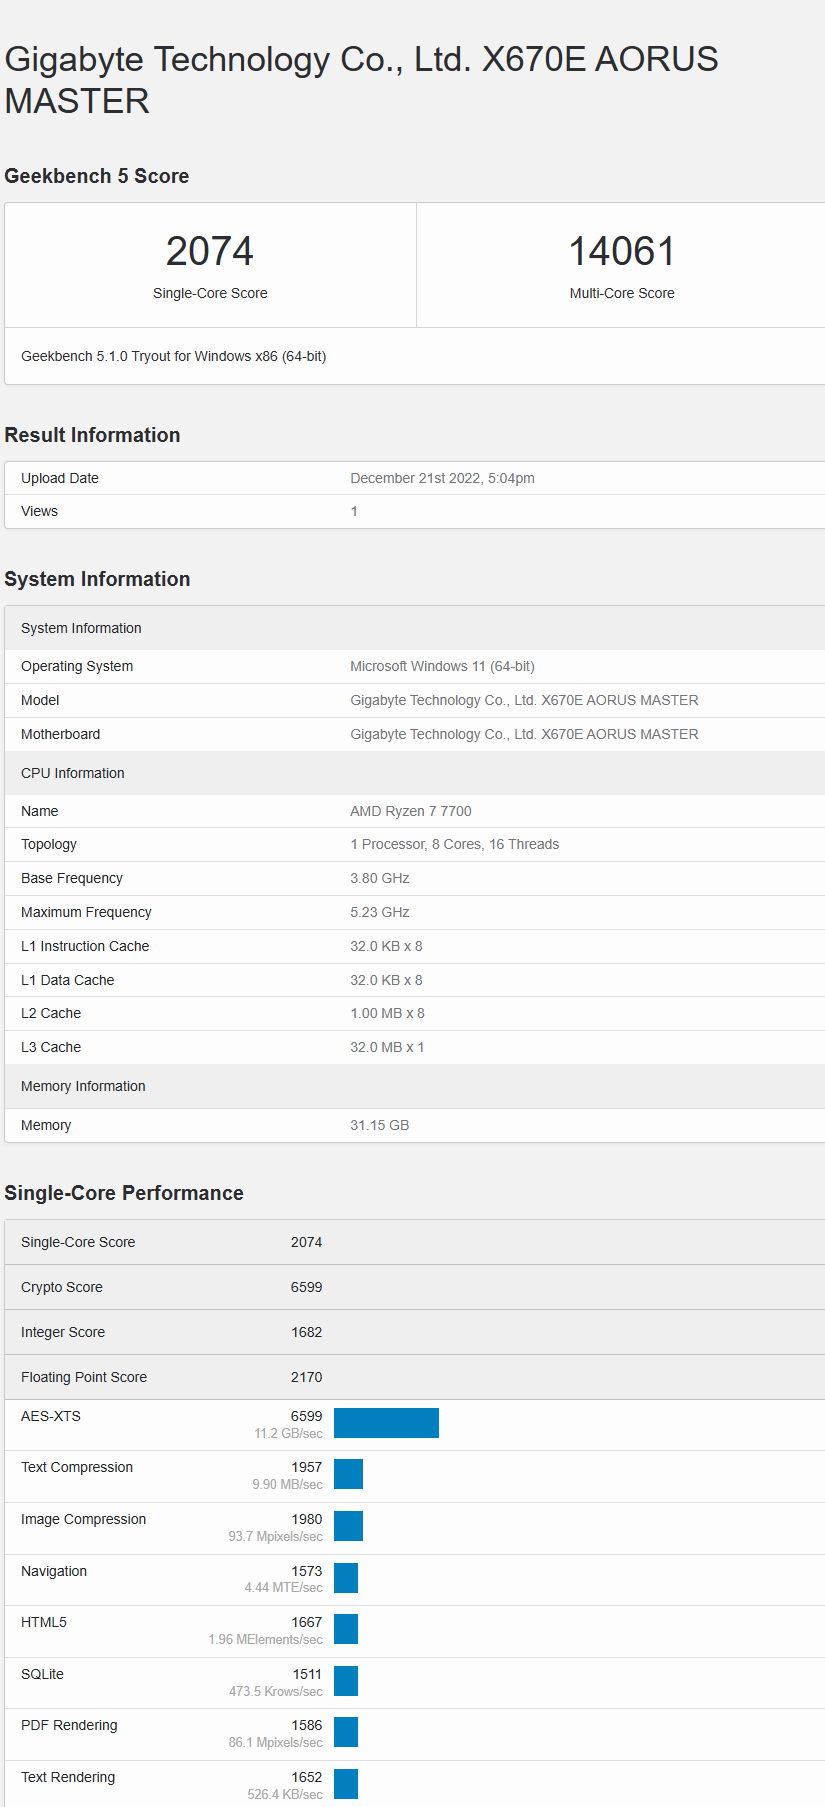
10.Geekbench5.4
Geekbench是一款跨平台的處理基準測試程序,其評分系統可分為單核和多核性能,以及模擬真實使用場景的工作負載能力。有 Geekbench 2、Geekbench 3,Geekbench4以及 Geekbench 5。軟體基準測試適用於 macOS、Windows、Linux、Android和 iOS。Geekbench 4、Geekbench5還測量 GPU性能包括圖像處理和計算機視覺等領域
Ryzen 7 7700 Geekbench5 Results Single-Core Score 2074 Multi-Core Score 14061
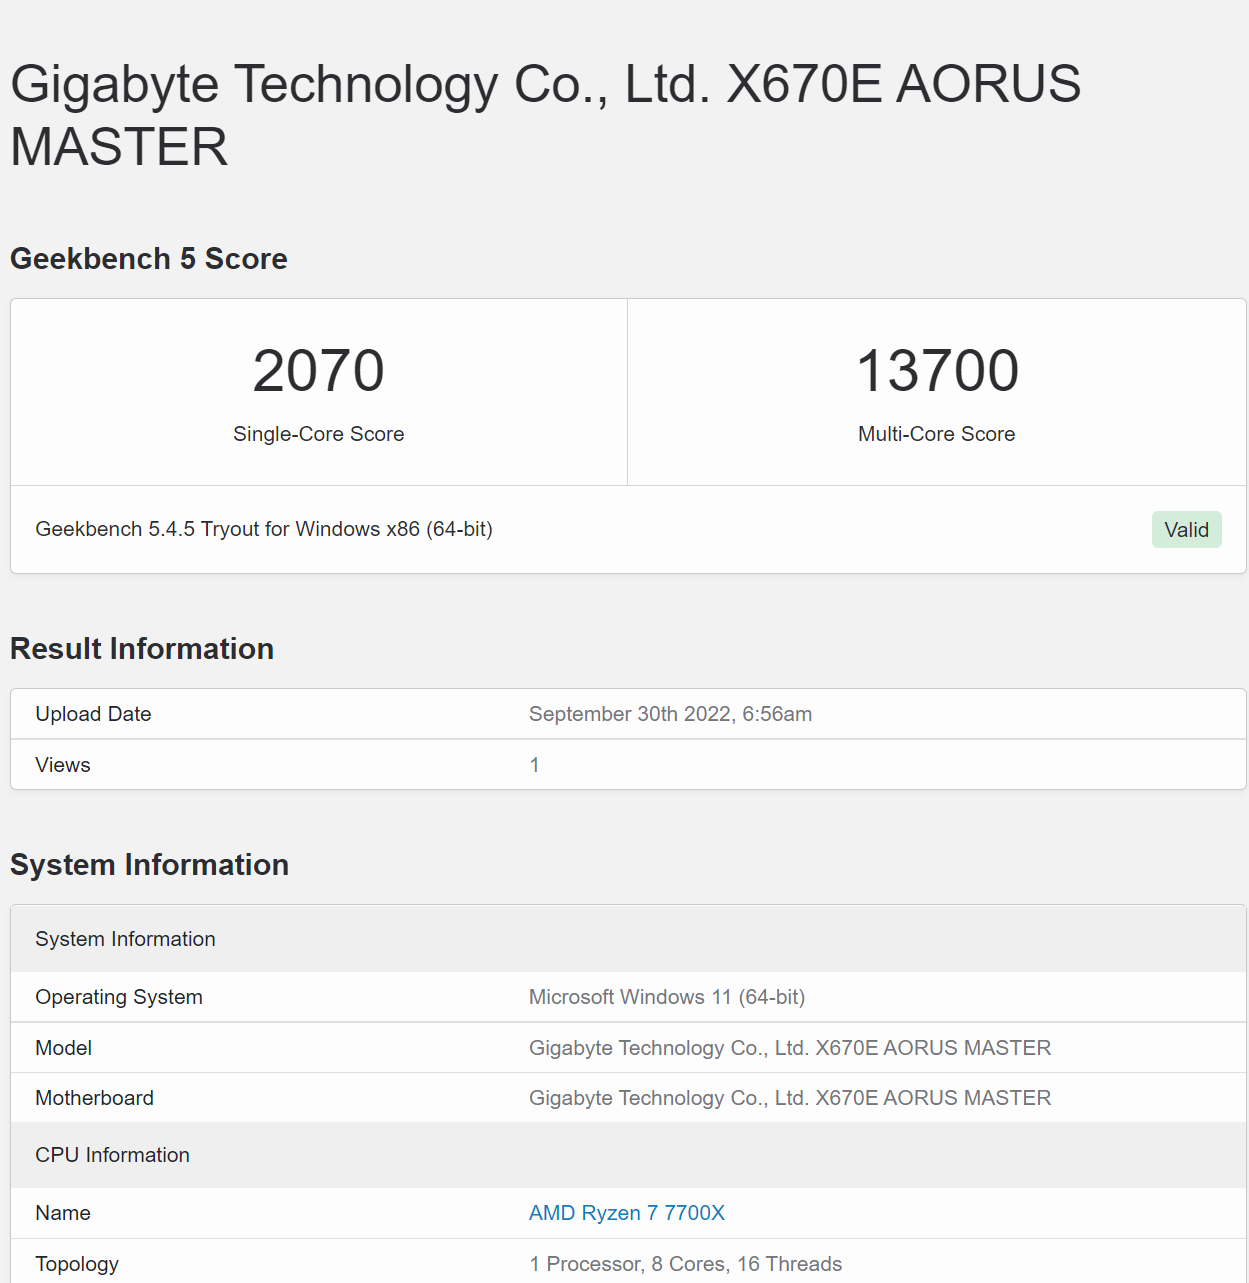
對照組
Ryzen 7 7700X Geekbench5 Results Single-Core Score 2070 Multi-Core Score 13700
Geekbench 5 Benchmark比較表

⇧單位: Performance Score (數字愈大愈好)
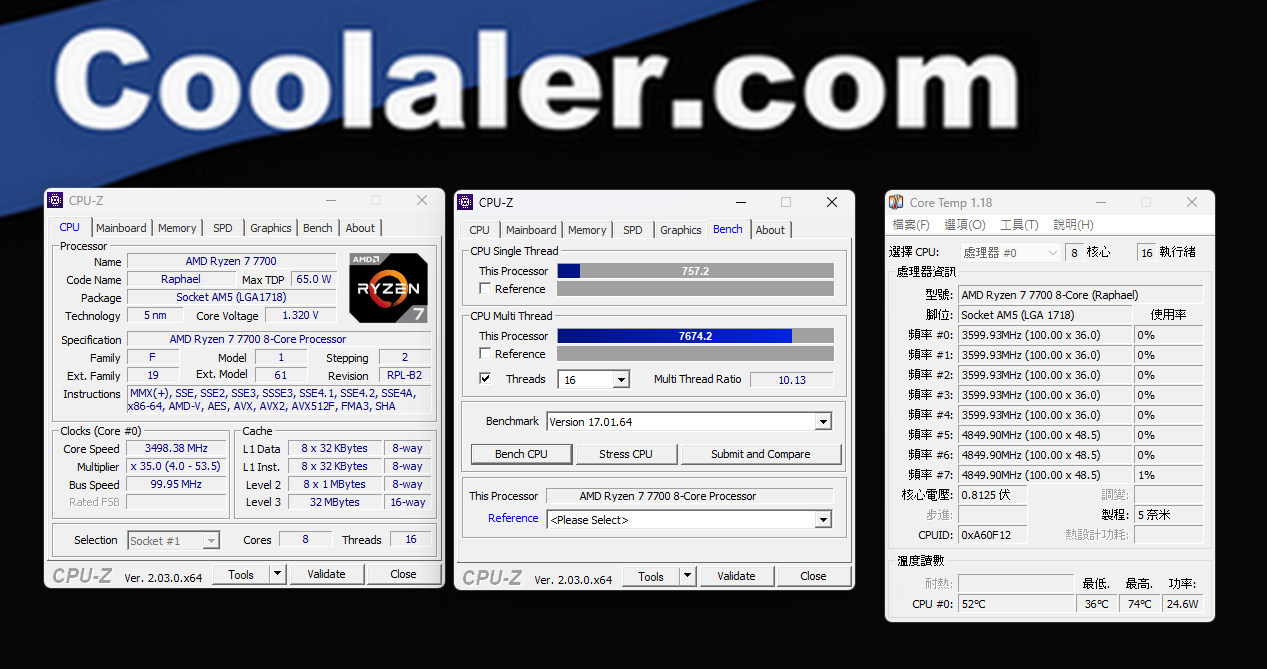
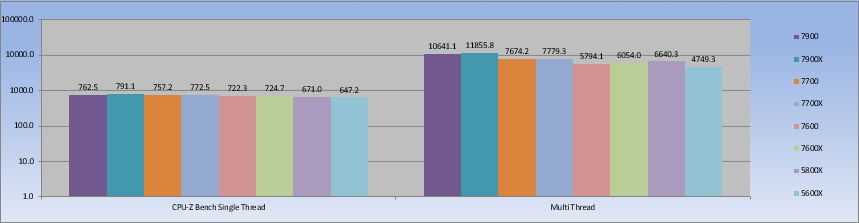
11.CPU-Z Bench
CPU-Z為一個中央處理器、記憶體及主機板資訊的 Windows軟體,在近年新增了 Bench item,提供處理器的快速簡單測試
Ryzen 7 7700 CPU-Z Bench Results Single Thread 757.2 Multi Thread 7674.2
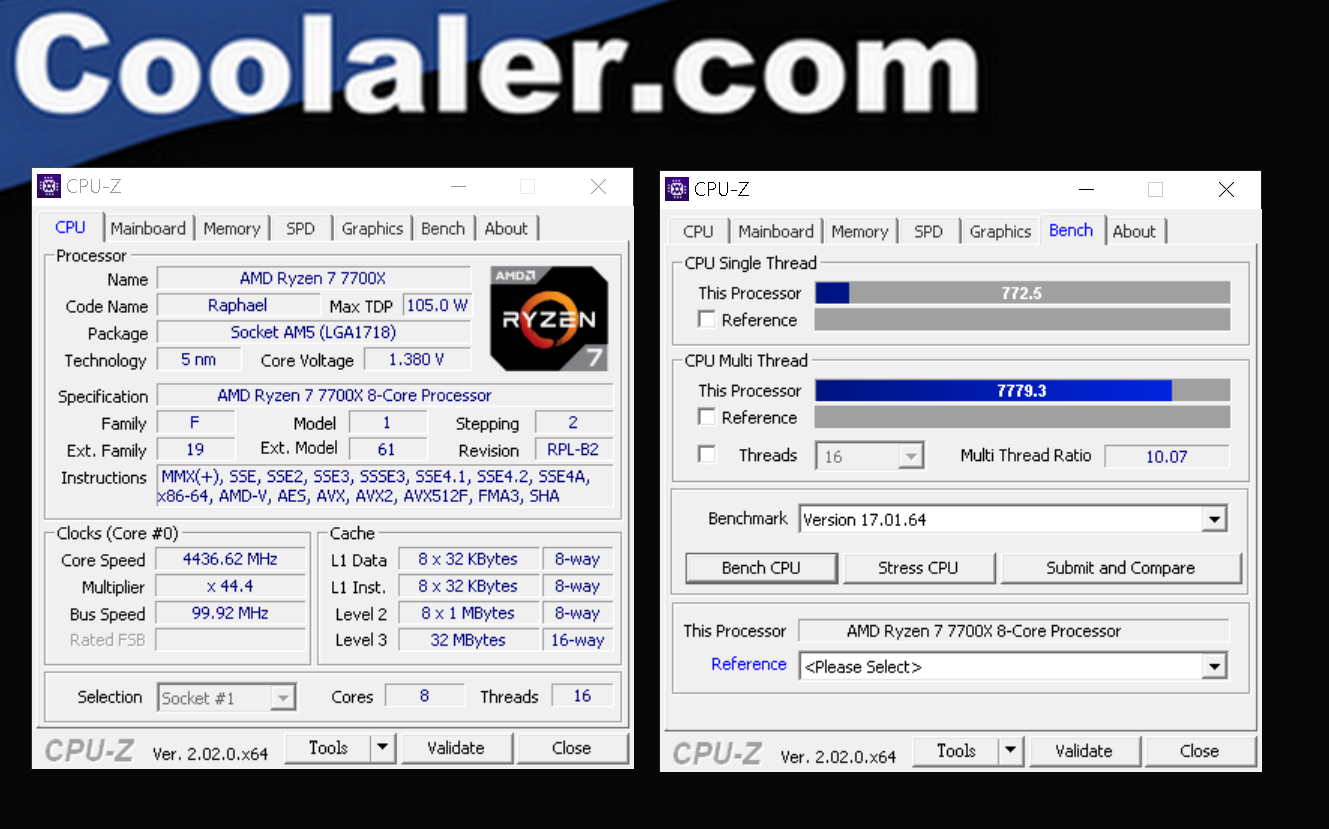
對照組
Ryzen 7 7700X CPU-Z Bench Results Single Thread 772.5 Multi Thread 7779.3
CPU-Z Benchmark比較表

⇧單位: Performance Score (數字愈大愈好)
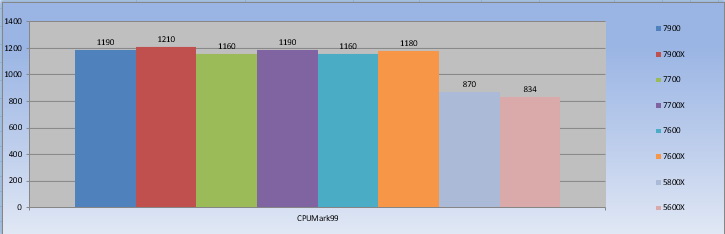
13.CPUMark99
Ryzen 9 7900 CPUMARK99 1190分
Ryzen 7 7700
CPUMARK99 1160分

對照組
Ryzen 7 7700X
CPUMARK99 1190分

CPUMark99 Benchmark比較表

[/B]
⇧單位: Performance Score (數字愈大愈好)
C.遊戲測試
測試諸元
Ryzen 7 7700
a.Far Cry 5 Benchmark
Far Cry 5 Benchmark《極地戰嚎5》
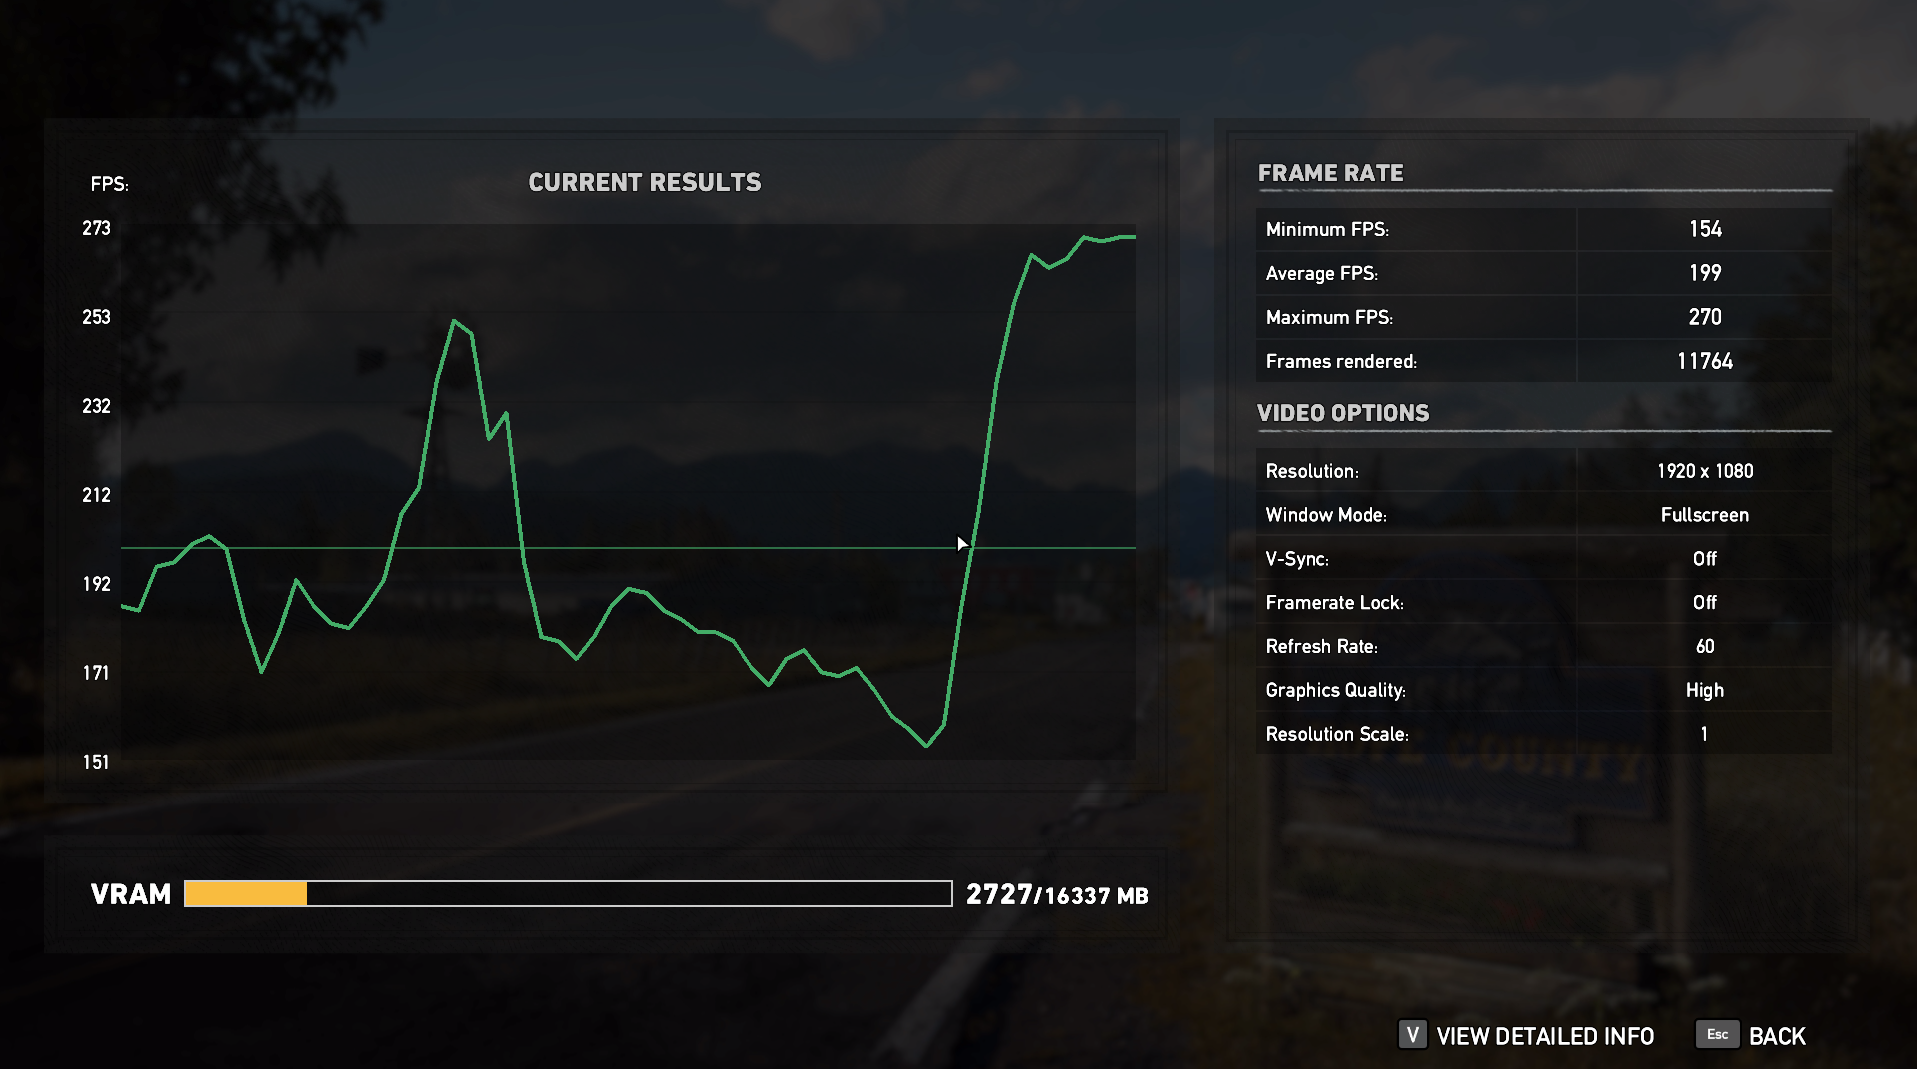
Far Cry 5《極地戰嚎5》是一個自帶 Benchmark的新遊戲,是由育碧蒙特婁、育碧多倫多開發和育碧軟體發行的開放世界第一人稱動作冒險遊戲

1080P Far Cry 5 Benchmark Ave Results
Ryzen 7 7700 Far Cry 5 1080P Benchmark Ave 199fps
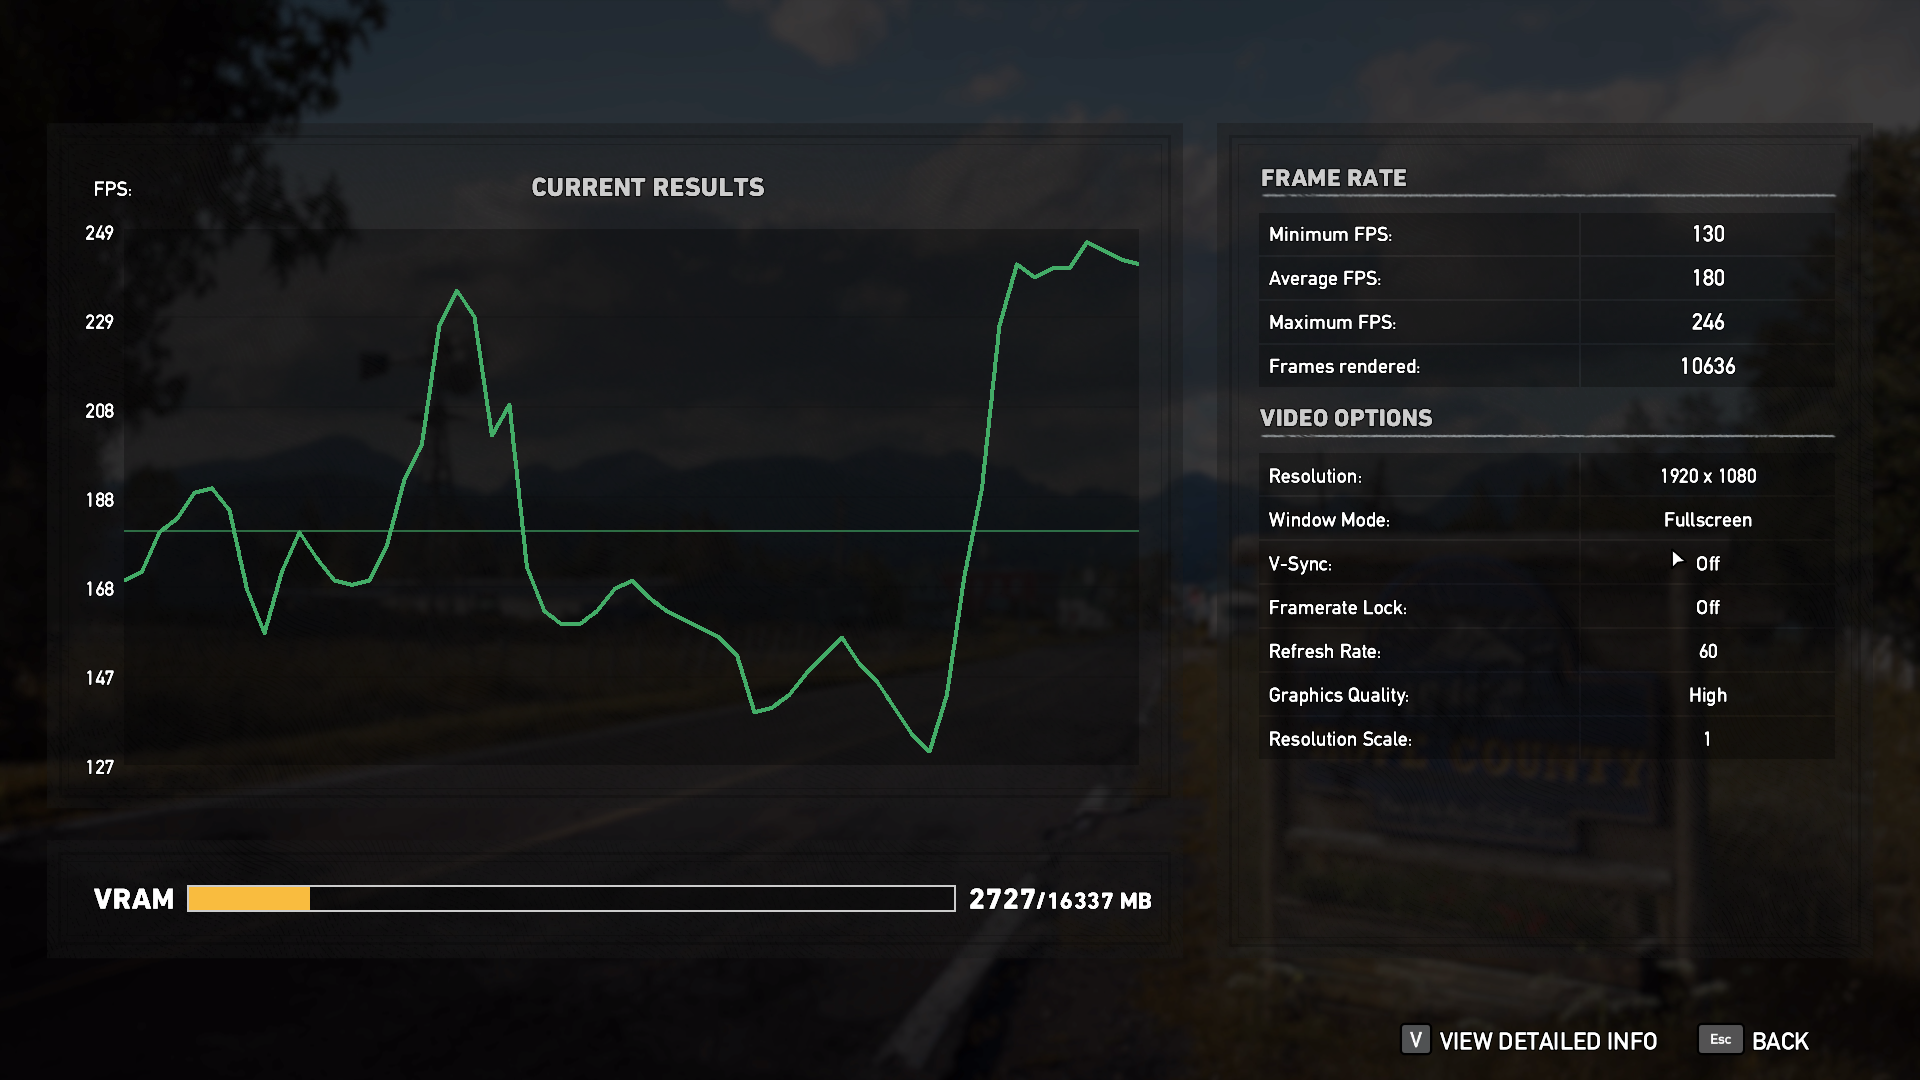
對照組
Ryzen 7 7700X Far Cry 5 1080P Benchmark Ave 180fps
Far Cry 5 Benchmark 4K Ave Results[/B]
Ryzen 7 7700 Far Cry 5 4K Benchmark Ave 124fps
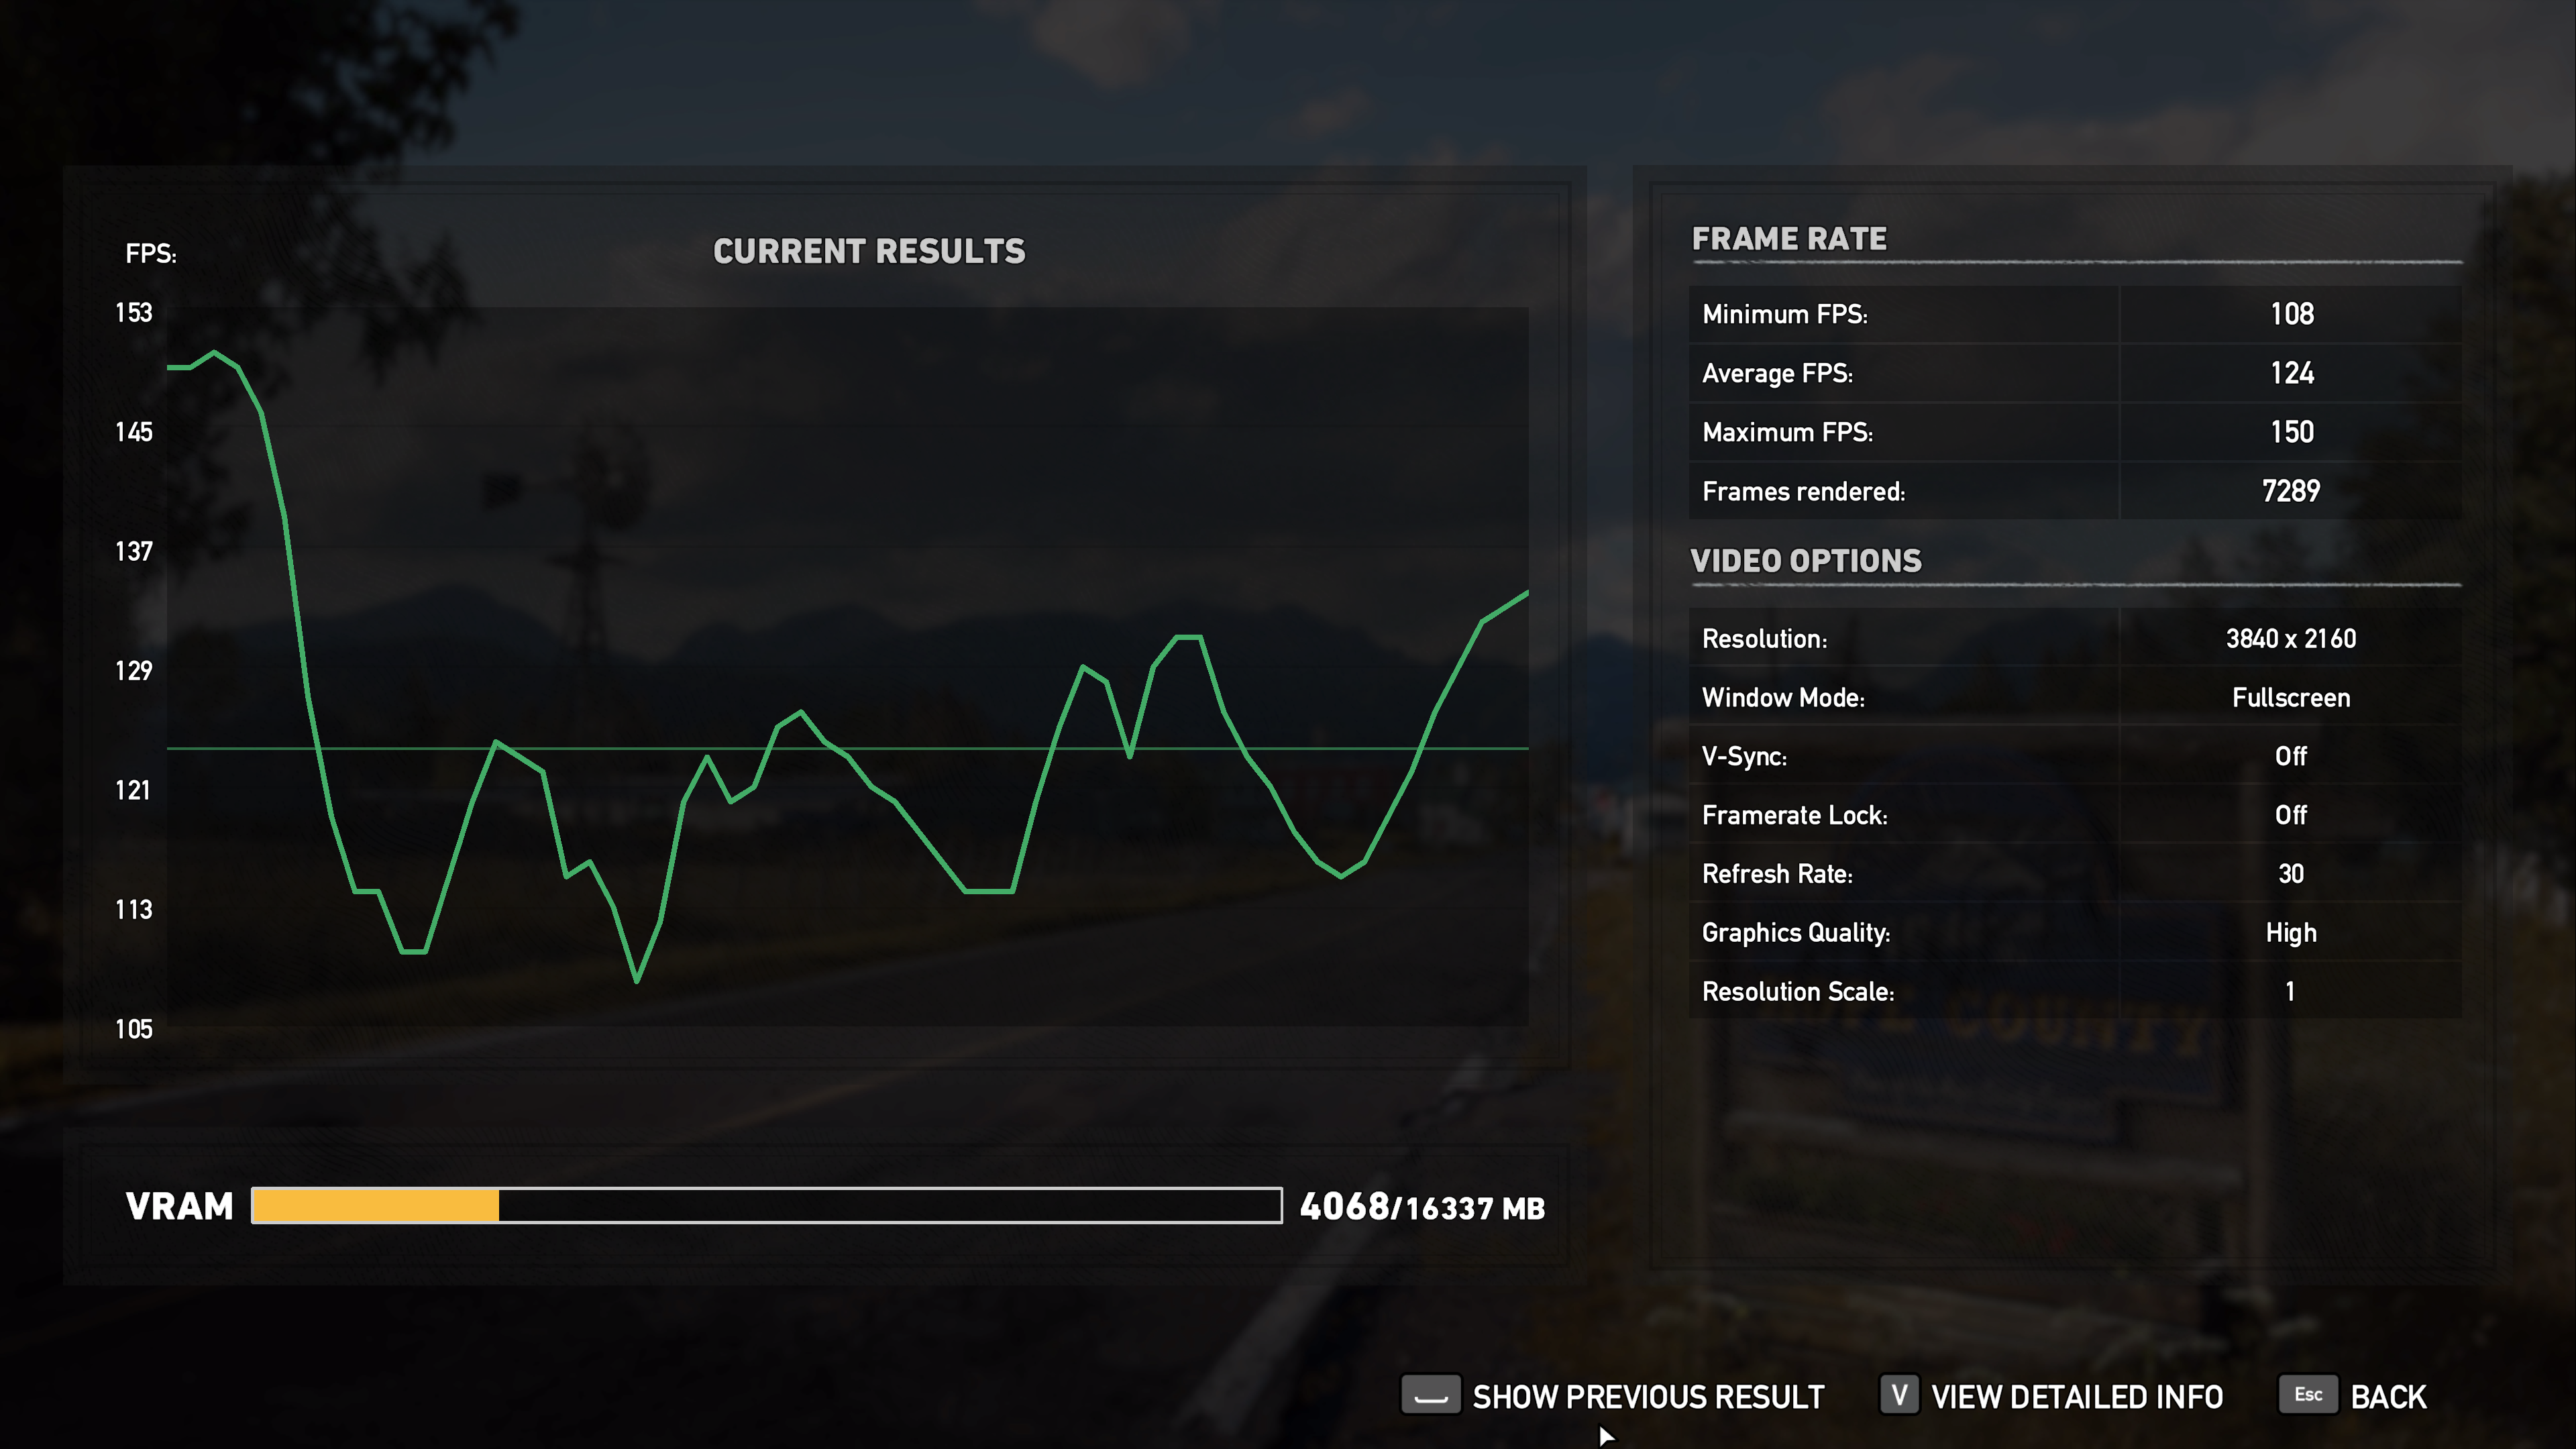
對照組
Ryzen 7 7700X Far Cry 5 4K Benchmark Ave 123fps

Far Cry 5 Benchmark比較表

[/B]
⇧單位: Performance Score (數字愈大愈好)
b.Assassin's Creed Origins Benchmark
Assassin's Creed Origins《刺客教條:起源》中國大陸譯作「刺客信條:起源」)是一部由育碧蒙特婁開發由育碧公司發行的動作冒險遊戲
本作是刺客教條主系列的第十部作品,也是系列首次把時間線推前到刺客教條初代以前,同樣也自帶有測試軟體,遊戲的舞台是在托勒密王朝埃及豔后統治下的埃及,玩家所操控的角色是一位隸屬於法老的護衛,稱為守護者(Medjai),來自錫瓦(Siwa)名為巴耶克(Bayek)的埃及刺客

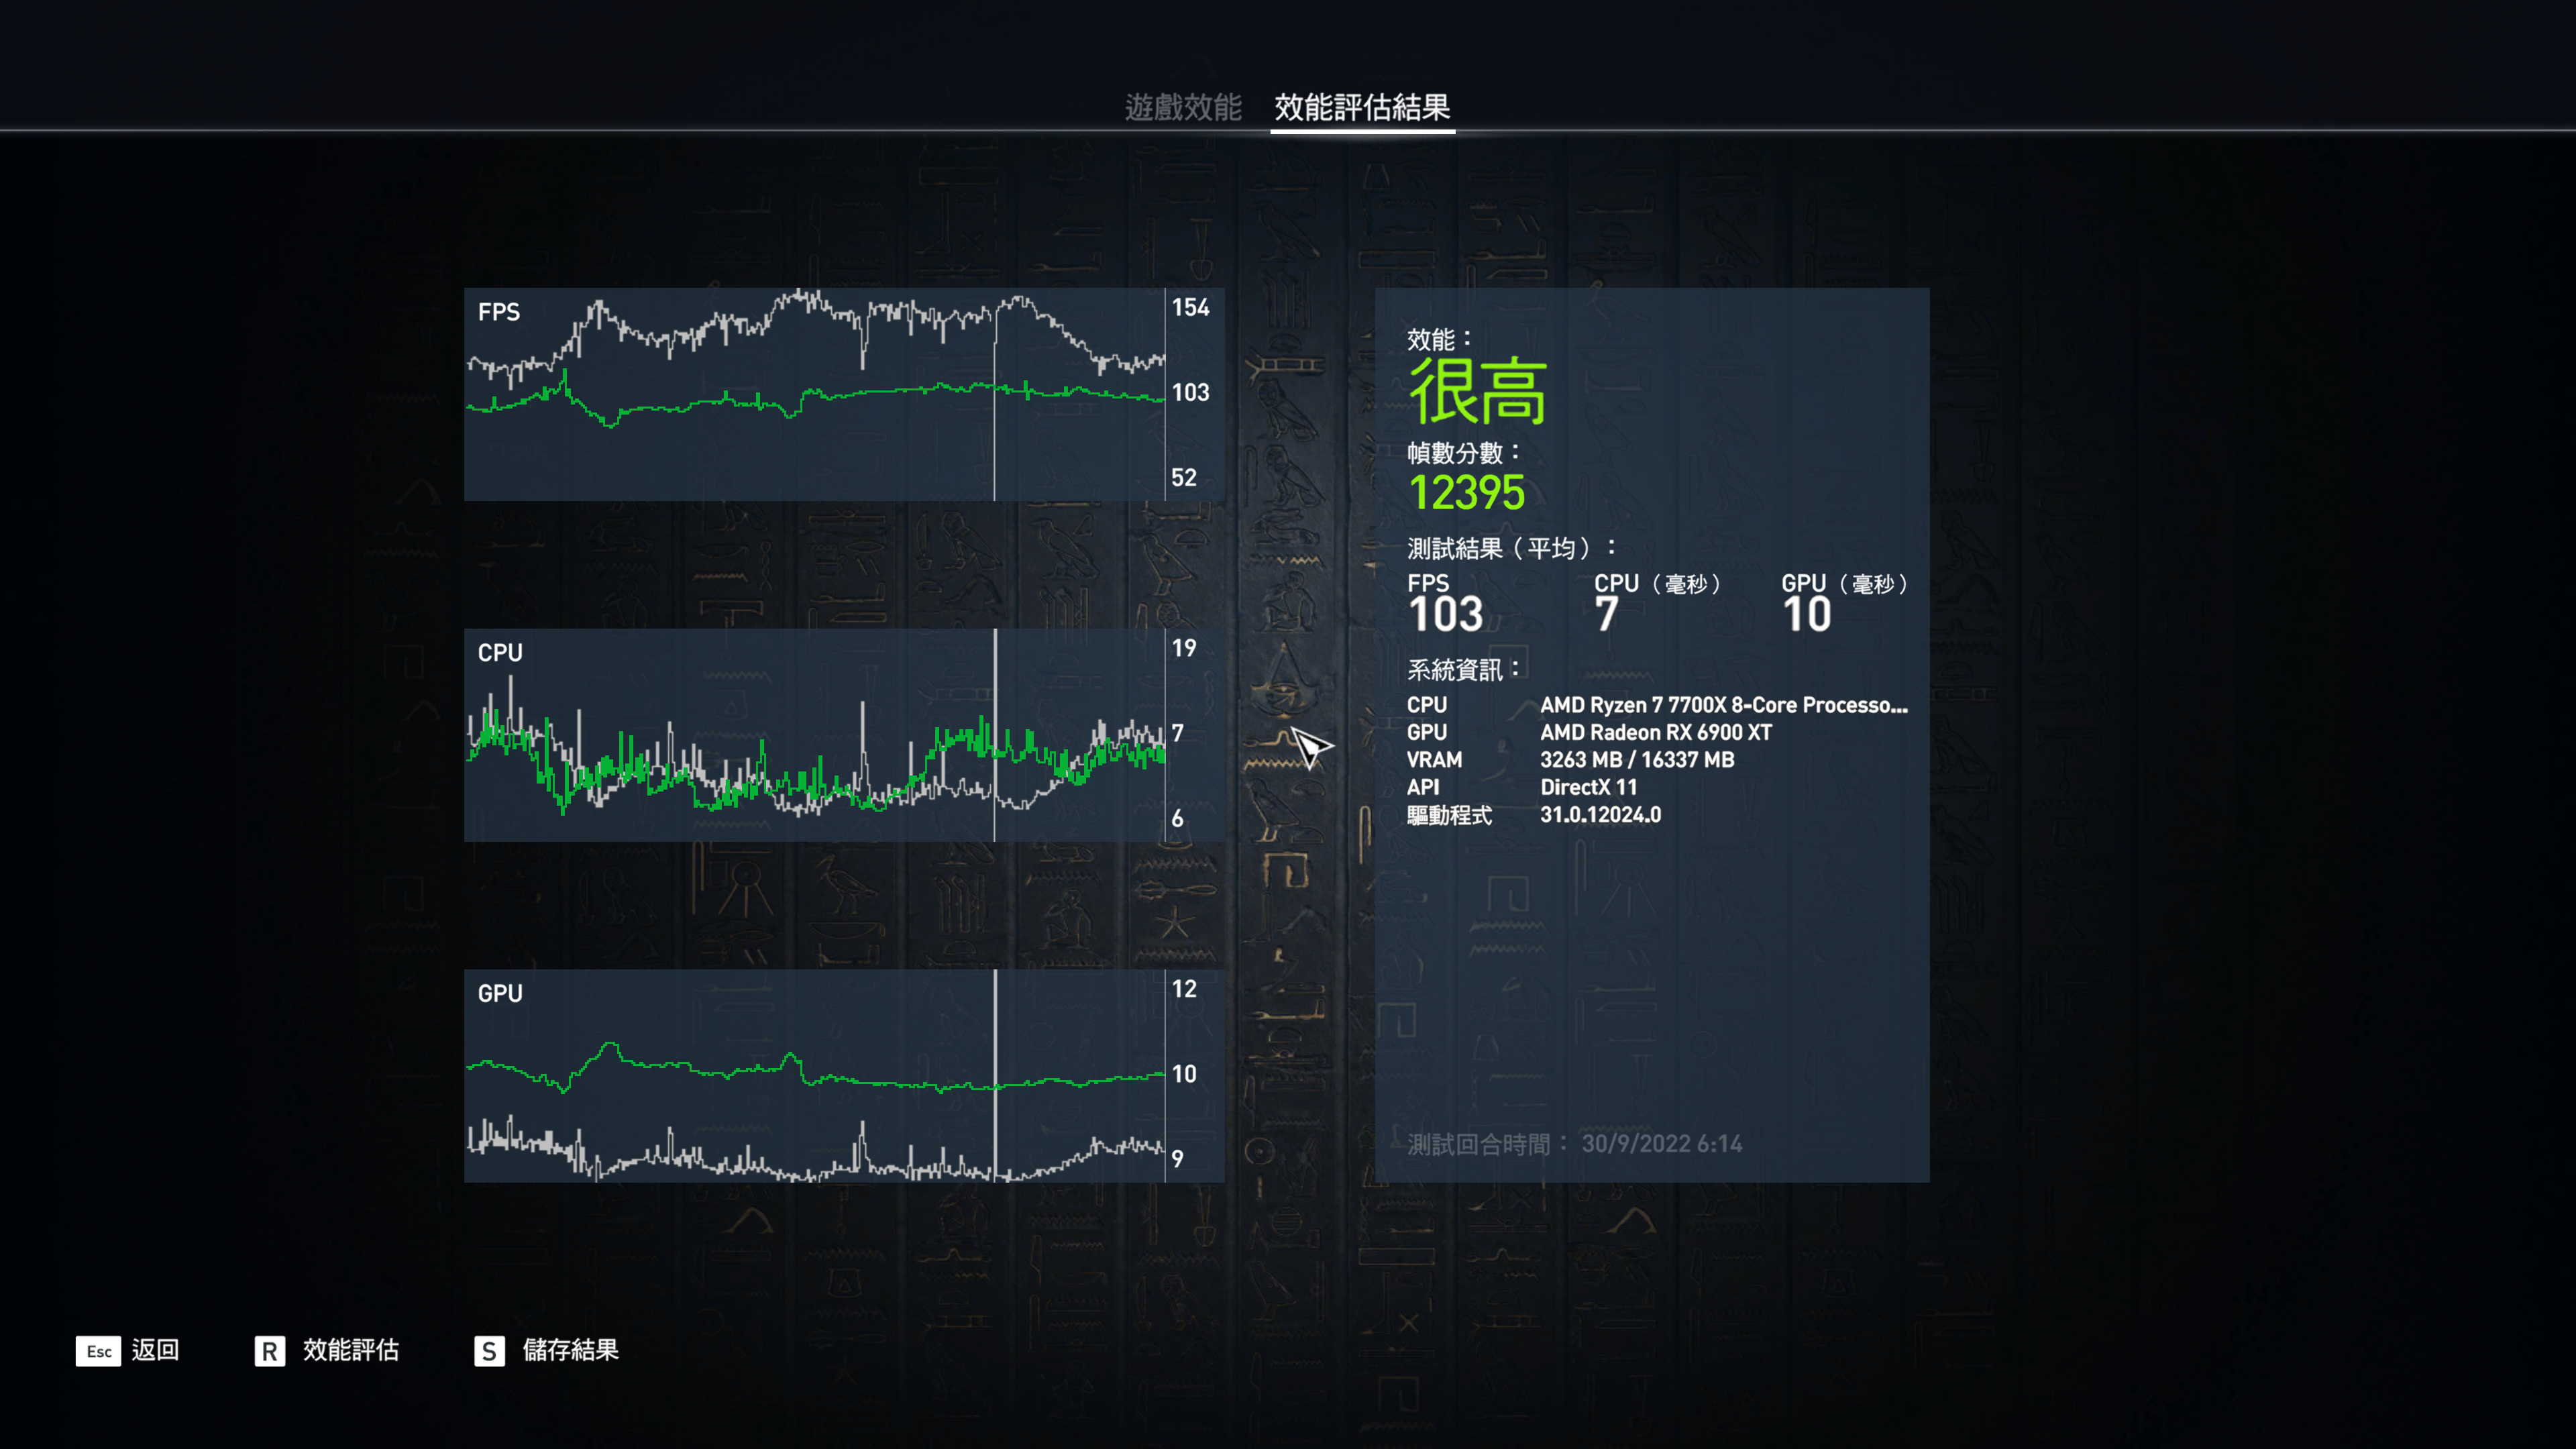
Assassin's Creed Origins Benchmark 1080P Results
Ryzen 7 7700 1080P Assassin's Creed Origins Benchmark :19142分
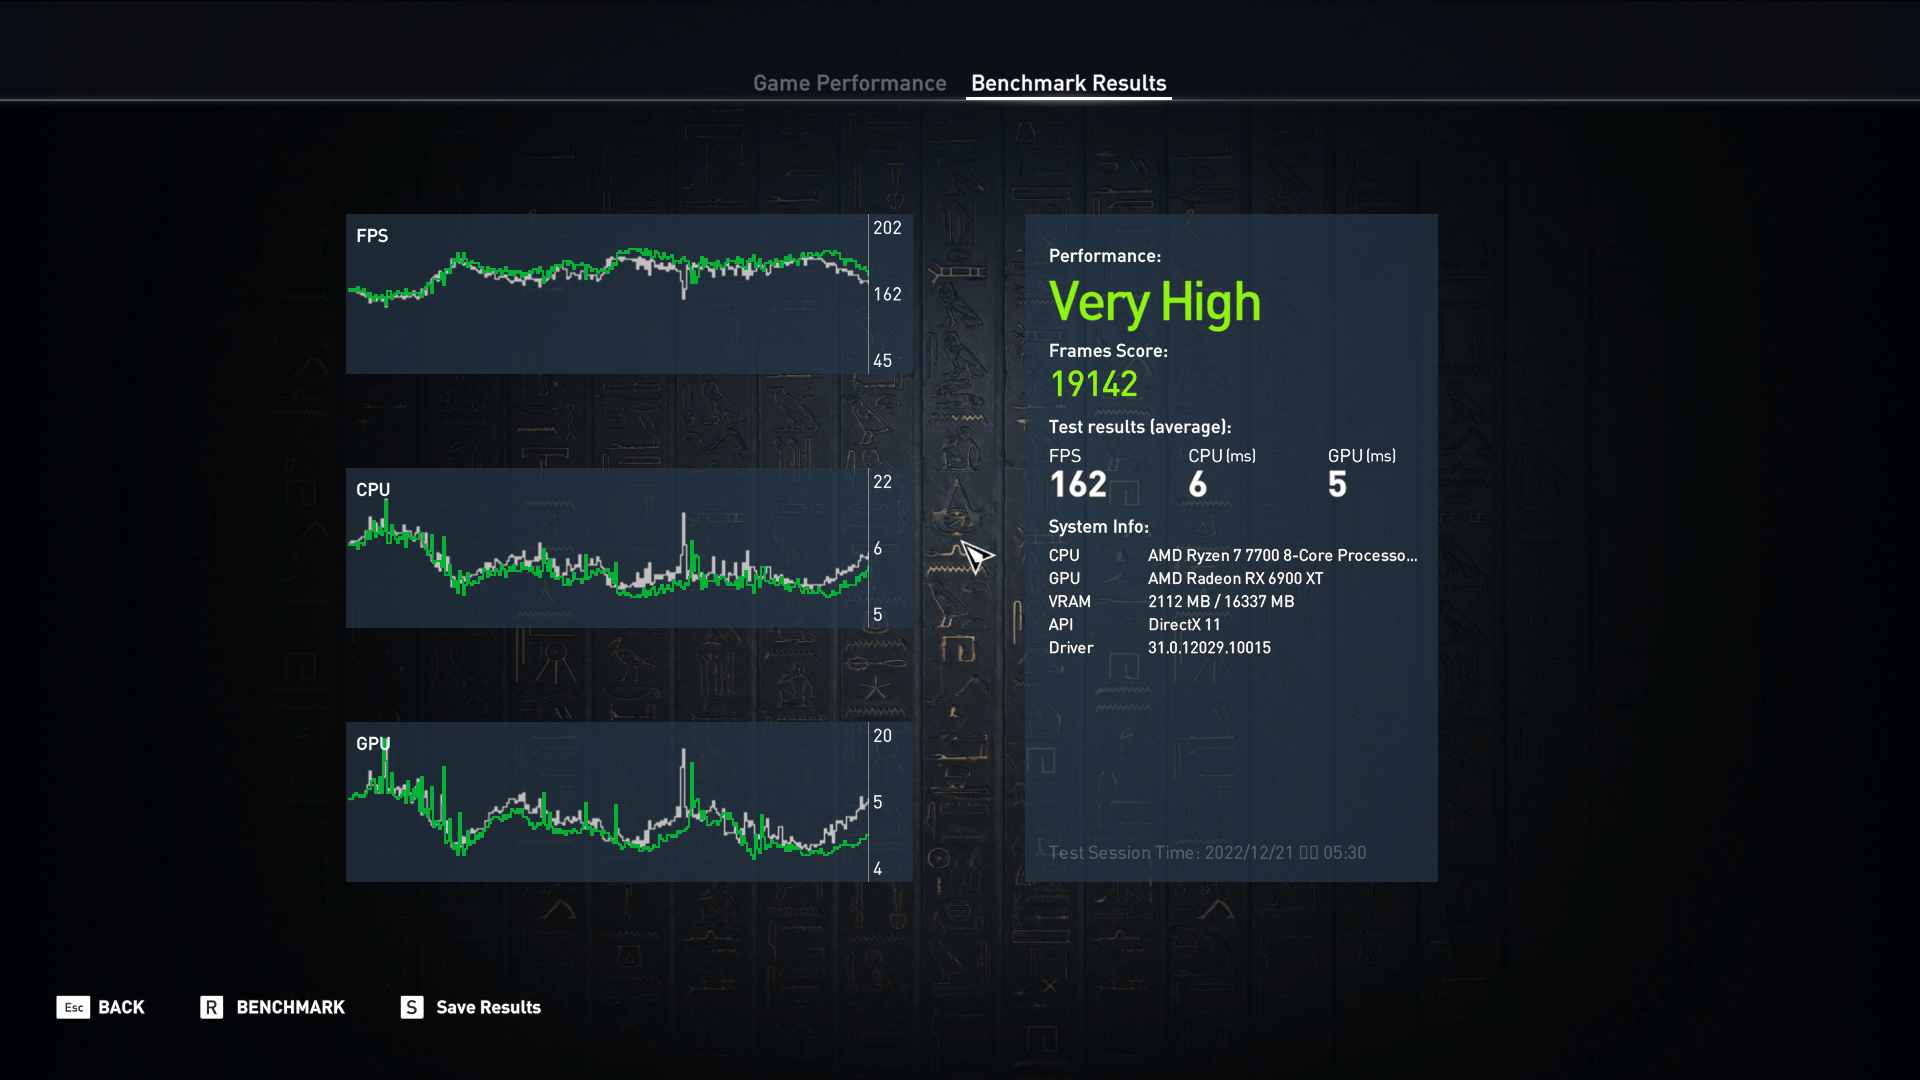
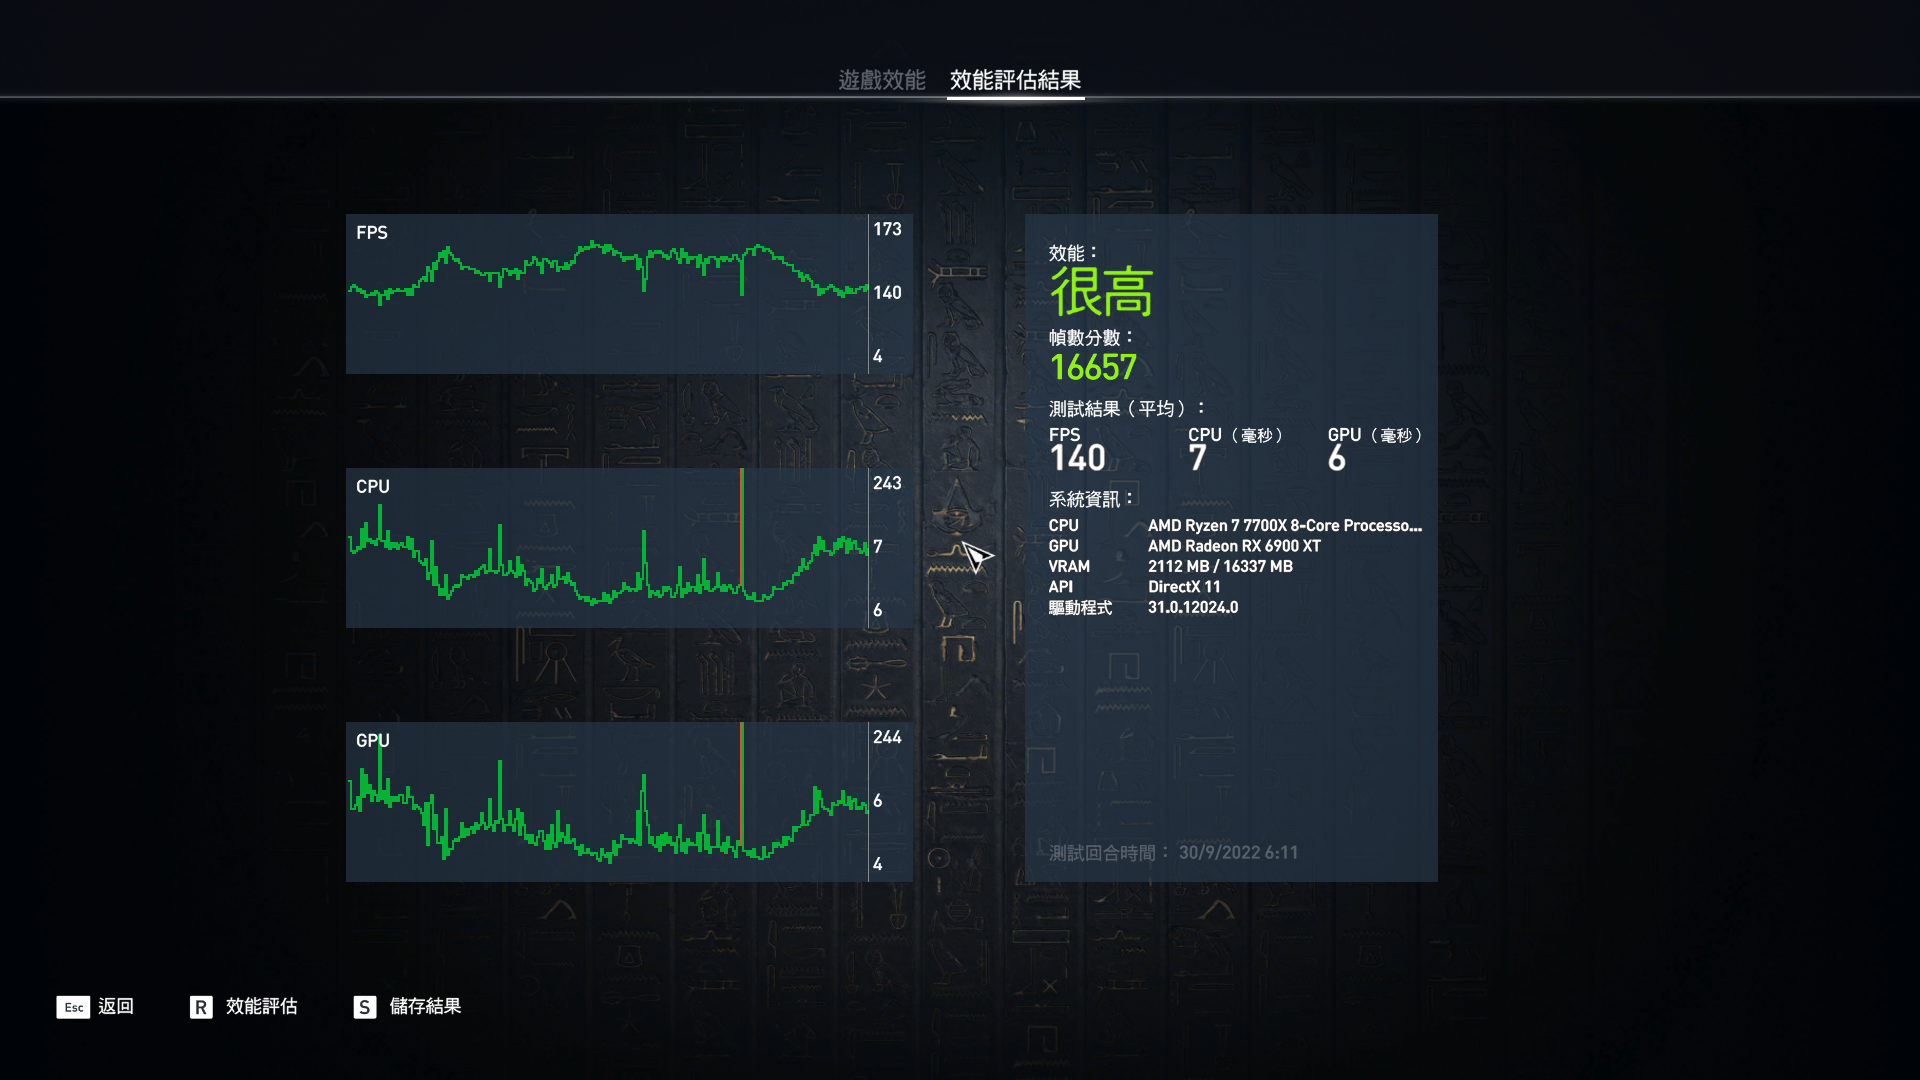
對照組
Ryzen 7 7700X 1080P Assassin's Creed Origins Benchmark :16657分
Assassin's Creed Origins Benchmark 4K Results[/B]
Ryzen 7 7700 4K Assassin's Creed Origins Benchmark :12494分
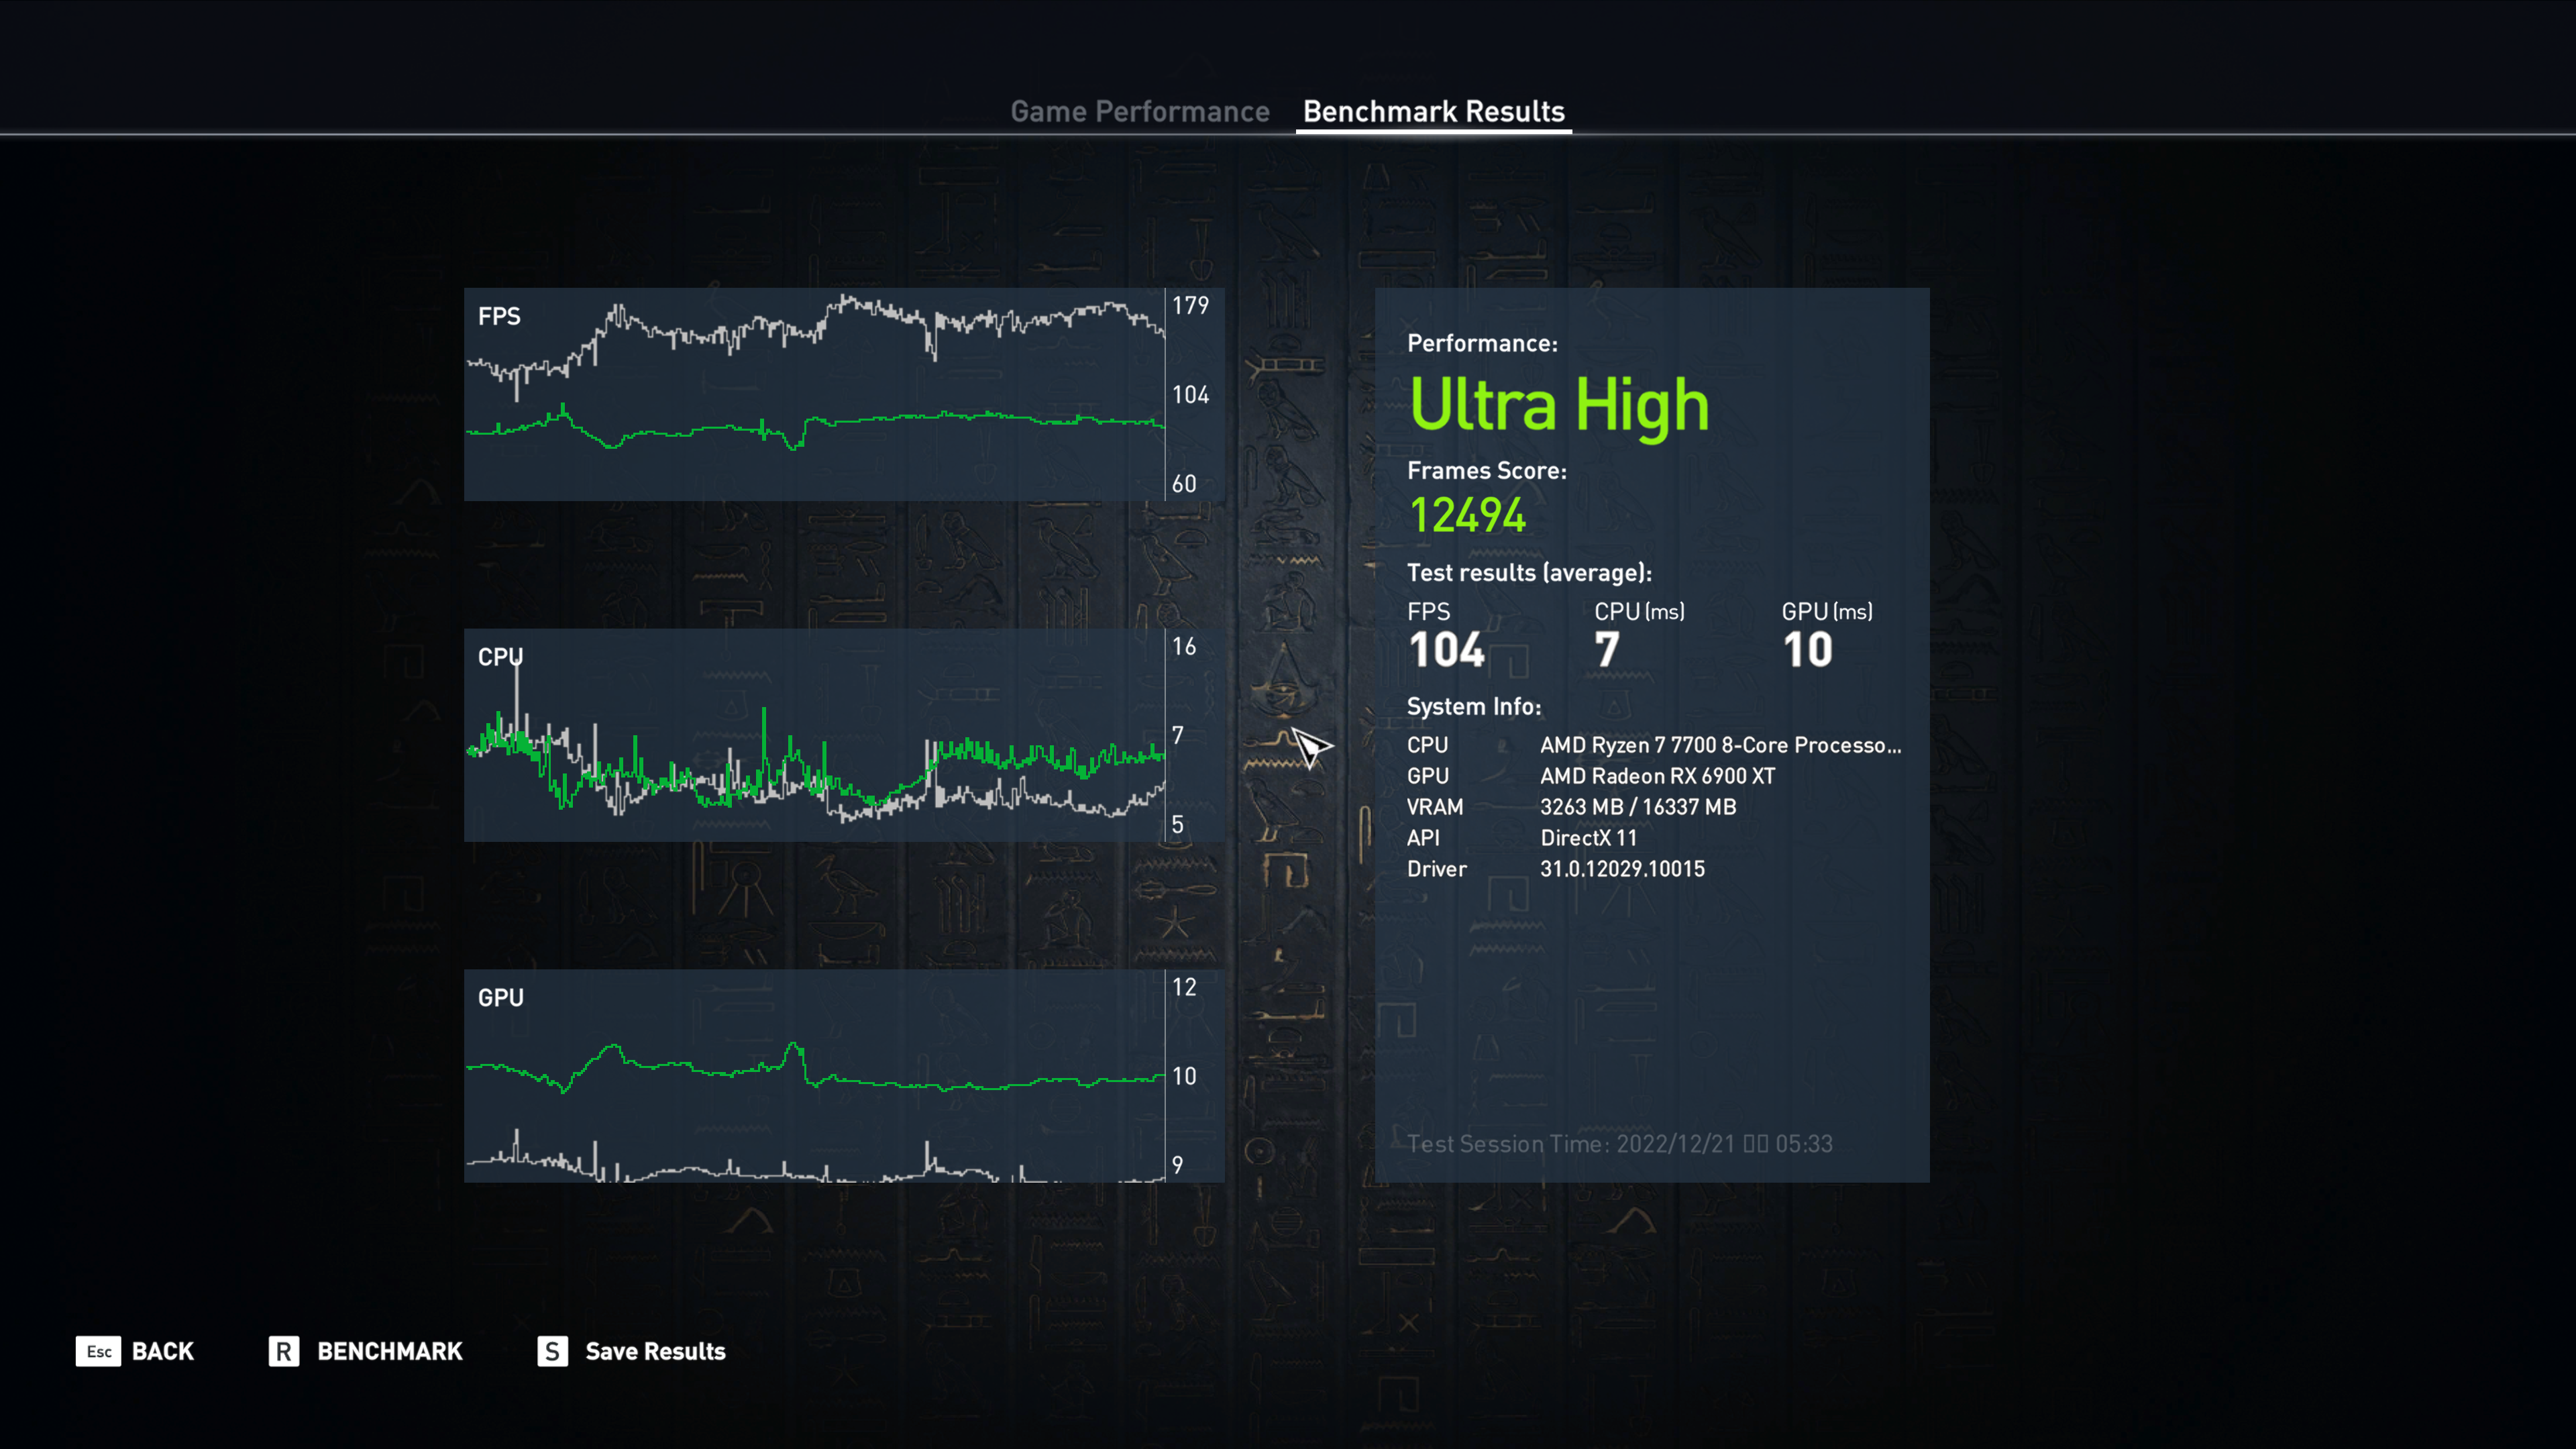
對照組
Ryzen 7 7700X 4K Assassin's Creed Origins Benchmark :12395分
Assassin's Creed Origins Benchmark比較表

[/B]
⇧單位: Performance Score (數字愈大愈好)
c.UNIGINE Superposition Benchmark
UNIGINE是一款專有的跨平台遊戲引擎,由俄羅斯軟件公司 UNIGINE Corp開發。除了用作遊戲引擎外,它還用於虛擬現實系統,嚴肅遊戲和可視化
UNIGINE最強大的功能是它的高級渲染器,支持 OpenGL 4.0和 DirectX 11,Superposition則為 2017版本,包含極端性能和穩定性測試:視頻卡,電源,冷卻系統,檢查預設和超頻模式與真實負載及在環境中的互動體驗

UNIGINE Superposition Benchmark 1080P Extreme Results
Ryzen 7 7700 1080P UNIGINE Superposition Benchmark Extreme:11556分
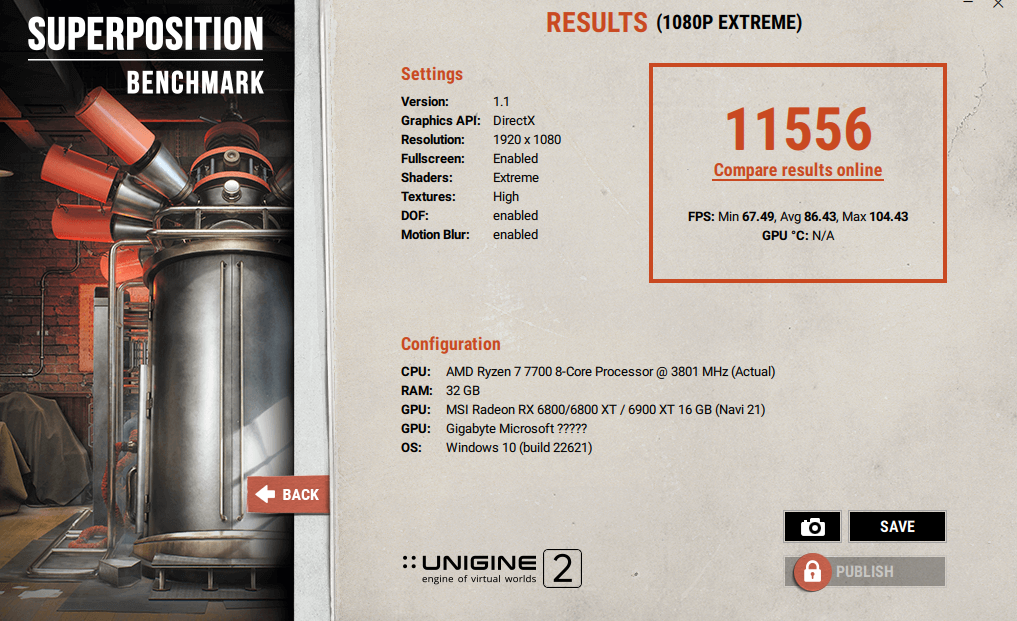
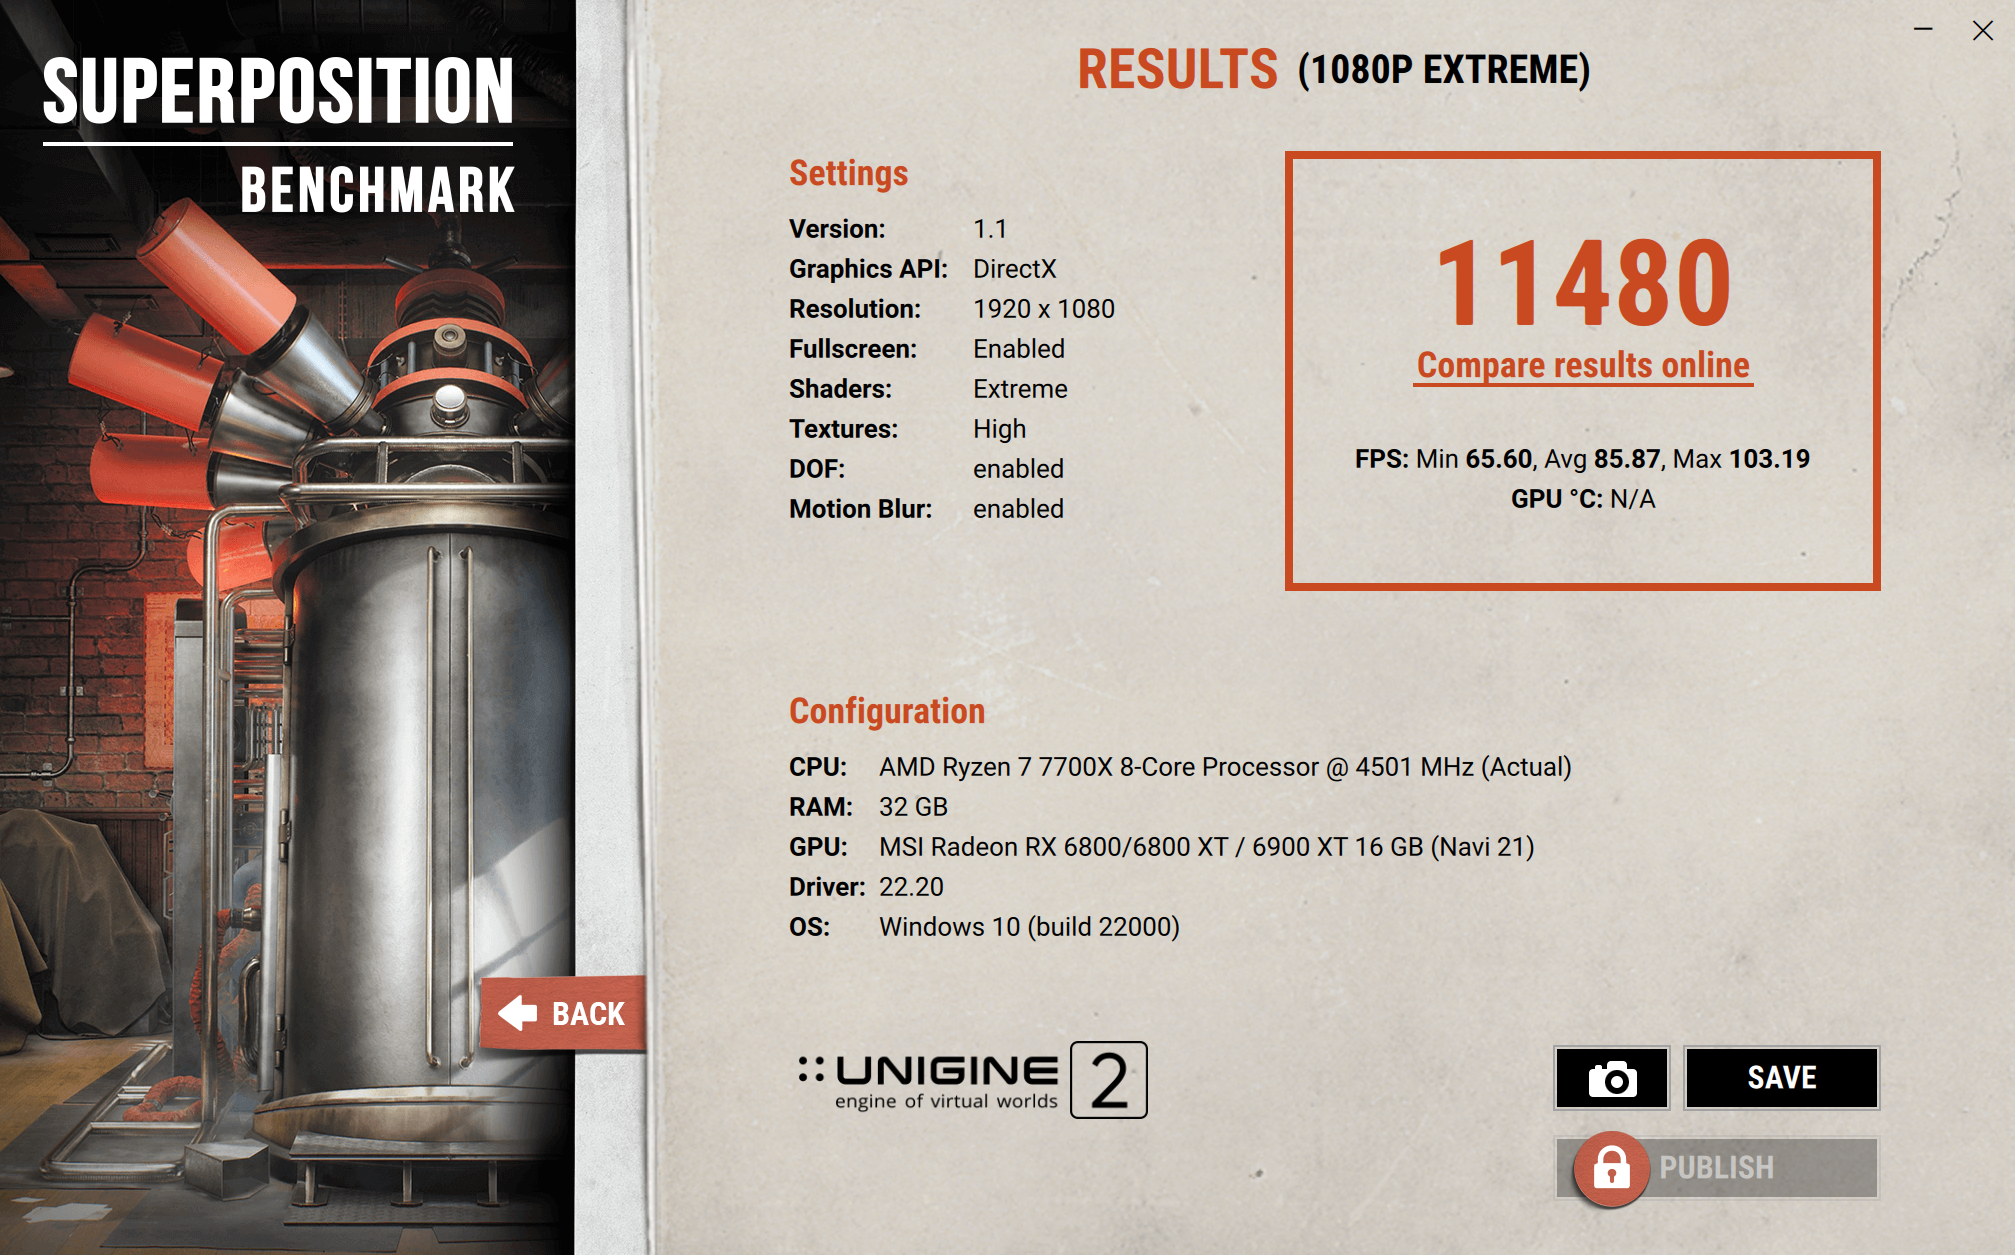
對照組
Ryzen 7 7700X 1080P UNIGINE Superposition Benchmark Extreme:11480分
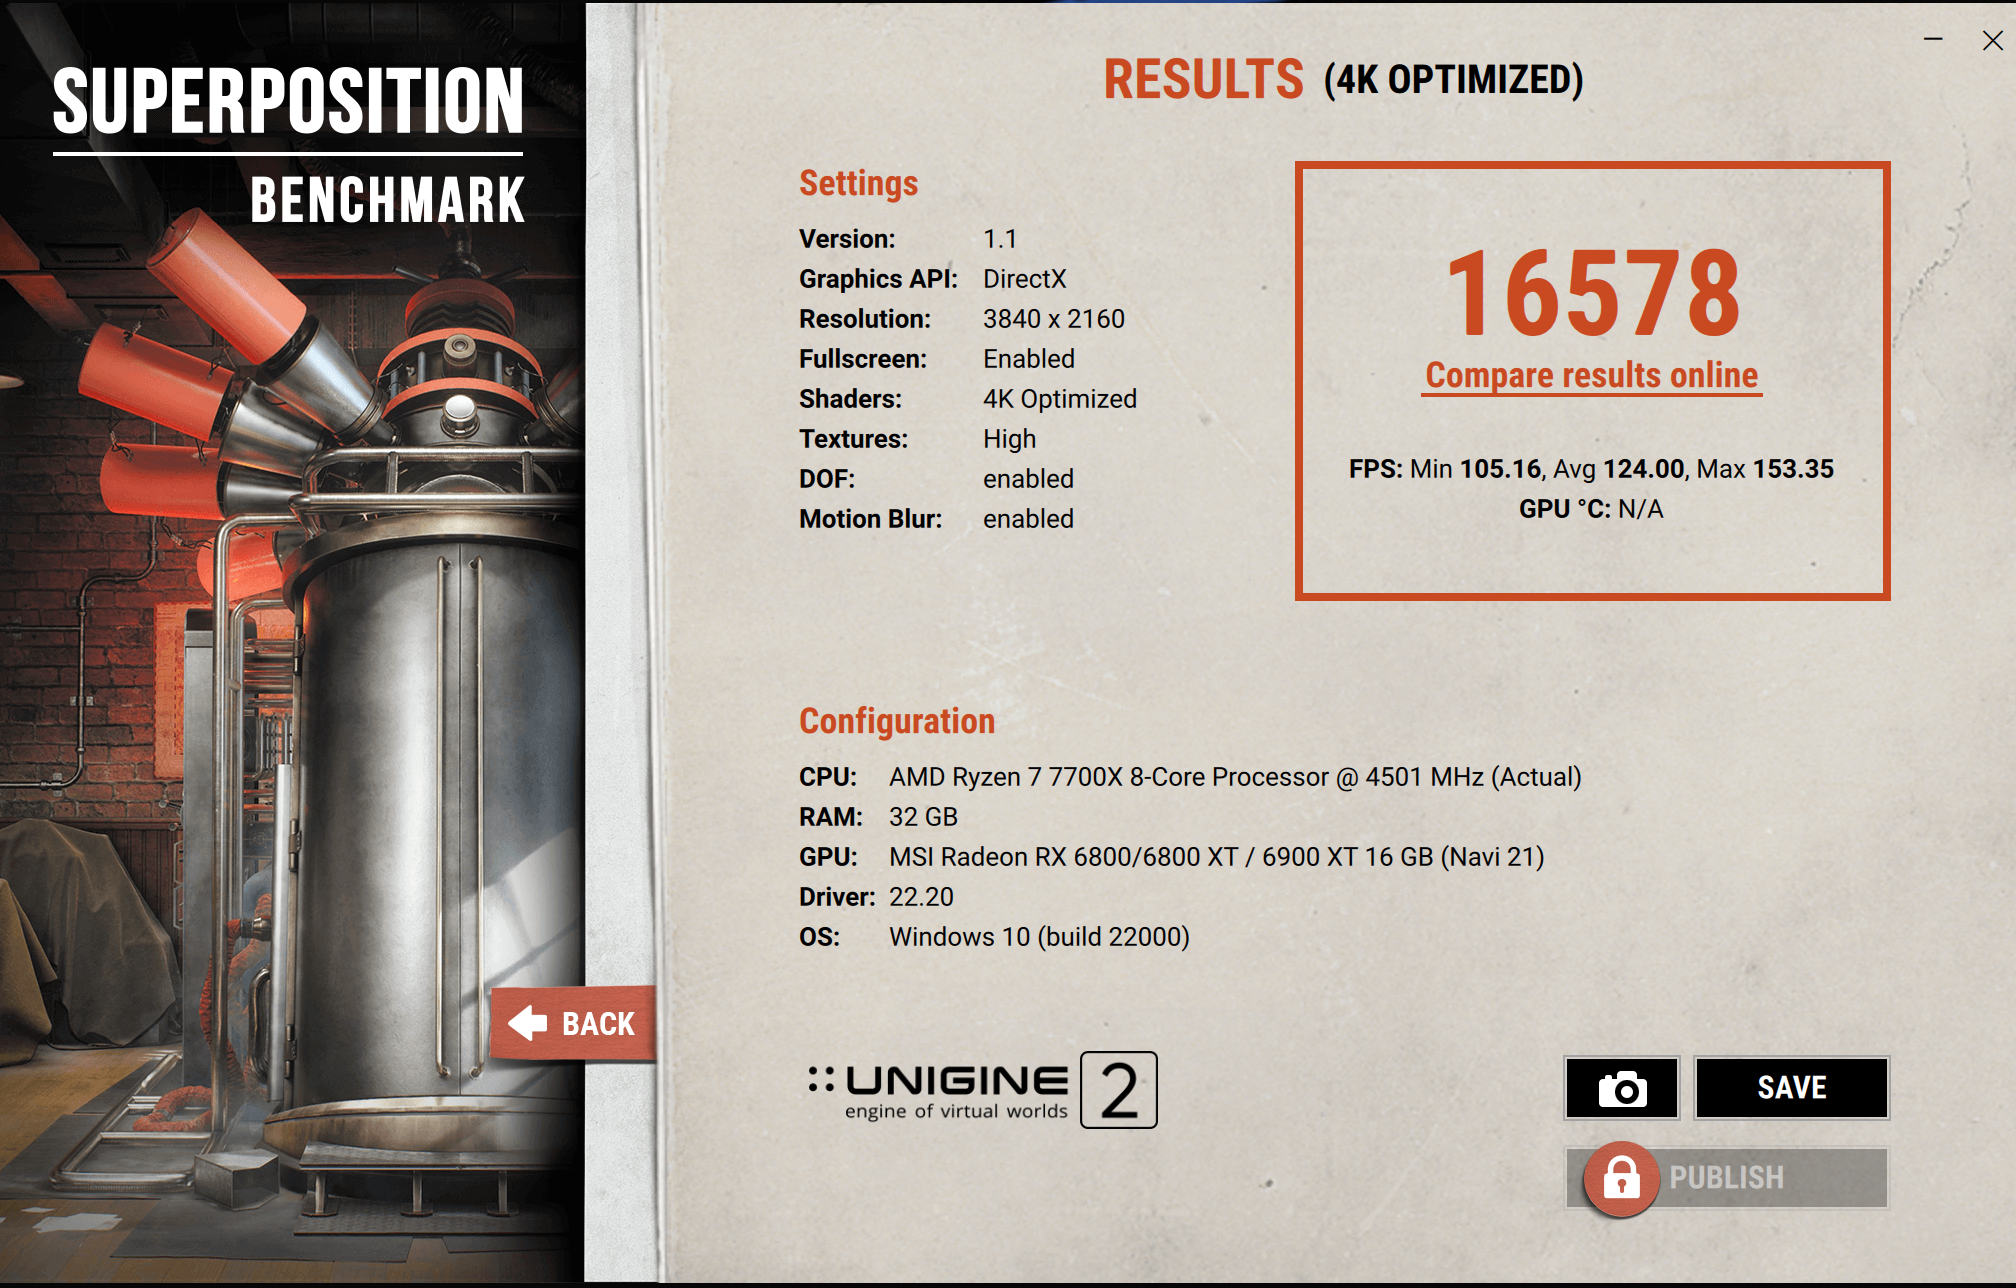
UNIGINE Superposition Benchmark 4K Optimazed Results[/B]
Ryzen 7 7700 4K UNIGINE Superposition Benchmark Extreme:16646分
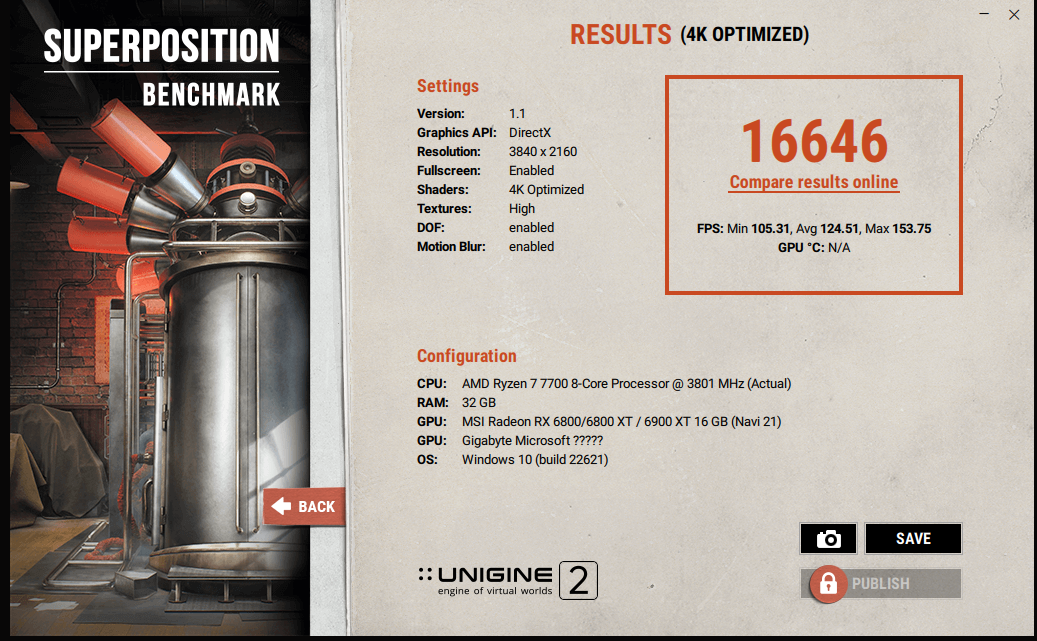
對照組
Ryzen 7 7700X 4K UNIGINE Superposition Benchmark Extreme:16578分
UNIGINE Superposition Benchmark比較表

[/B]
⇧單位: Performance Score (數字愈大愈好)
d.3DMark Time Spy & Extreme
3DMark Time Spy用來測試處理器及顯示卡之 3D圖形表現和工作負載,現由 UL擁有,主要是針對 DirectX 12的效能,測試有三個部分,第一個為顆粒陰影、曲面細分等效果,第二個則是光線追蹤的體積光照明技術,最後則是 CPU效能測試,在前兩個測試中,包含了數千萬個頂點跟多邊形,上百萬個曲面細分,這些都是 FireStrike的幾十倍,而 3DMark Time Spy Extreme是 3DMark Time Spy的 4K版本,所有圖形都是 4K規格

3DMark Time Spy Benchmark Results
Ryzen 7 7700 3DMark Time Spy:19771分
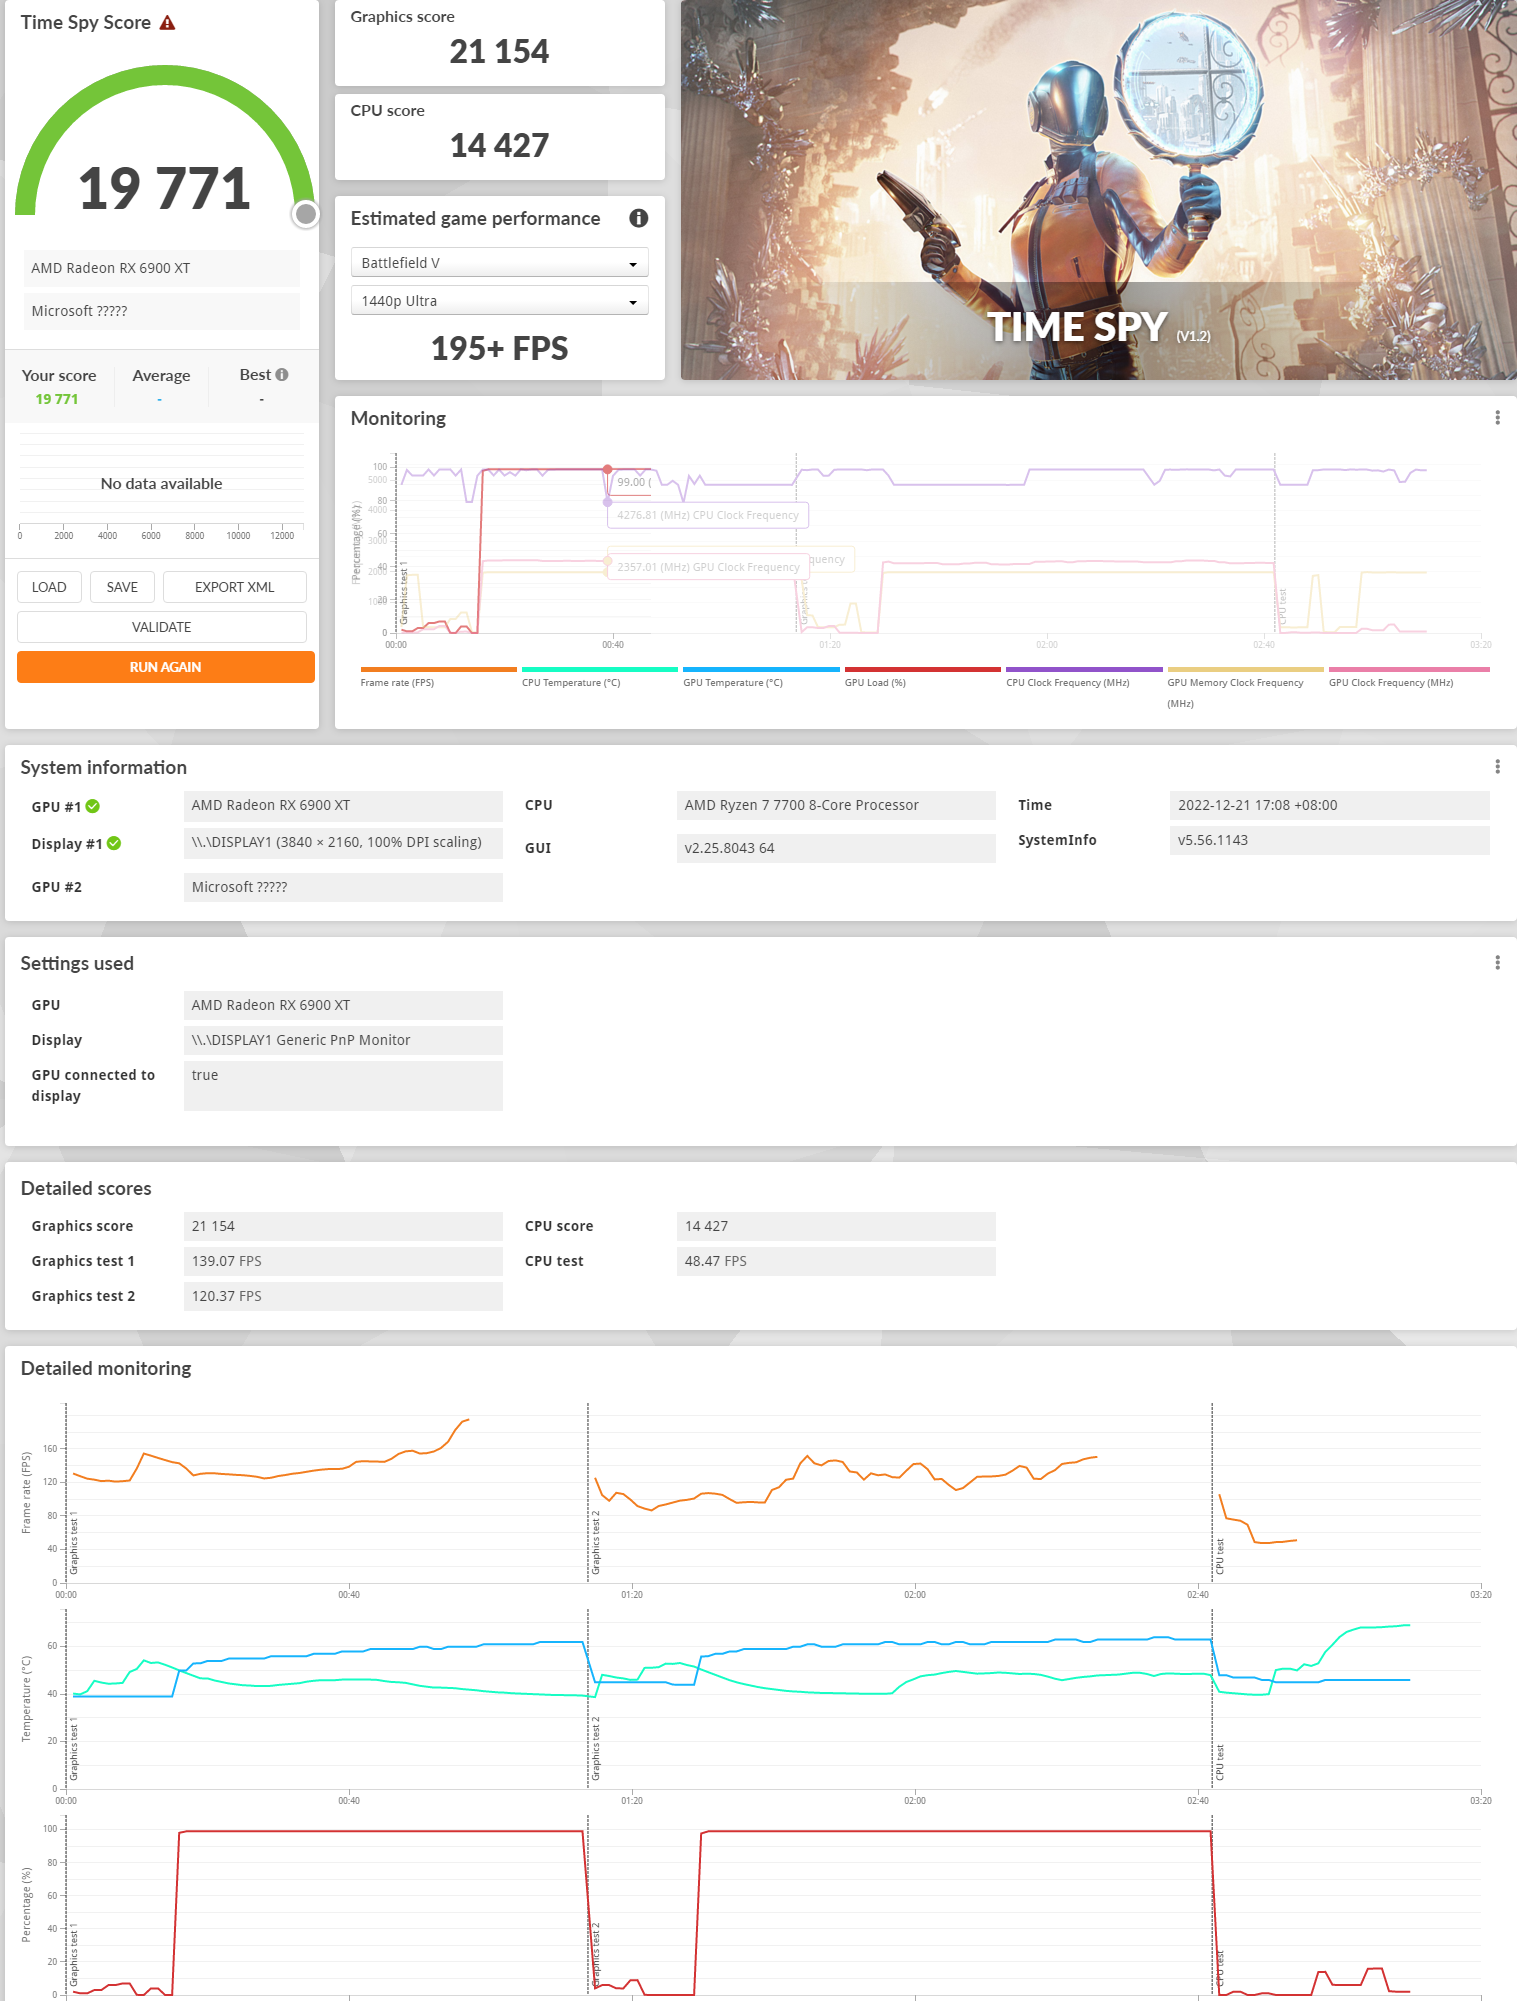
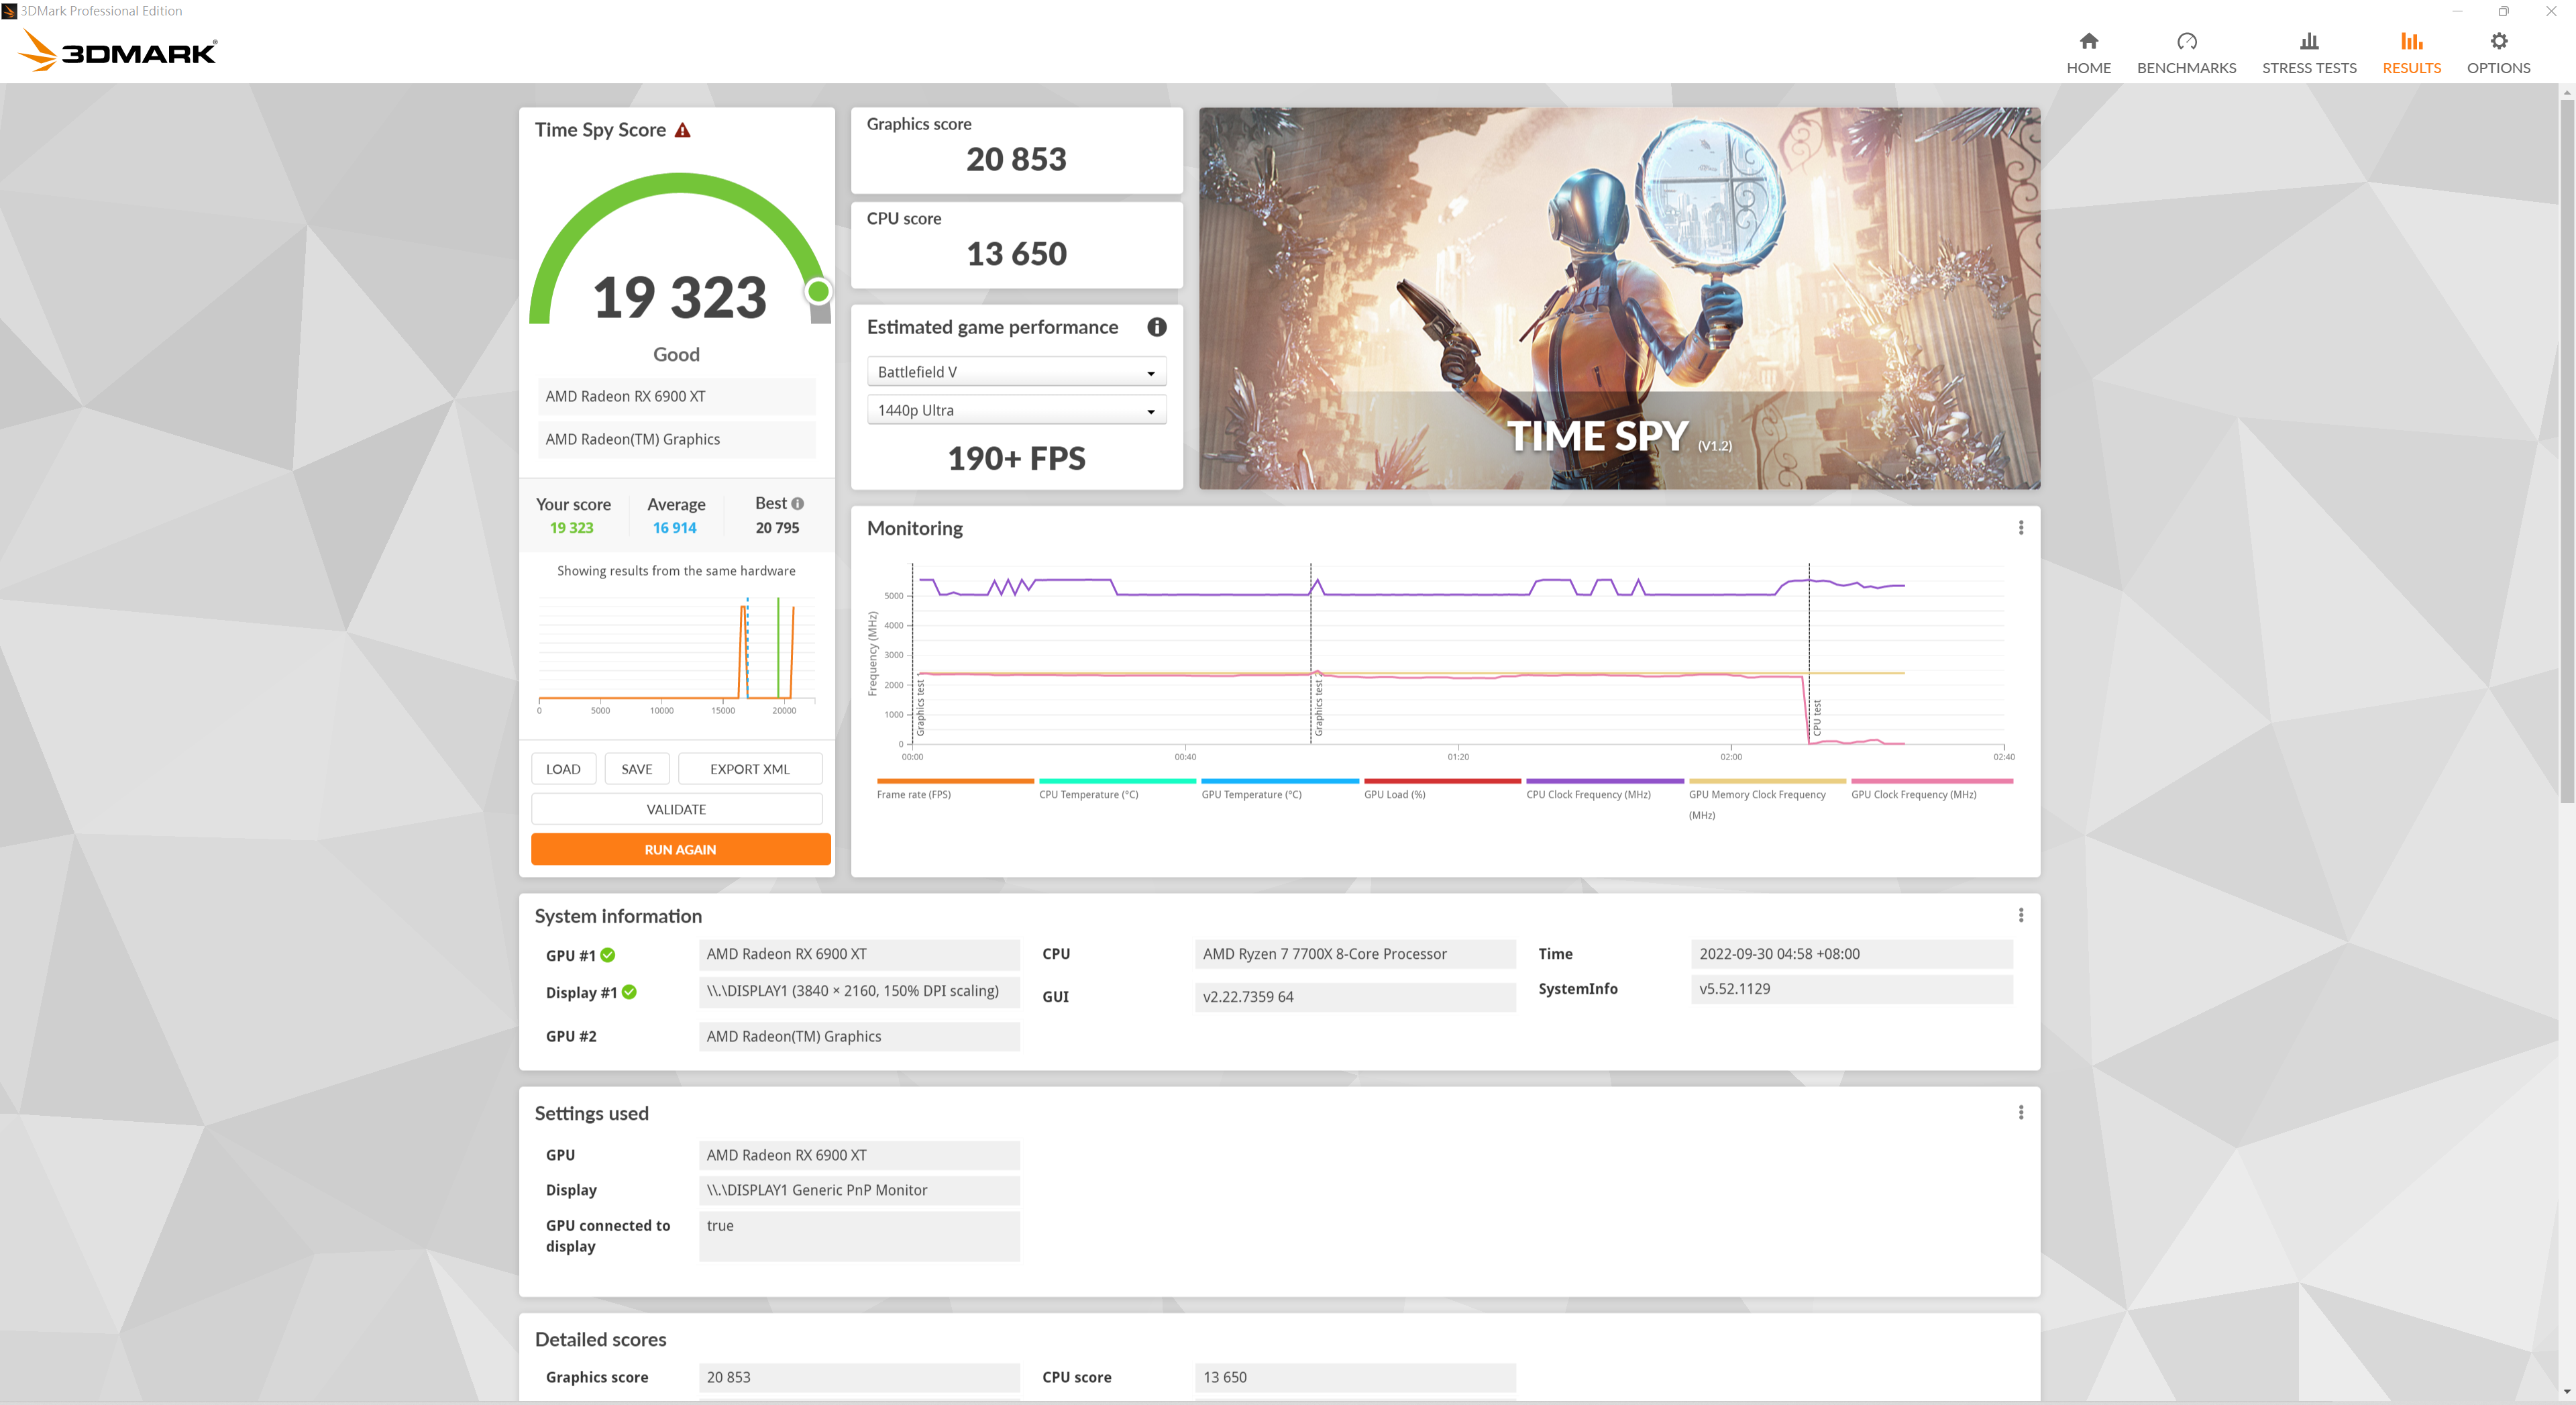
對照組
Ryzen 7 7700X 3DMark Time Spy:19323分
3DMark Time Spy Benchmark比較表

[/B]
⇧單位: Performance Score (數字愈大愈好)
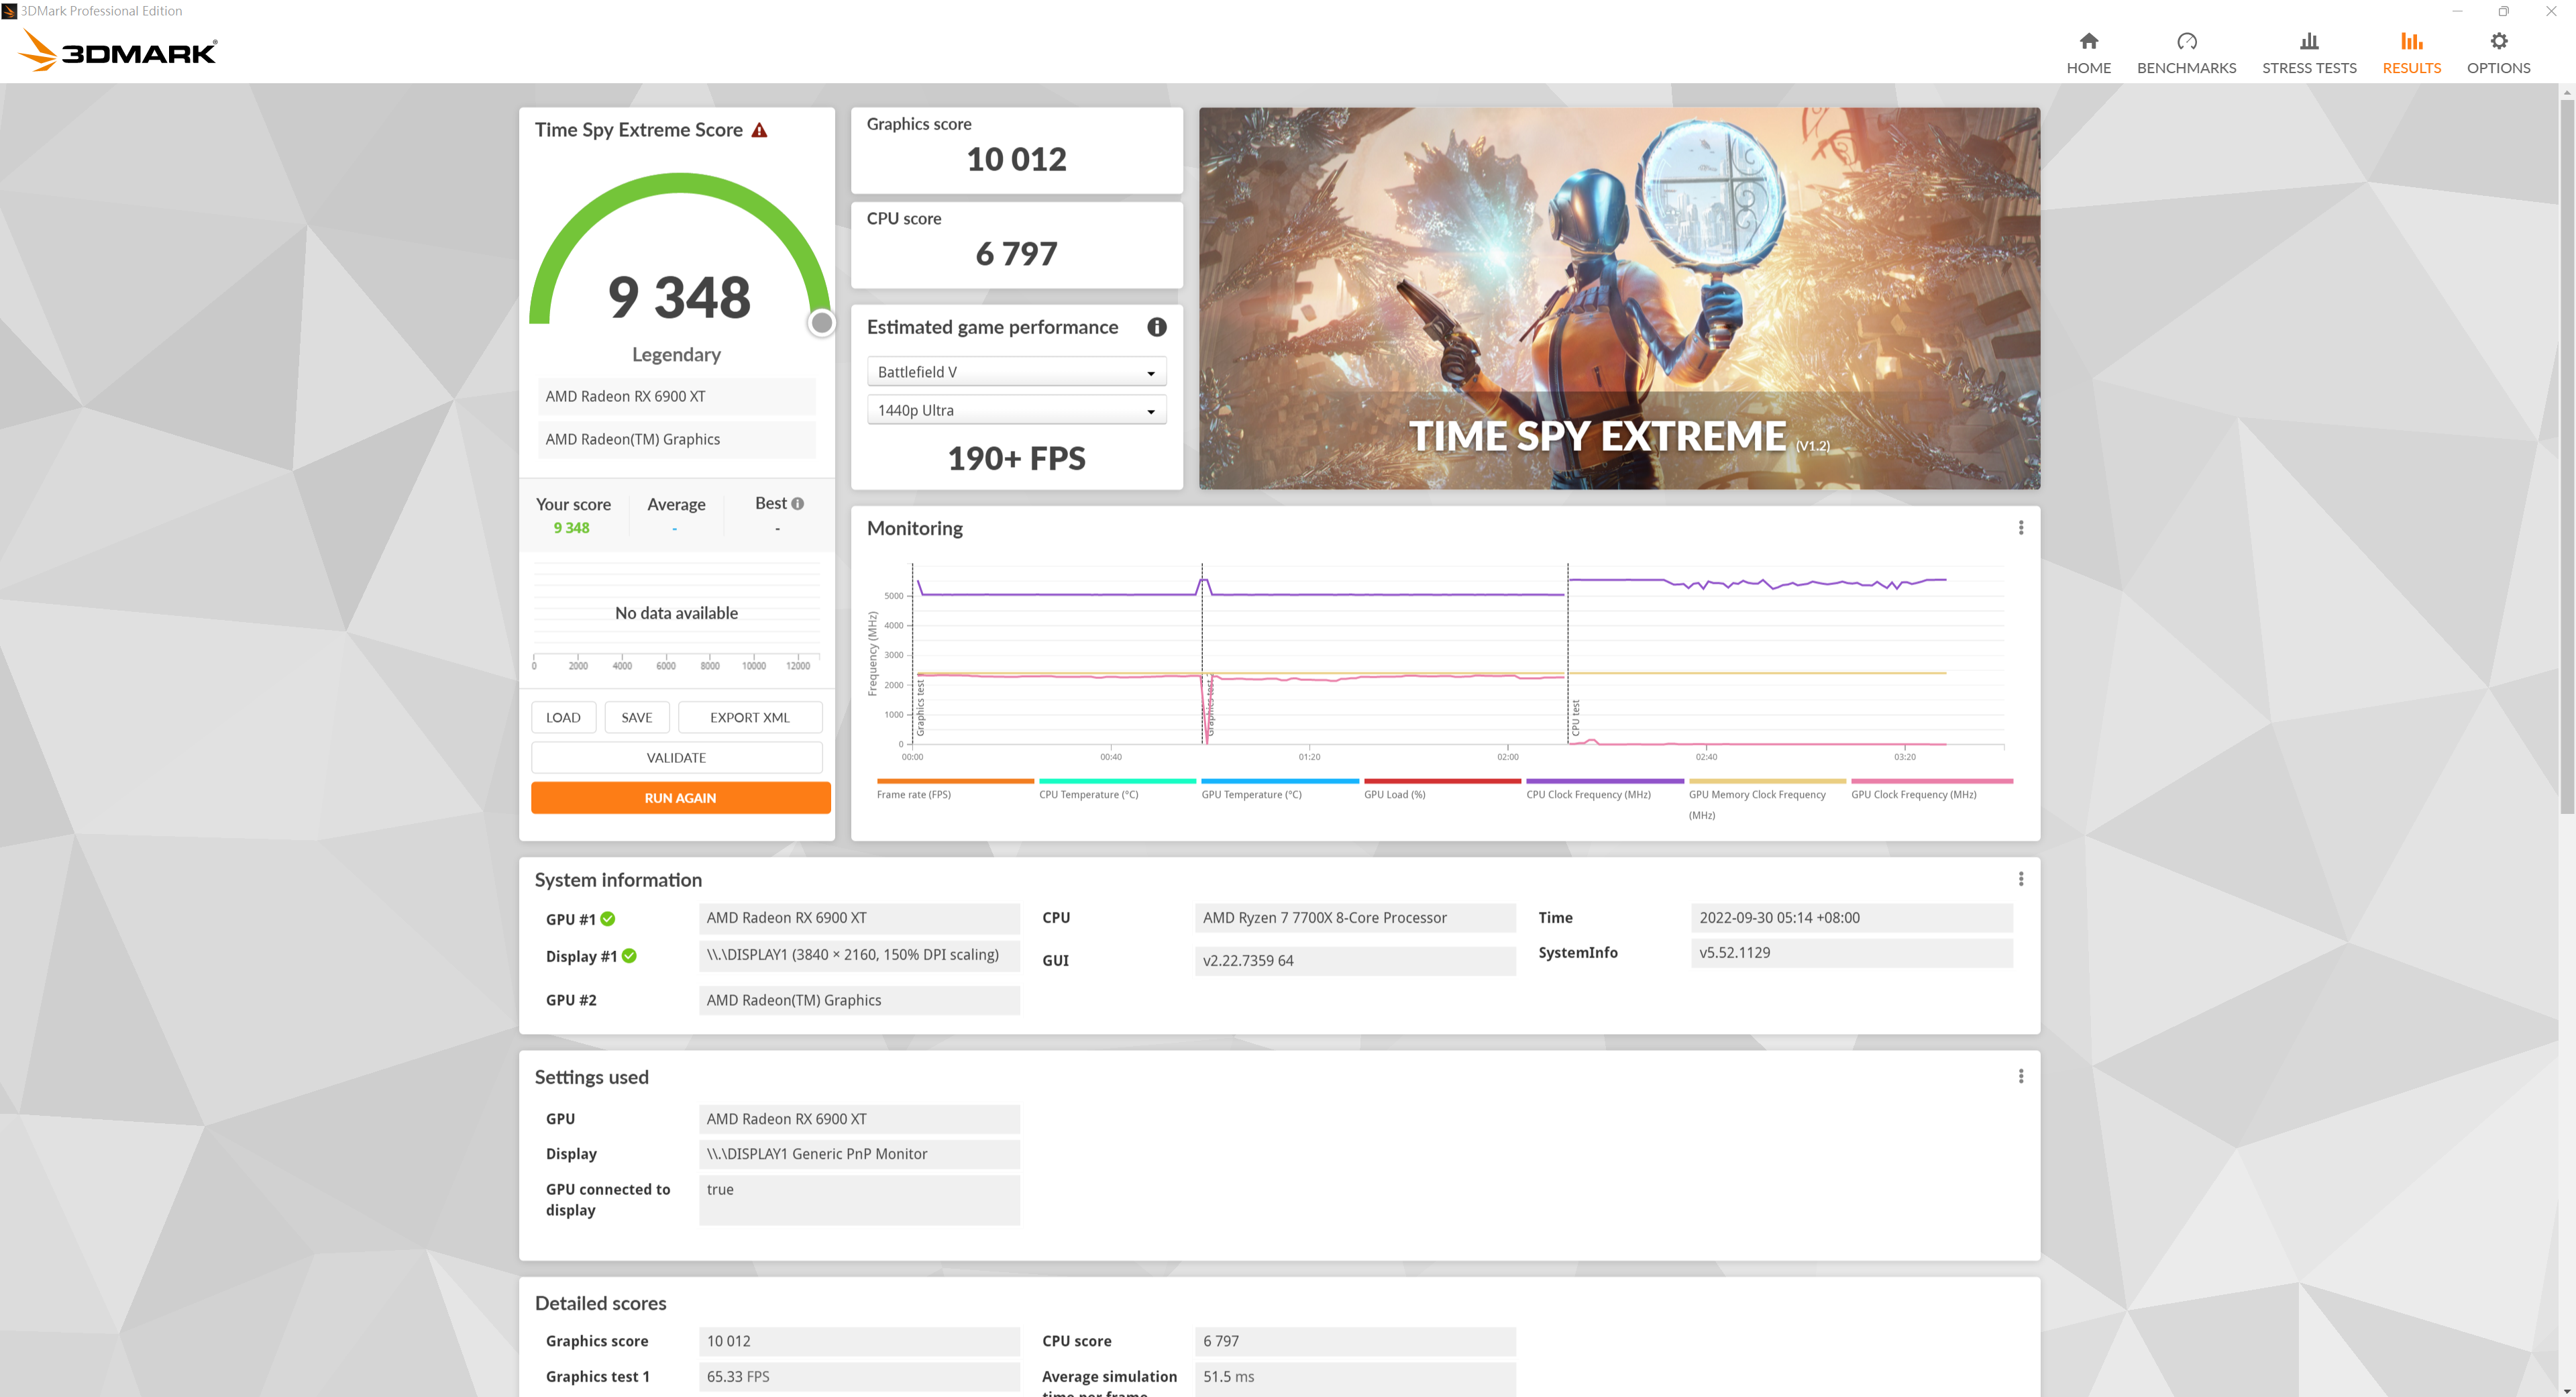
e.3DMark Time Spy Extreme
3DMark Time Spy Extreme Benchmark Results
Ryzen 7 7700 3DMark Time Spy Extreme:9385分
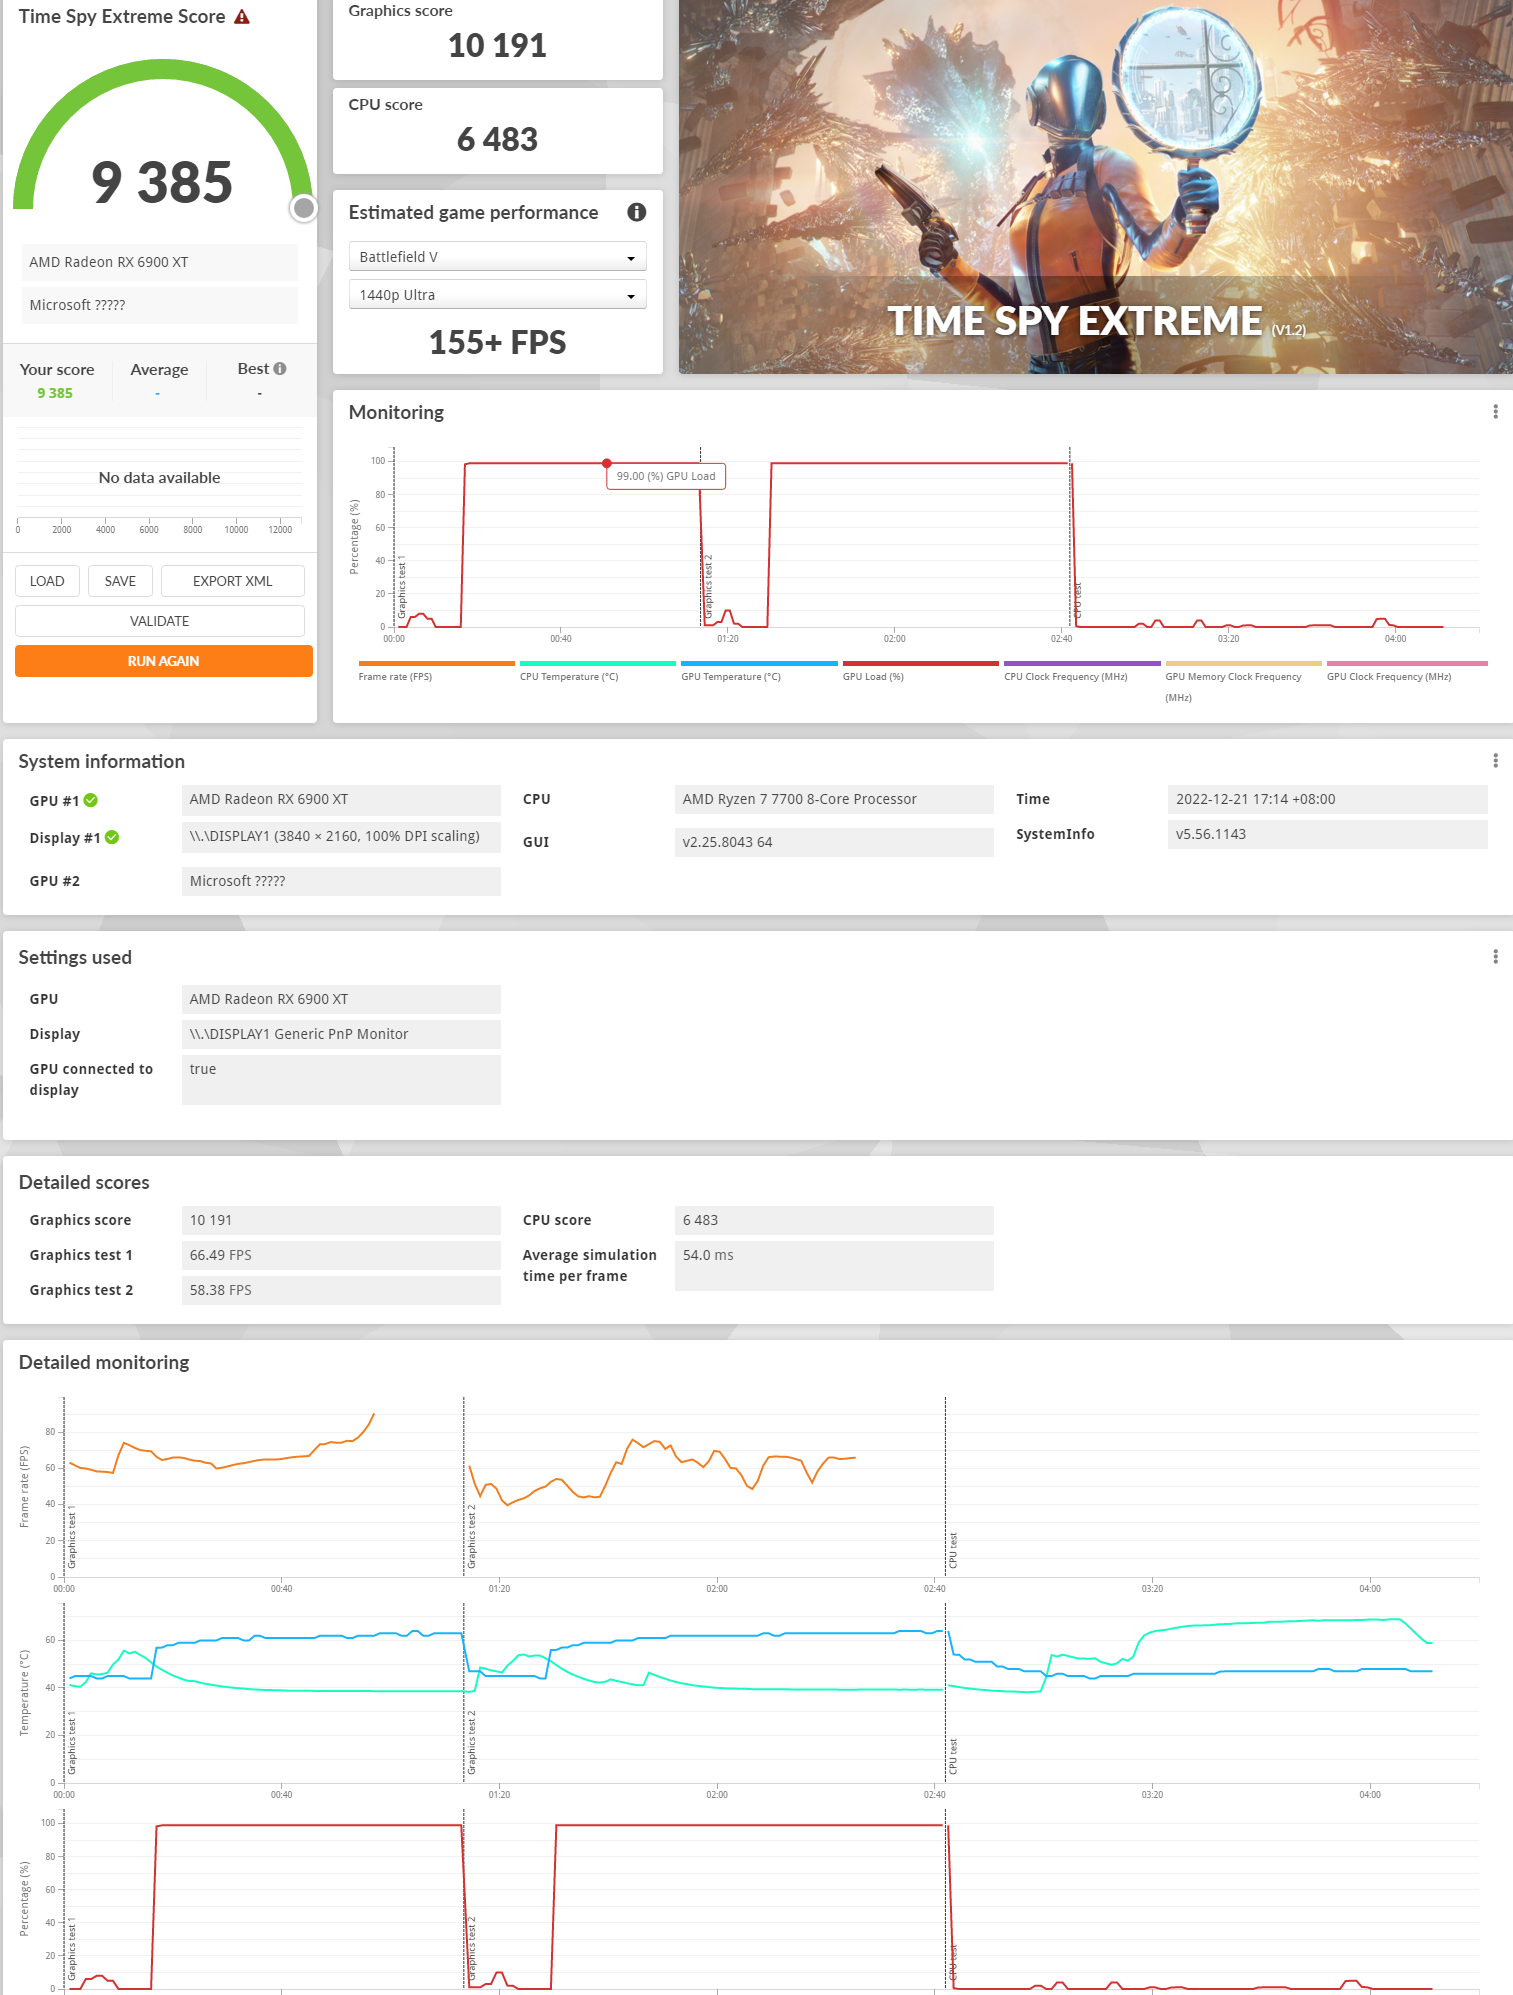
對照組
Ryzen 7 7700X 3DMark Time Spy Extreme:9348分
3DMark Time Spy Extreme Benchmark比較表

[/B]
⇧單位: Performance Score (數字愈大愈好)
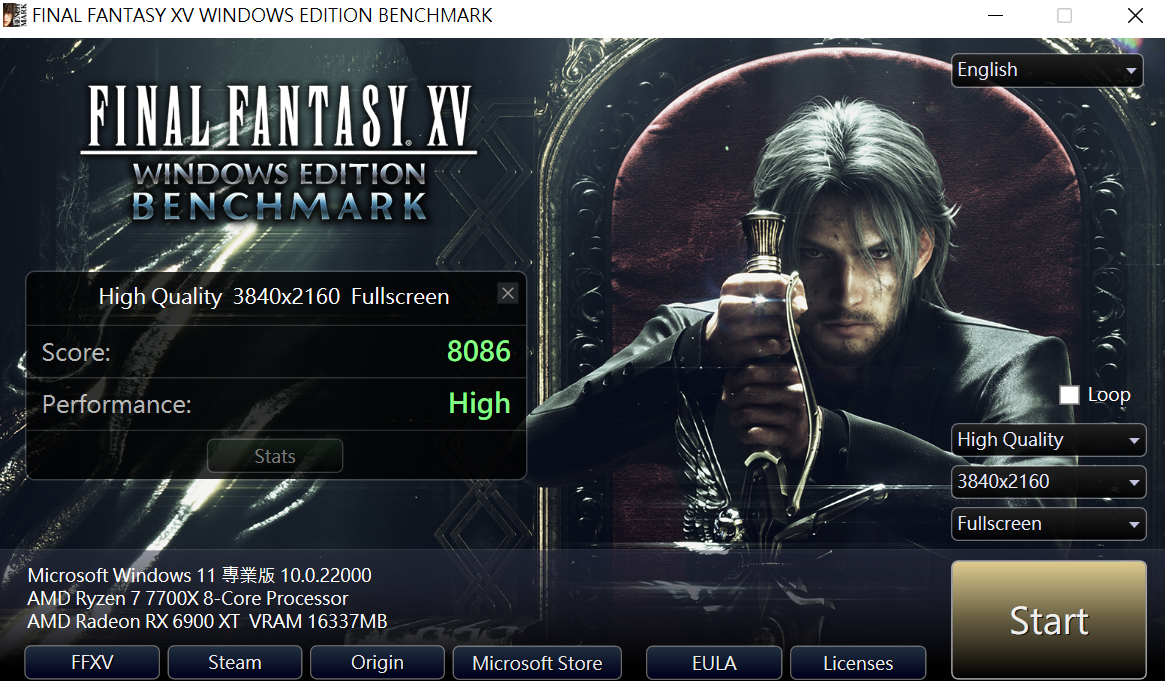
f.Final Fantasy XV Benchmark
Final Fantasy XV《太空戰士 15》的 Benchmark,是一款由史克威爾艾尼克斯在 2016年 11月推出的動作角色扮演遊戲《Final Fantasy系列》的第 15部,依照傳統,太空戰士都有 Benchmark的項目

Final Fantasy XV Benchmark 1080P Results
Ryzen 7 7700 1080P Final Fantasy XV Benchmark:18656分
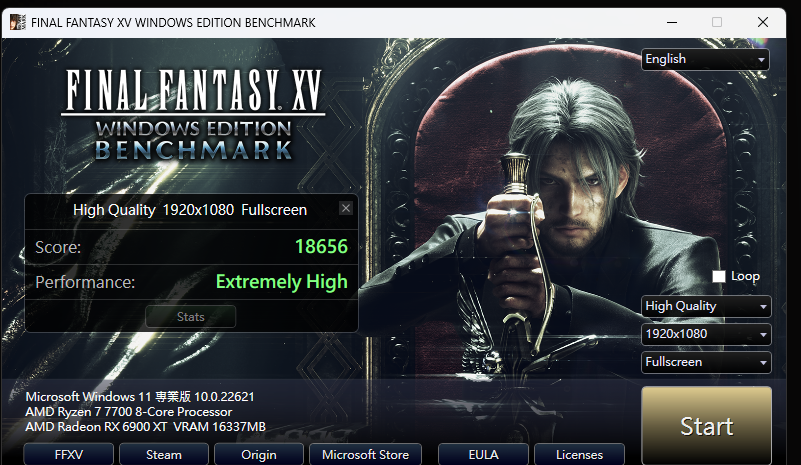
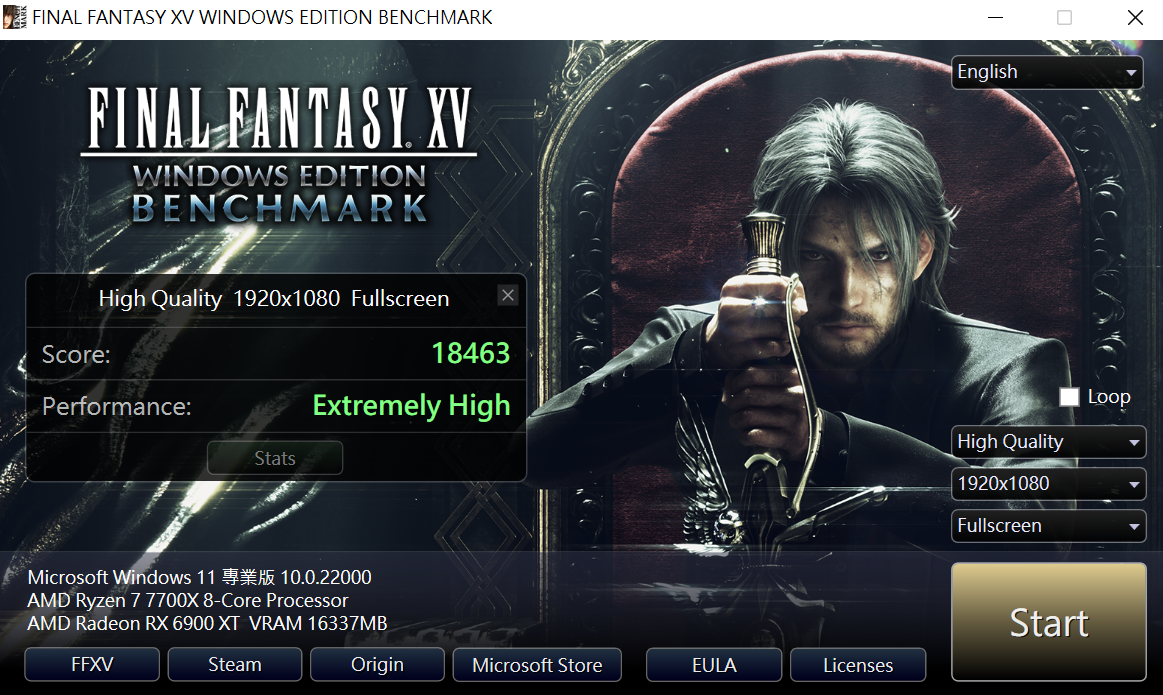
對照組
Ryzen 7 7700X 1080P Final Fantasy XV Benchmark:18463分
Final Fantasy XV Benchmark 4K Results[/B]
Ryzen 7 7700 4K Final Fantasy XV Benchmark:8238分
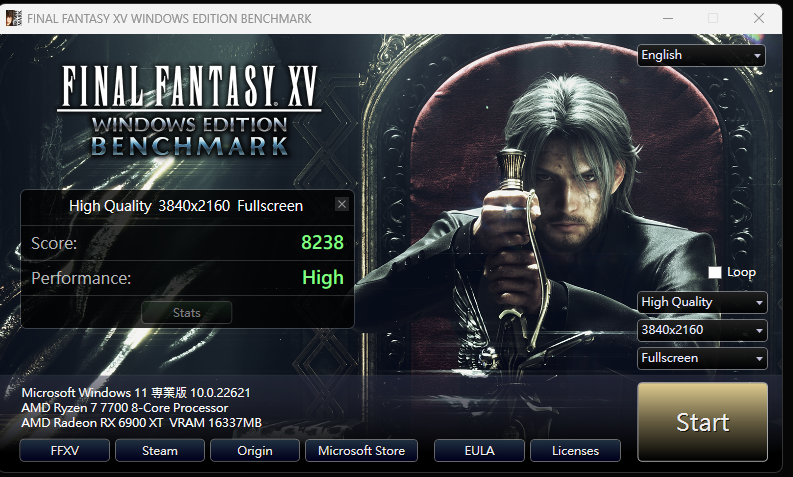
對照組
Ryzen 7 7700X 4K Final Fantasy XV Benchmark:8086分
Final Fantasy XV Benchmark比較表

[/B]
⇧單位: Performance Score (數字愈大愈好)
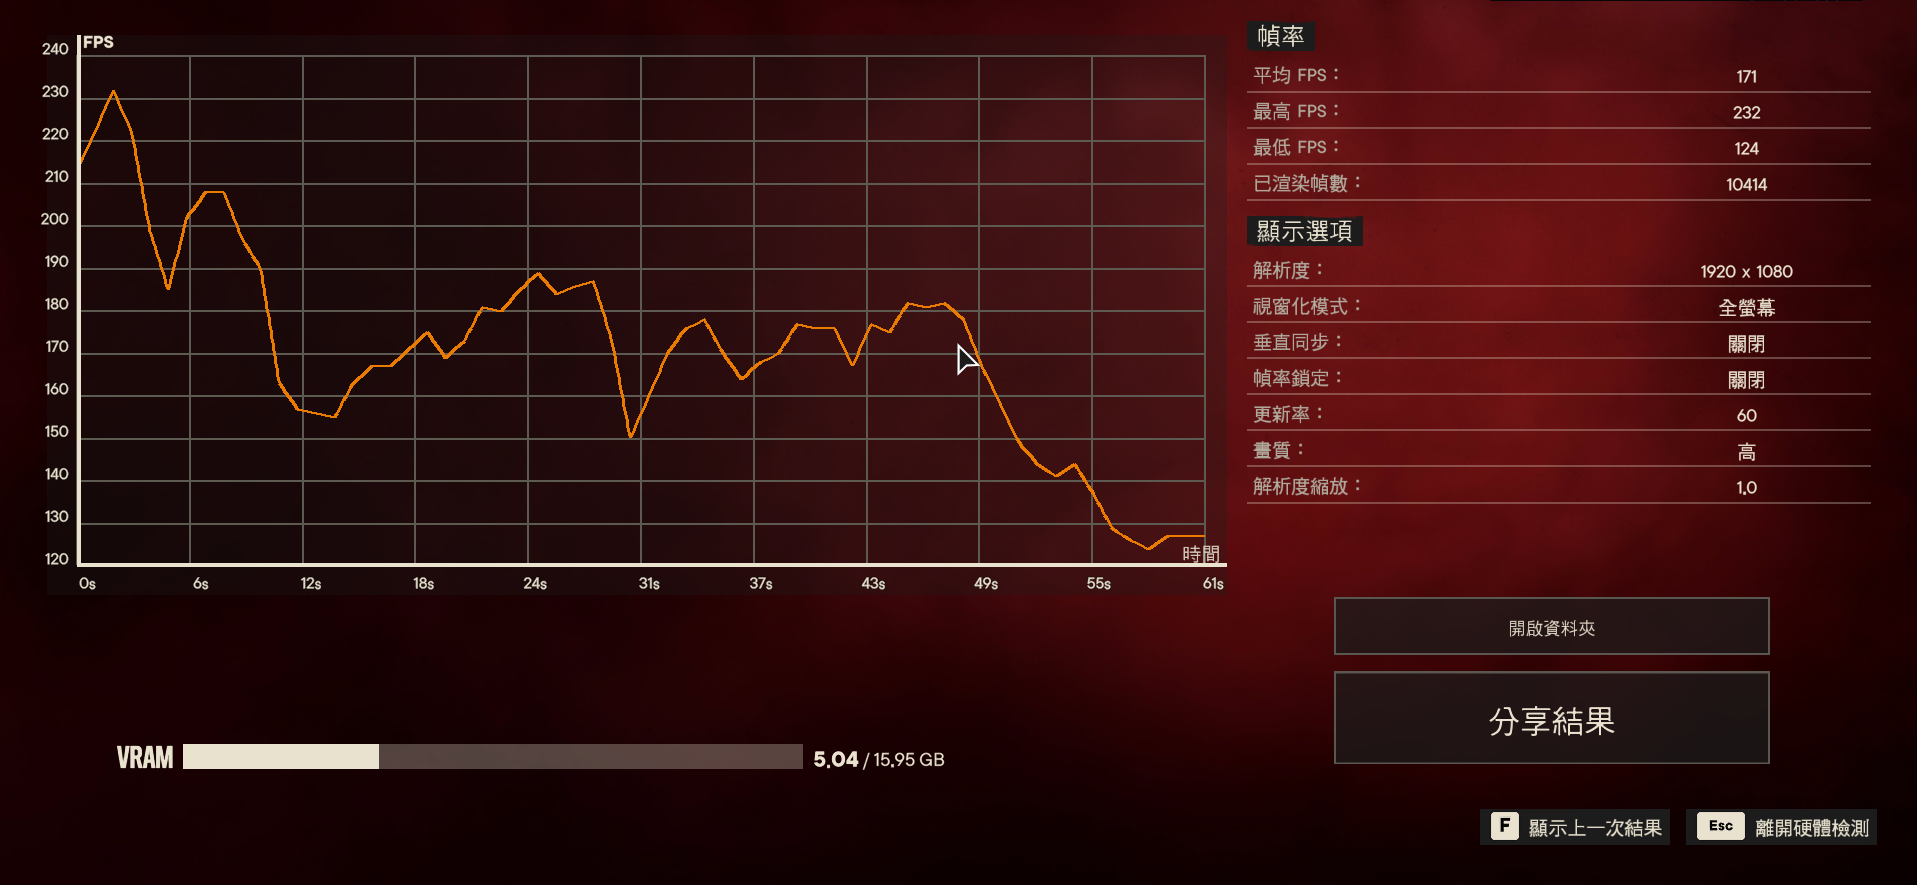
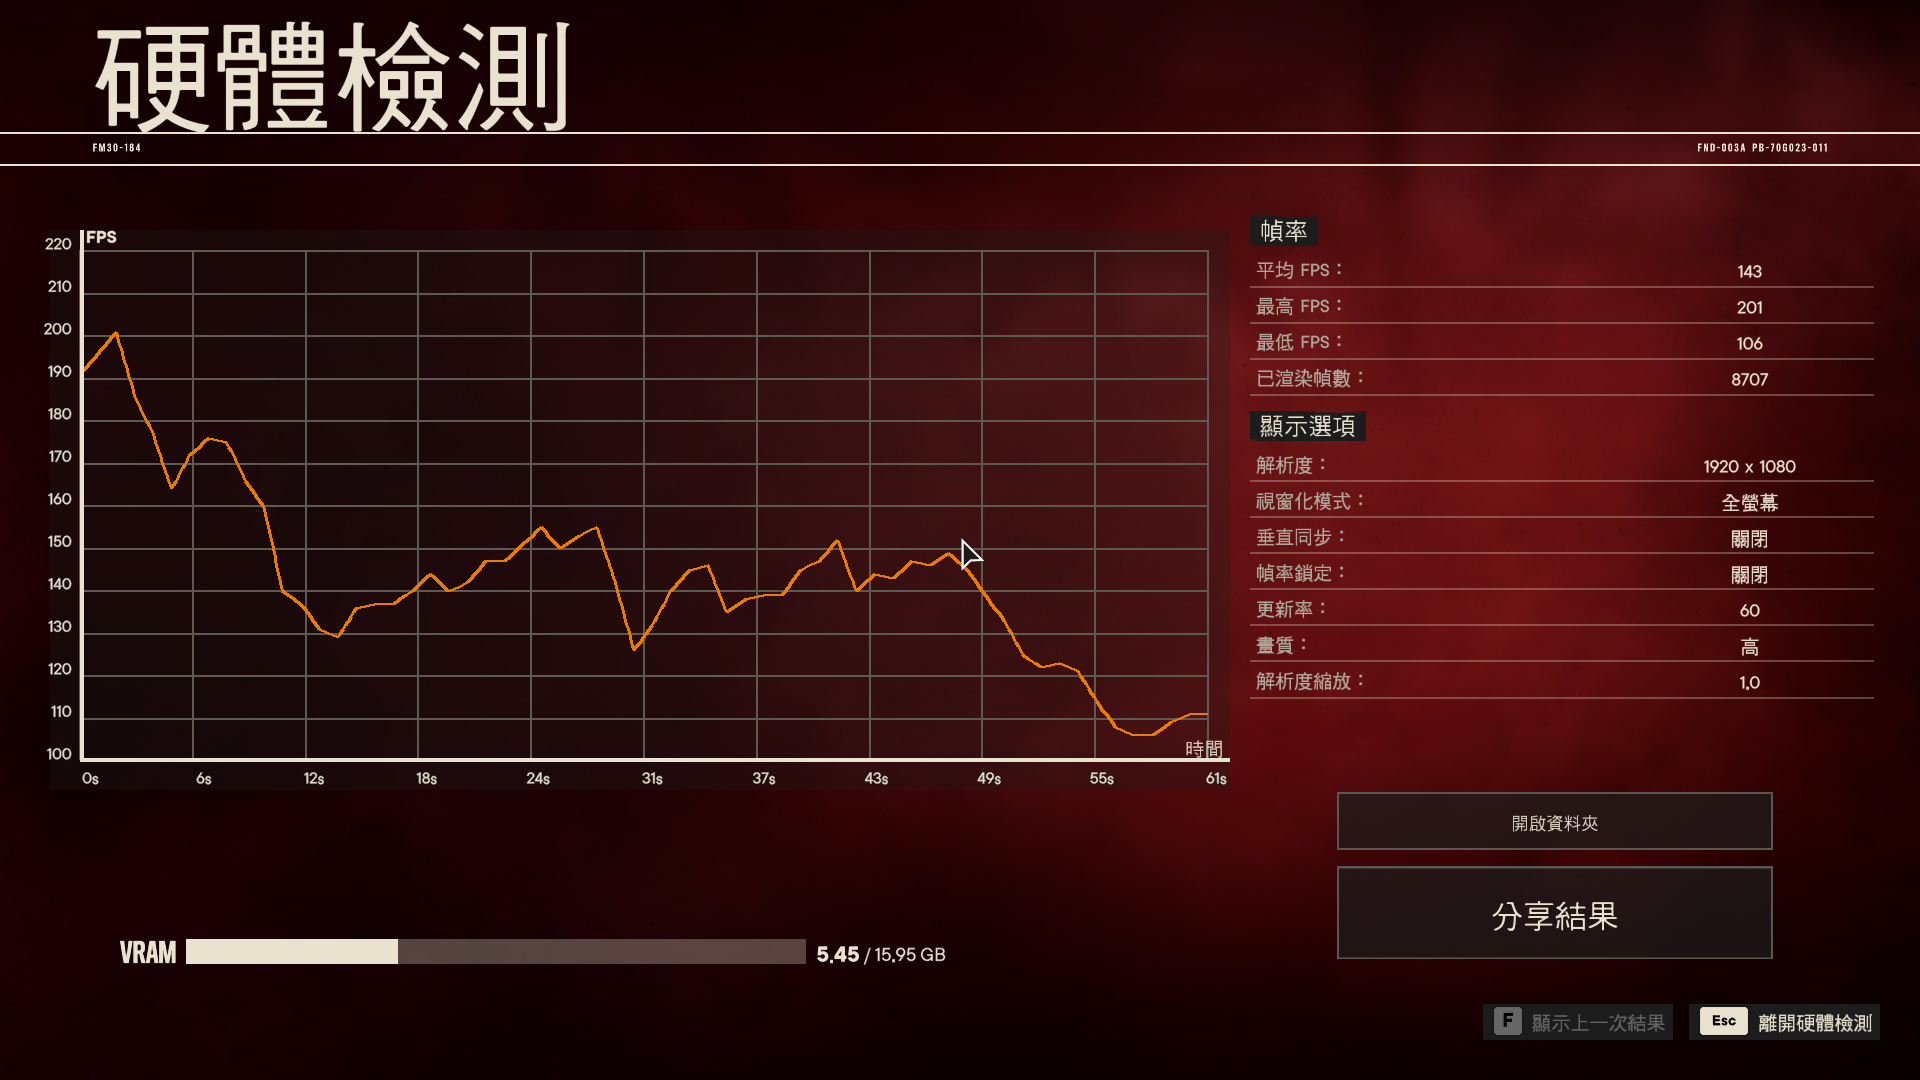
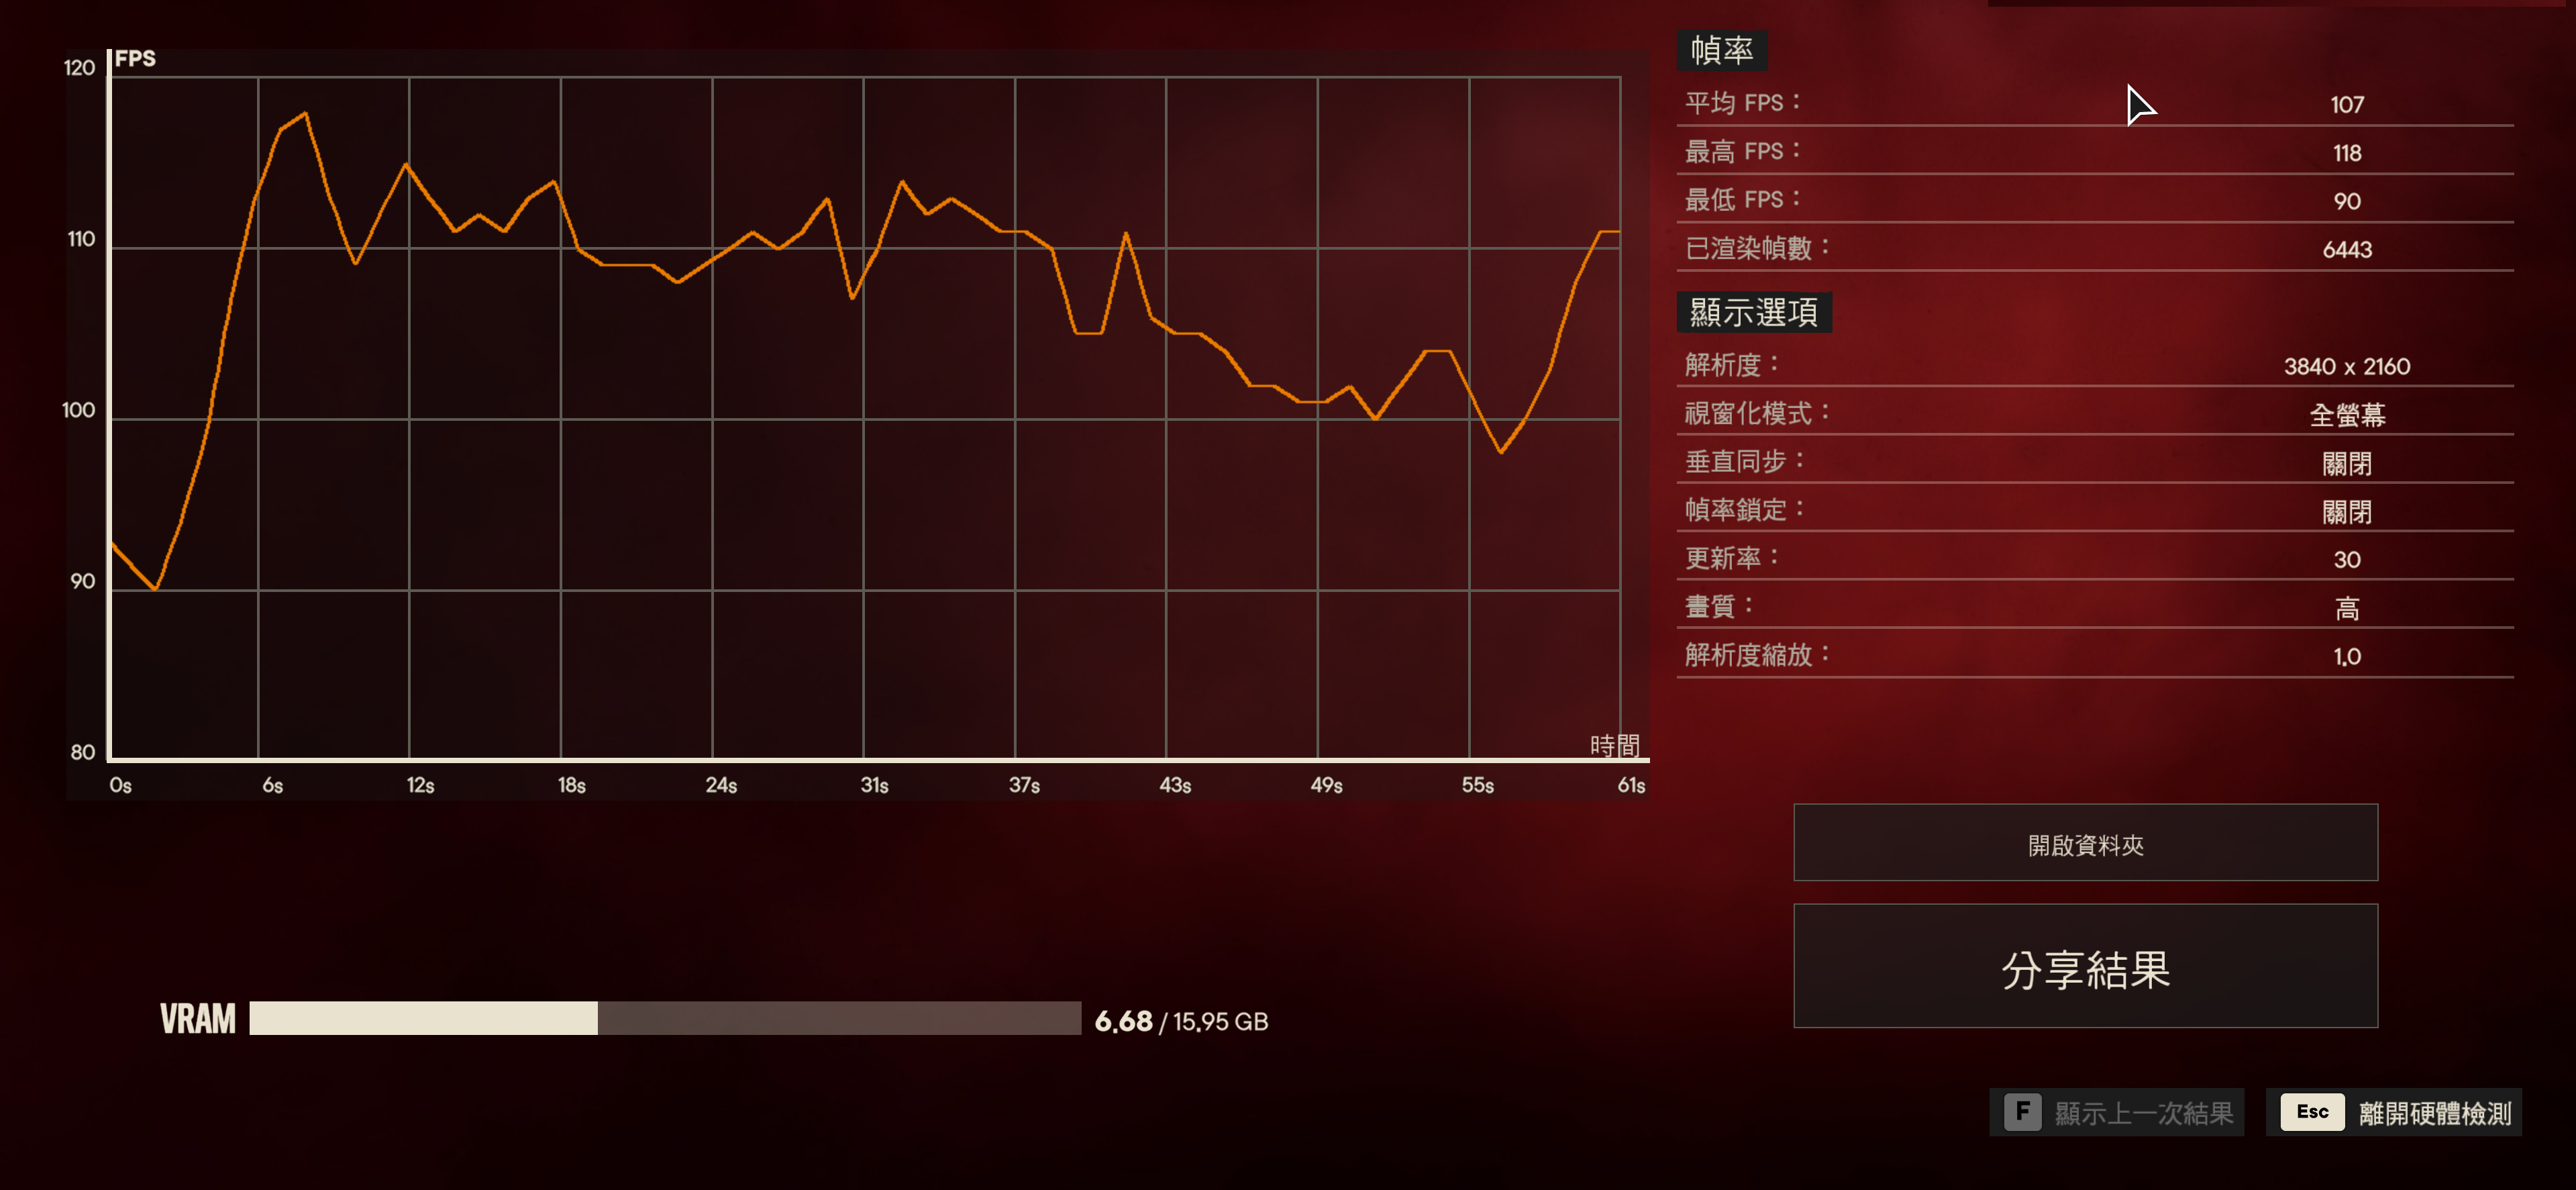
g.Far Cry 6《極地戰嚎6》
Far Cry 6《極地戰嚎6》(英語:Far Cry 6,中國大陸譯作「孤島驚魂6」)是一款由育碧多倫多開發並由育碧發行在 Amazon Luna、Microsoft Windows、PlayStation 4、PlayStation 5、Xbox One、Xbox Series X/S和 Google Stadia平台上的動作冒險第一人稱射擊遊戲,是極地戰嚎系列的第六部正統作品
《極地戰嚎6》支援 AMD FidelityFX Super Resolution (FSR)、AMD FreeSync Premium Pro,以及 AMD FidelityFX視覺工具套件,包括在未使用 FSR時的對比調適銳化(CAS)這項不受硬體限制的動態銳化濾鏡可改善低對比畫面區域的細節,提高影像清晰度並針對因後製而導致柔化的影像進行銳化處理,確保在激烈對戰時視線不會被阻擋

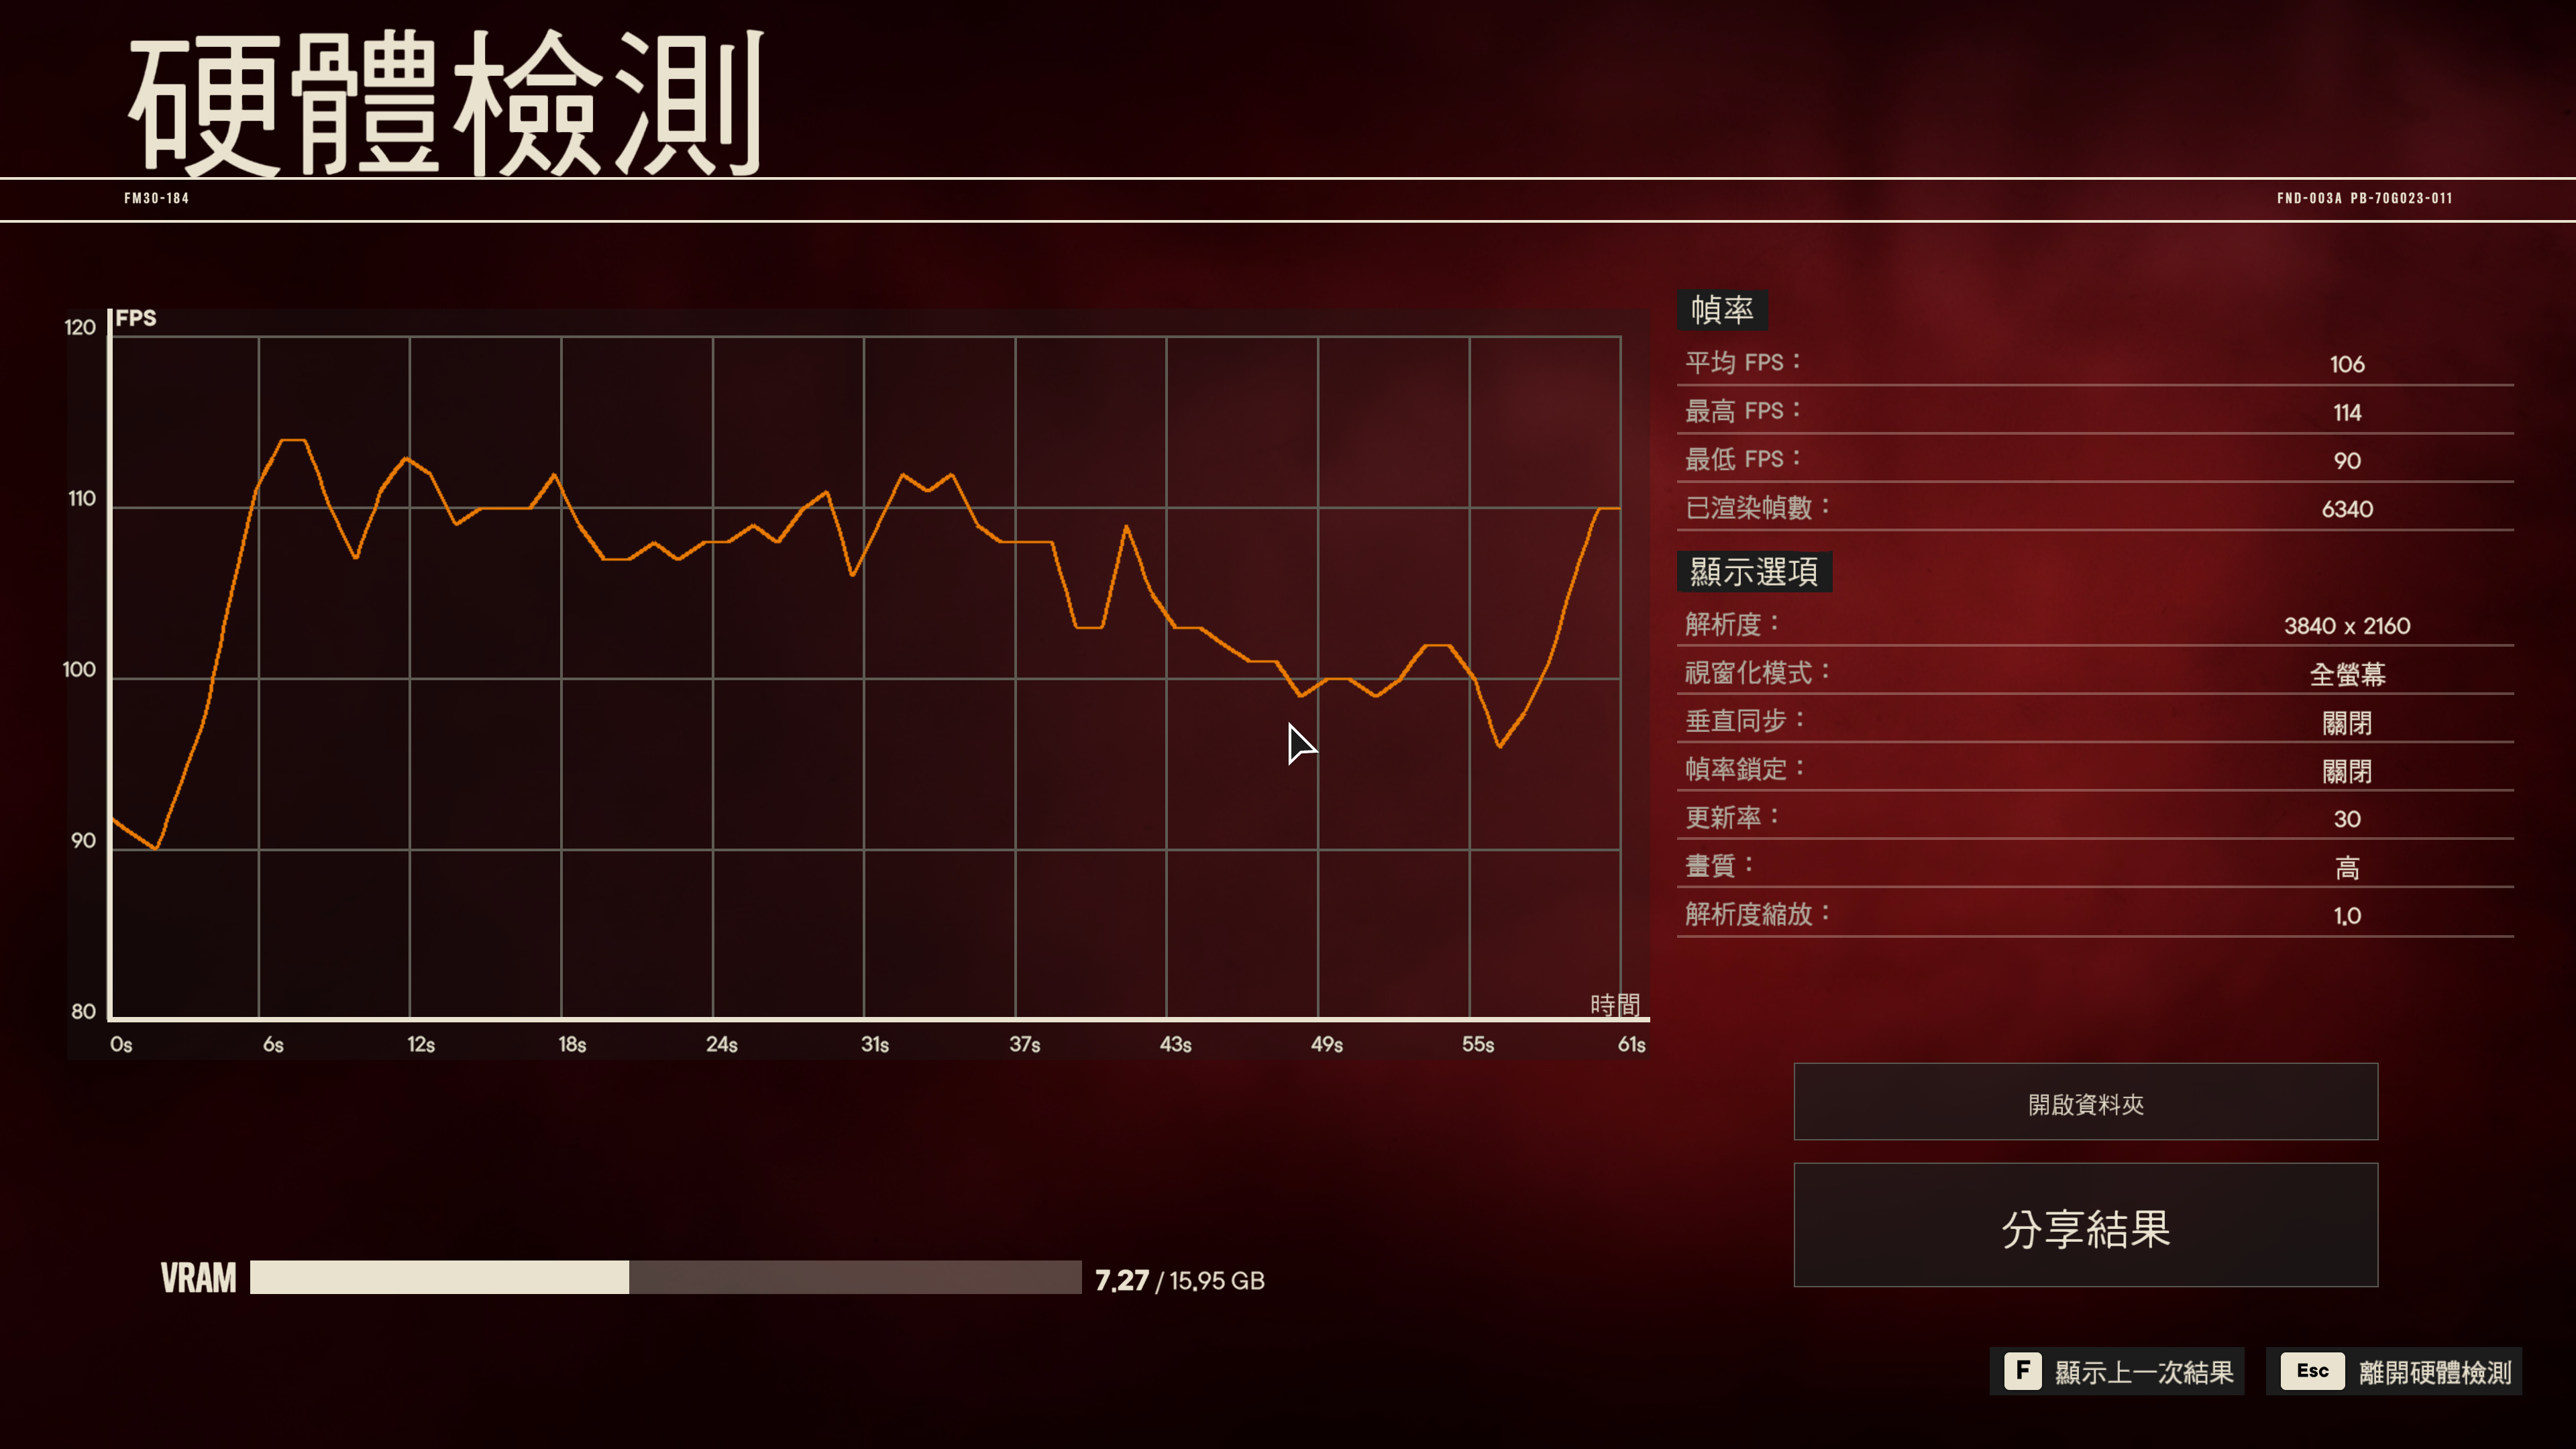
畫質設定:高

Far Cry 6 1080P Results
Ryzen 7 7700 Far Cry 6 1080P Result 171fps
對照組
Ryzen 7 7700X Far Cry 6 1080P Result 143fps
Far Cry 6 4K Results [/B]
Ryzen 7 7700 Far Cry 6 4K Result 107fps
對照組
Ryzen 7 7700X Far Cry 6 4K Result 106fps
Far Cry 6 Benchmark Benchmark測試比較表[/B]
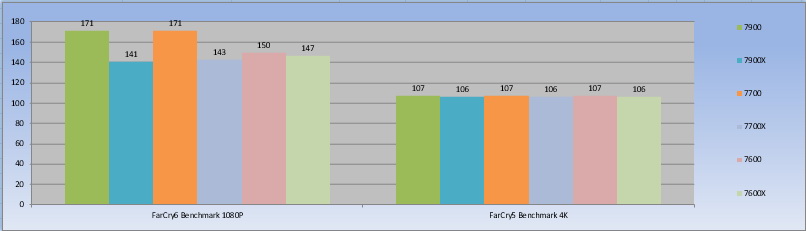
⇧單位:fps數字愈大愈好, 元/fps數字愈小愈好
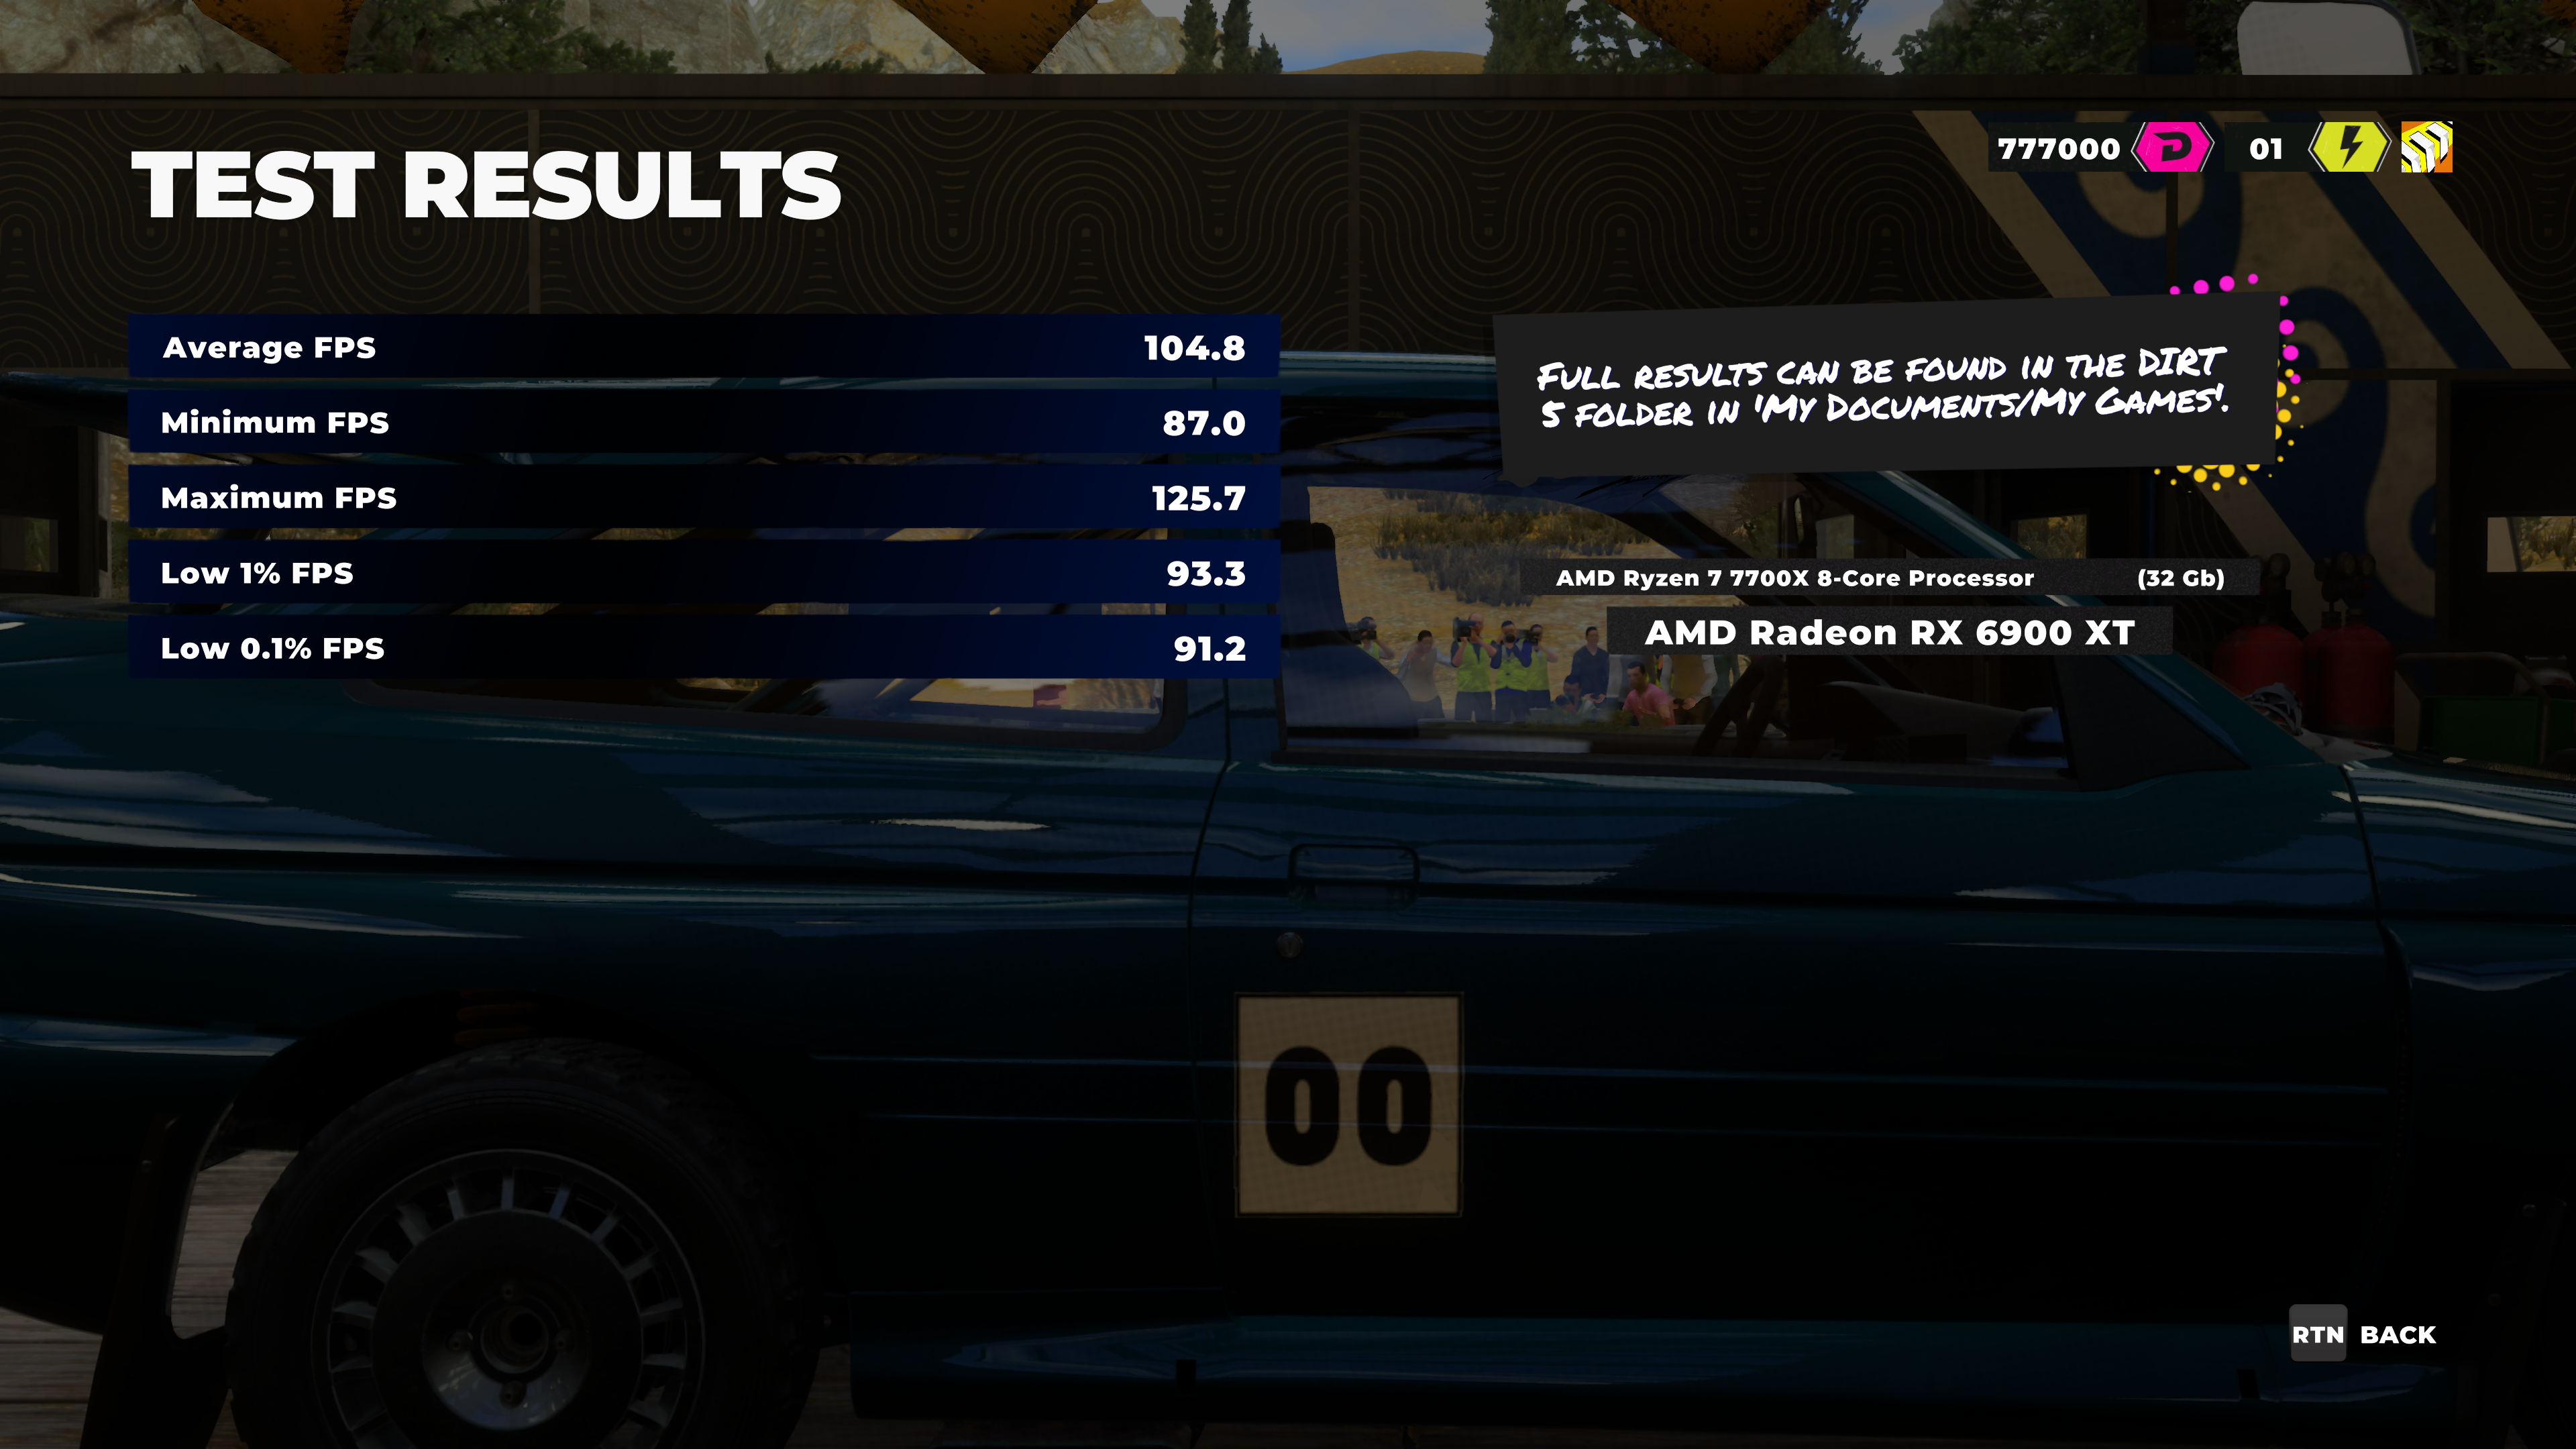
h.《 DIRT 5 》《大地長征 5》
《 DIRT 5 》《大地長征 5》是一款專注於越野賽車的賽車遊戲。遊戲中的紀律包括拉力賽,冰上賽車,體育場超級卡車和越野車。玩家可以在亞利桑那州,巴西,摩洛哥,中國,意大利,紐約市和挪威等眾多地區的比賽項目中比賽。遊戲包含動態天氣系統和季節,影響賽車;例如,玩家只能在冬季參加紐約的冰上比賽。遊戲中還引入了四人分屏系統
《 DIRT 5 》還具有敘述性的職業生涯模式,在一系列錦標賽中,玩家角色與競爭對手布魯諾·杜蘭德(Blano Durand)(由諾蘭·諾斯(Nolan North)表達)相對。玩家還有一位名為 Alex“ AJ”Janiček的導師(由 Troy Baker講),在整個職業生涯中為他們提供建議。

DIRT 5 1080P Results
Ryzen 7 7700 1080P Results:198.4fps
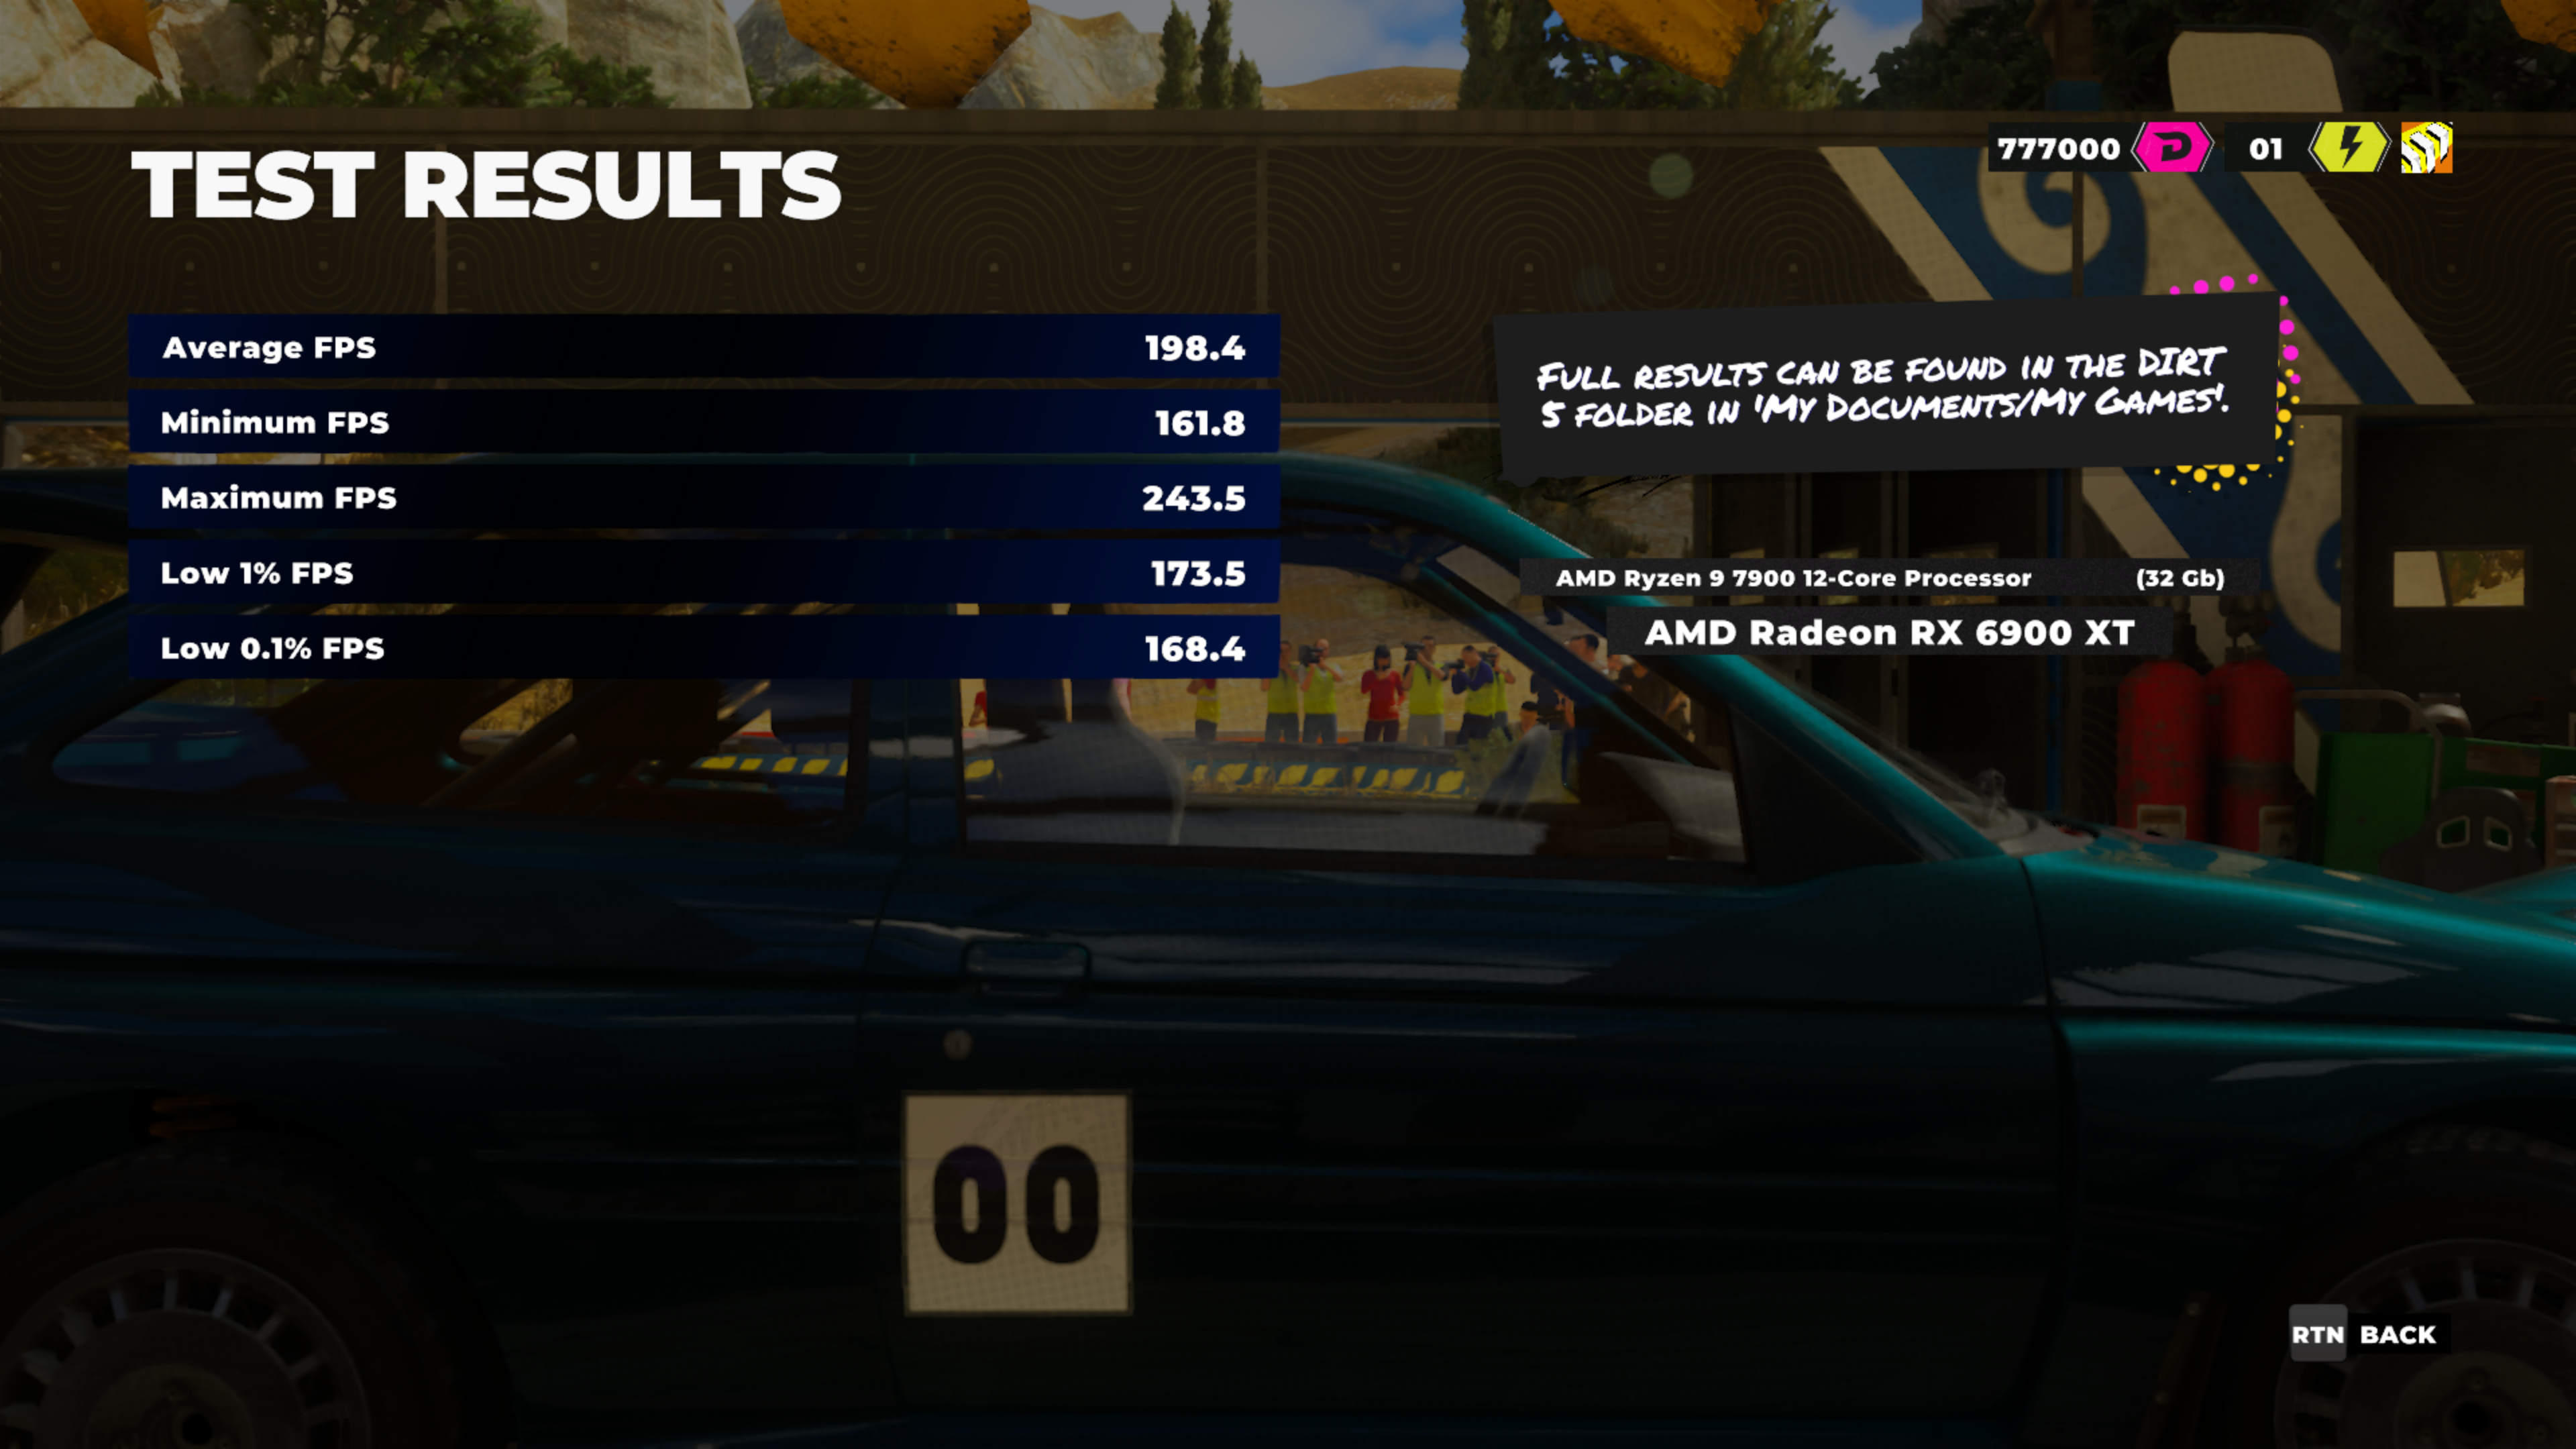
對照組
Ryzen 7 7700X 1080P Results:187.5fps
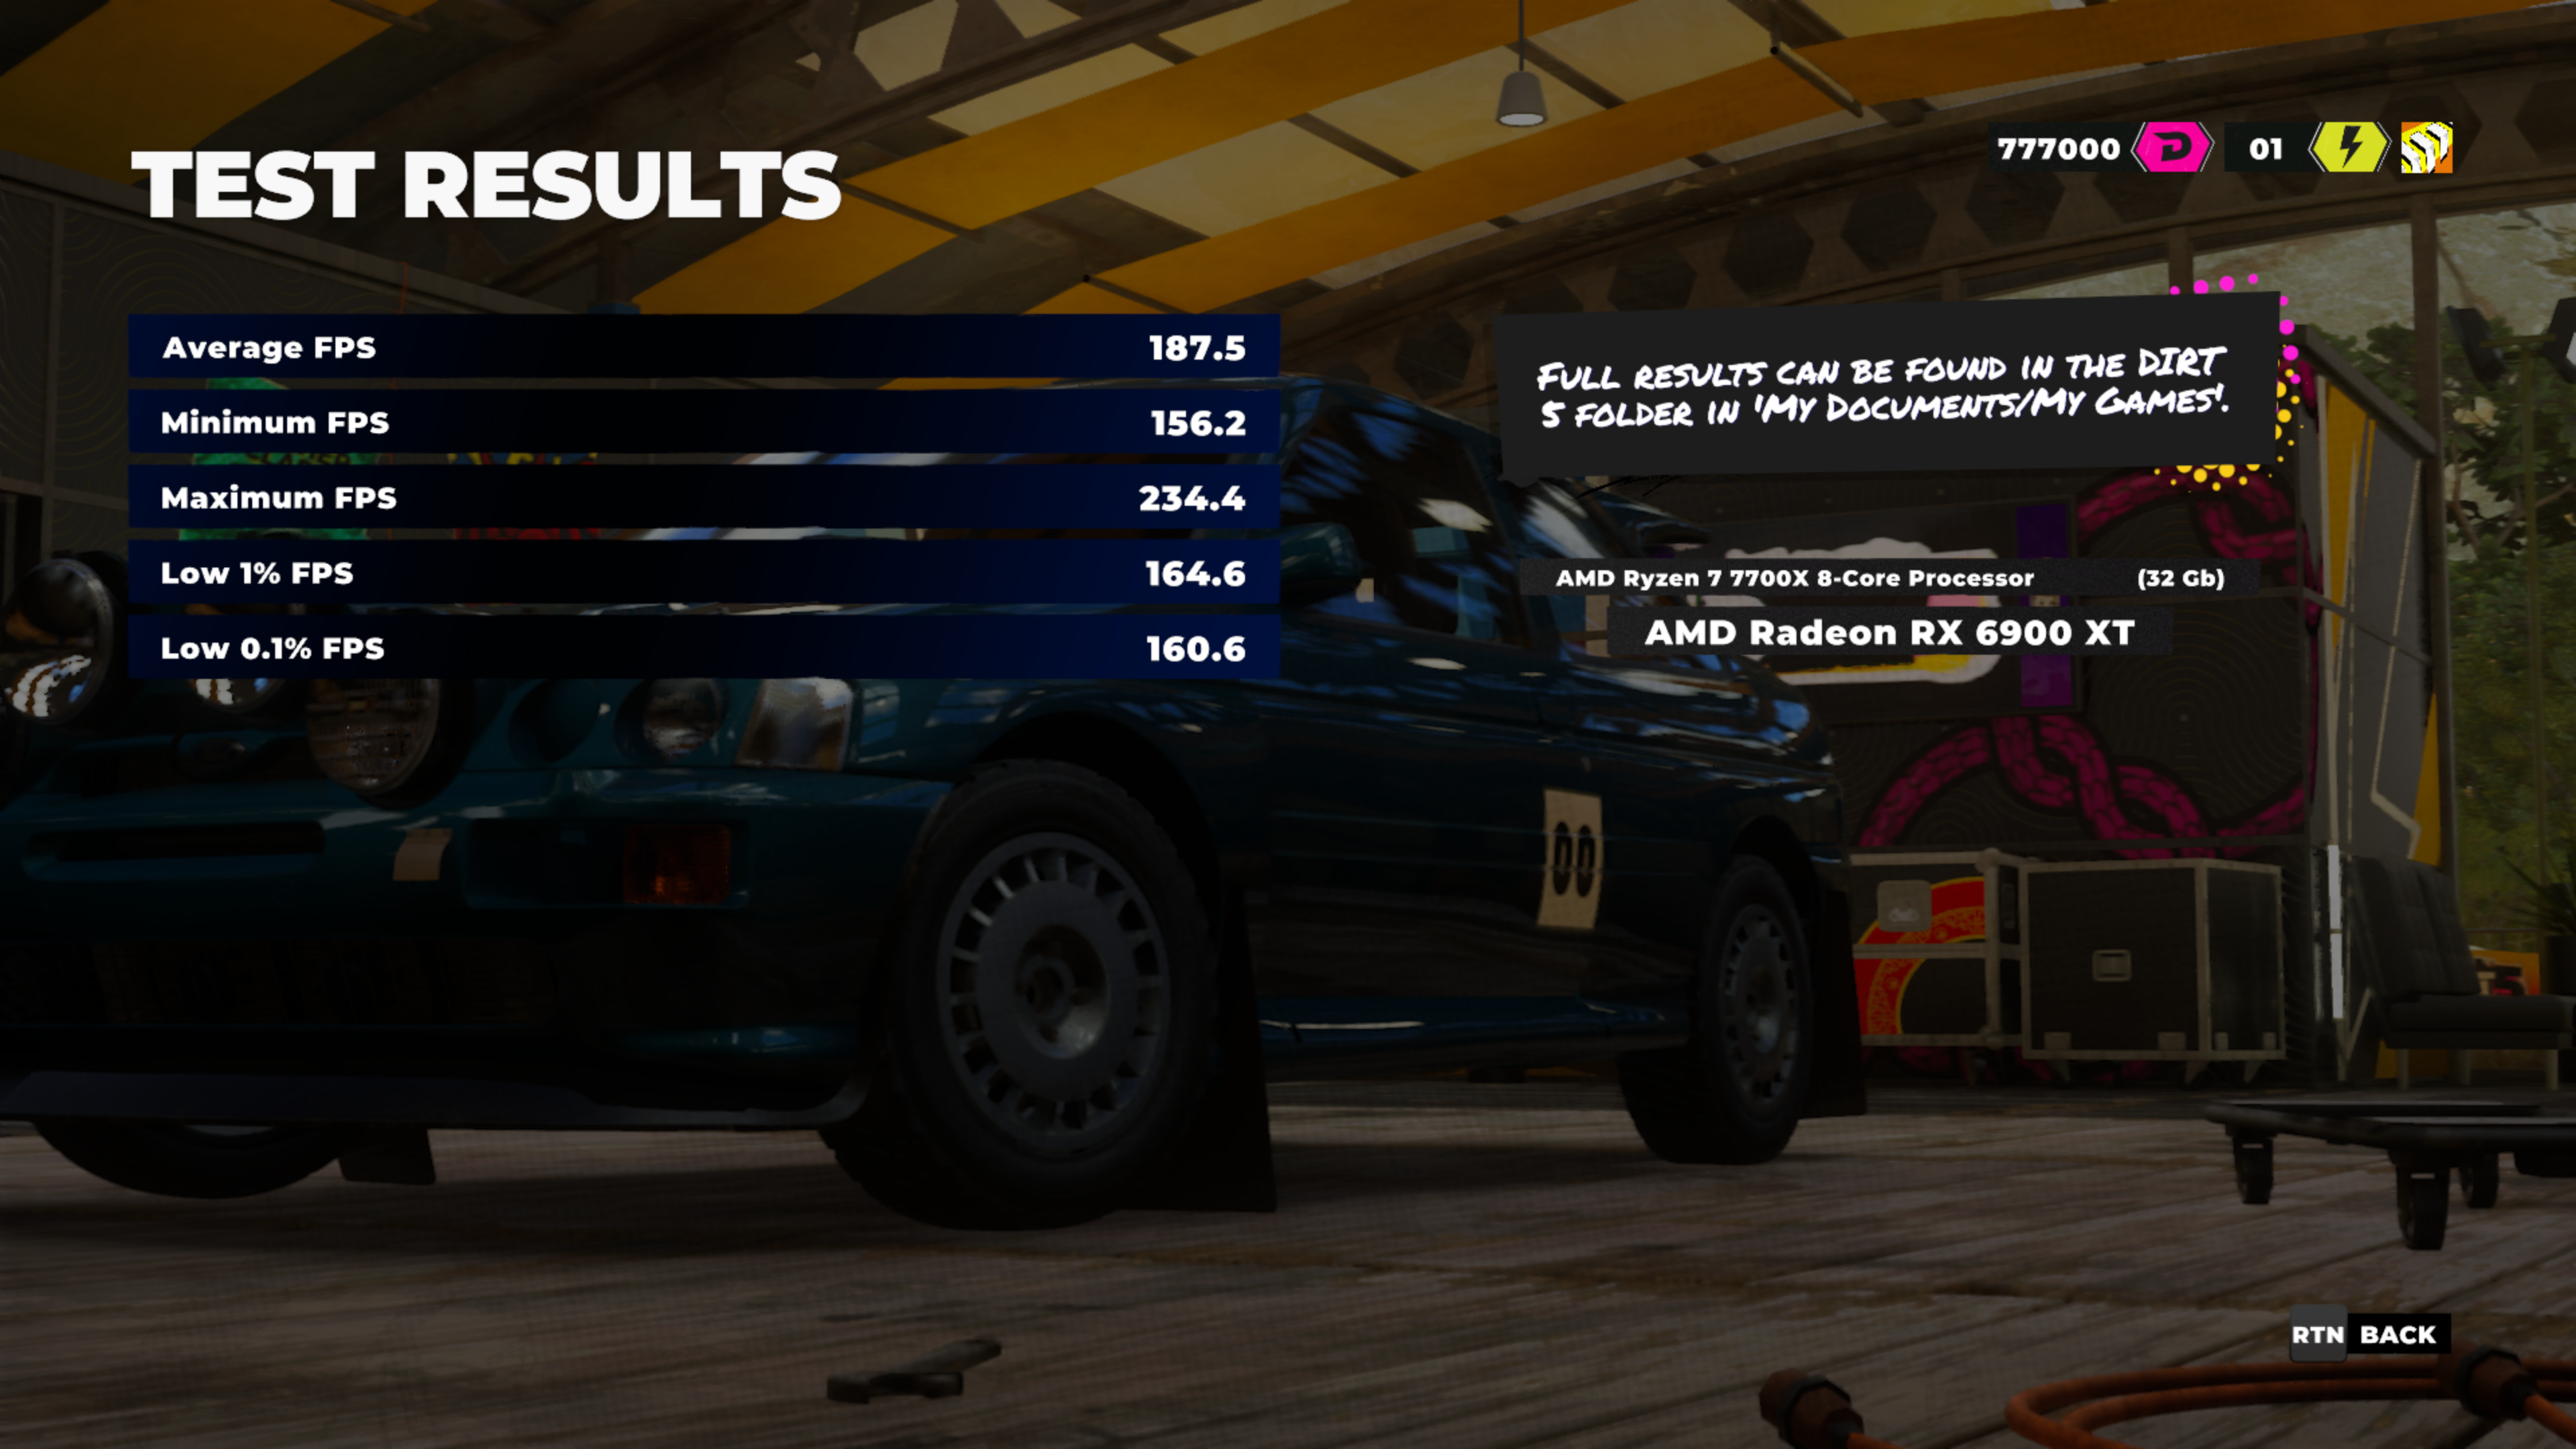
DIRT 5 4K Results
Ryzen 7 7700 4K Results:104.8fps
對照組
Ryzen 7 7700X 4K Results:104.8fps
DIRT 5 Benchmark測試比較表
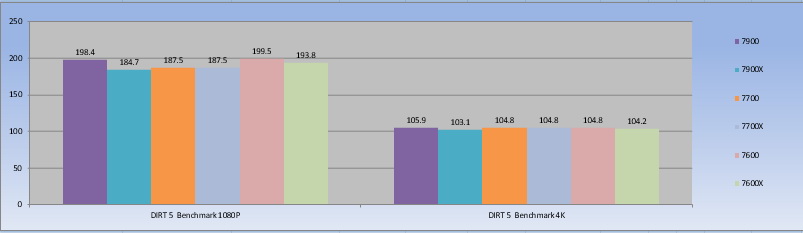
⇧單位:fps數字愈大愈好, 元/fps數字愈小愈好
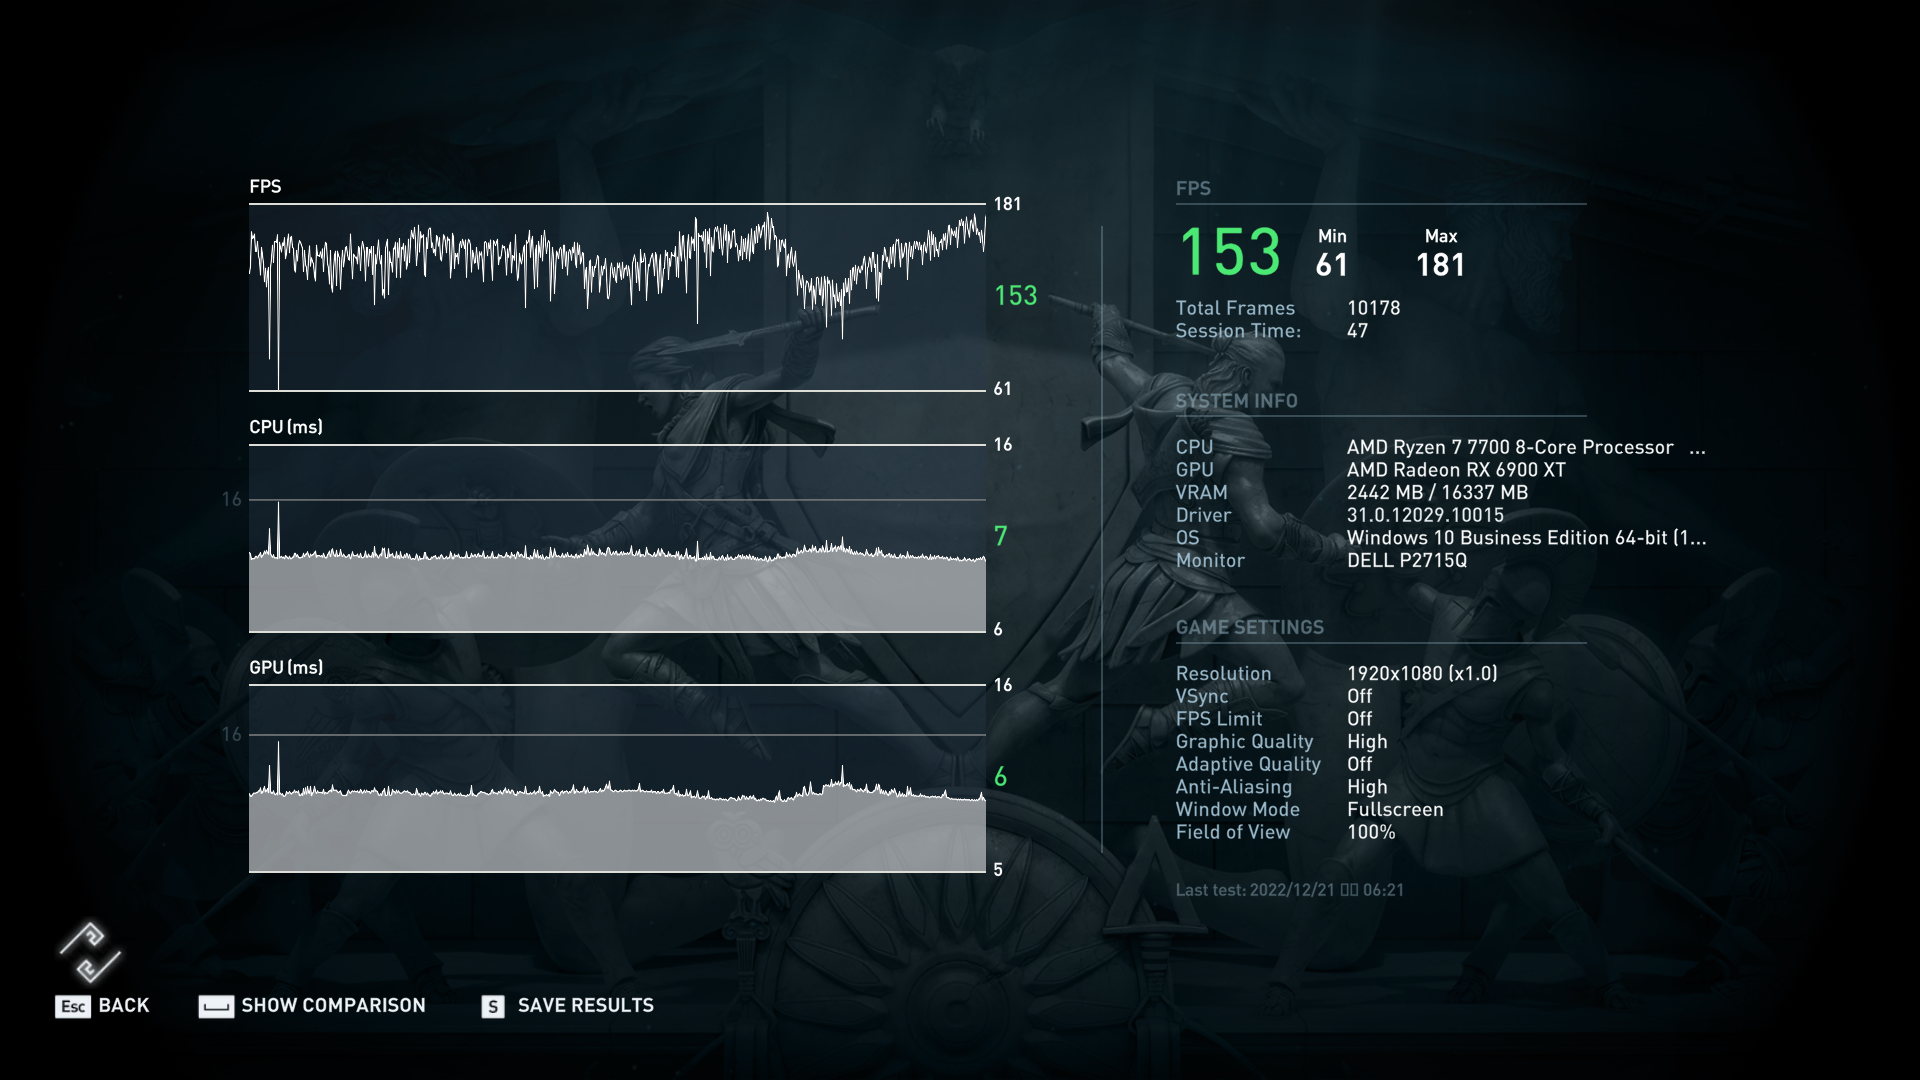
i.Assassin's Creed Odyssey《刺客信條奧德賽》
(英語:Assassin's Creed Odyssey,中國大陸譯作「刺客信條:奧德賽」) 是由魁北克育碧( Ubisoft Quebec)開發,育碧( Ubisoft)發行的動作角色扮演視頻遊戲。這是《刺客教條》系列的第十一個主要部分,總體上是第 21個,是 2017年《刺客教條》起源的繼任者。該情節設定於公元前 431-422年,講述了雅典和斯巴達之間的伯羅奔尼撒戰爭的神話歷史。玩家控制男性或女性傭兵(古希臘: μίσθιος misthios )在試圖團結家人的同時在衝突雙方中戰鬥的人

Assassin's Creed Odyssey 1080P Results
Ryzen 7 7700 1080P Results:153fps
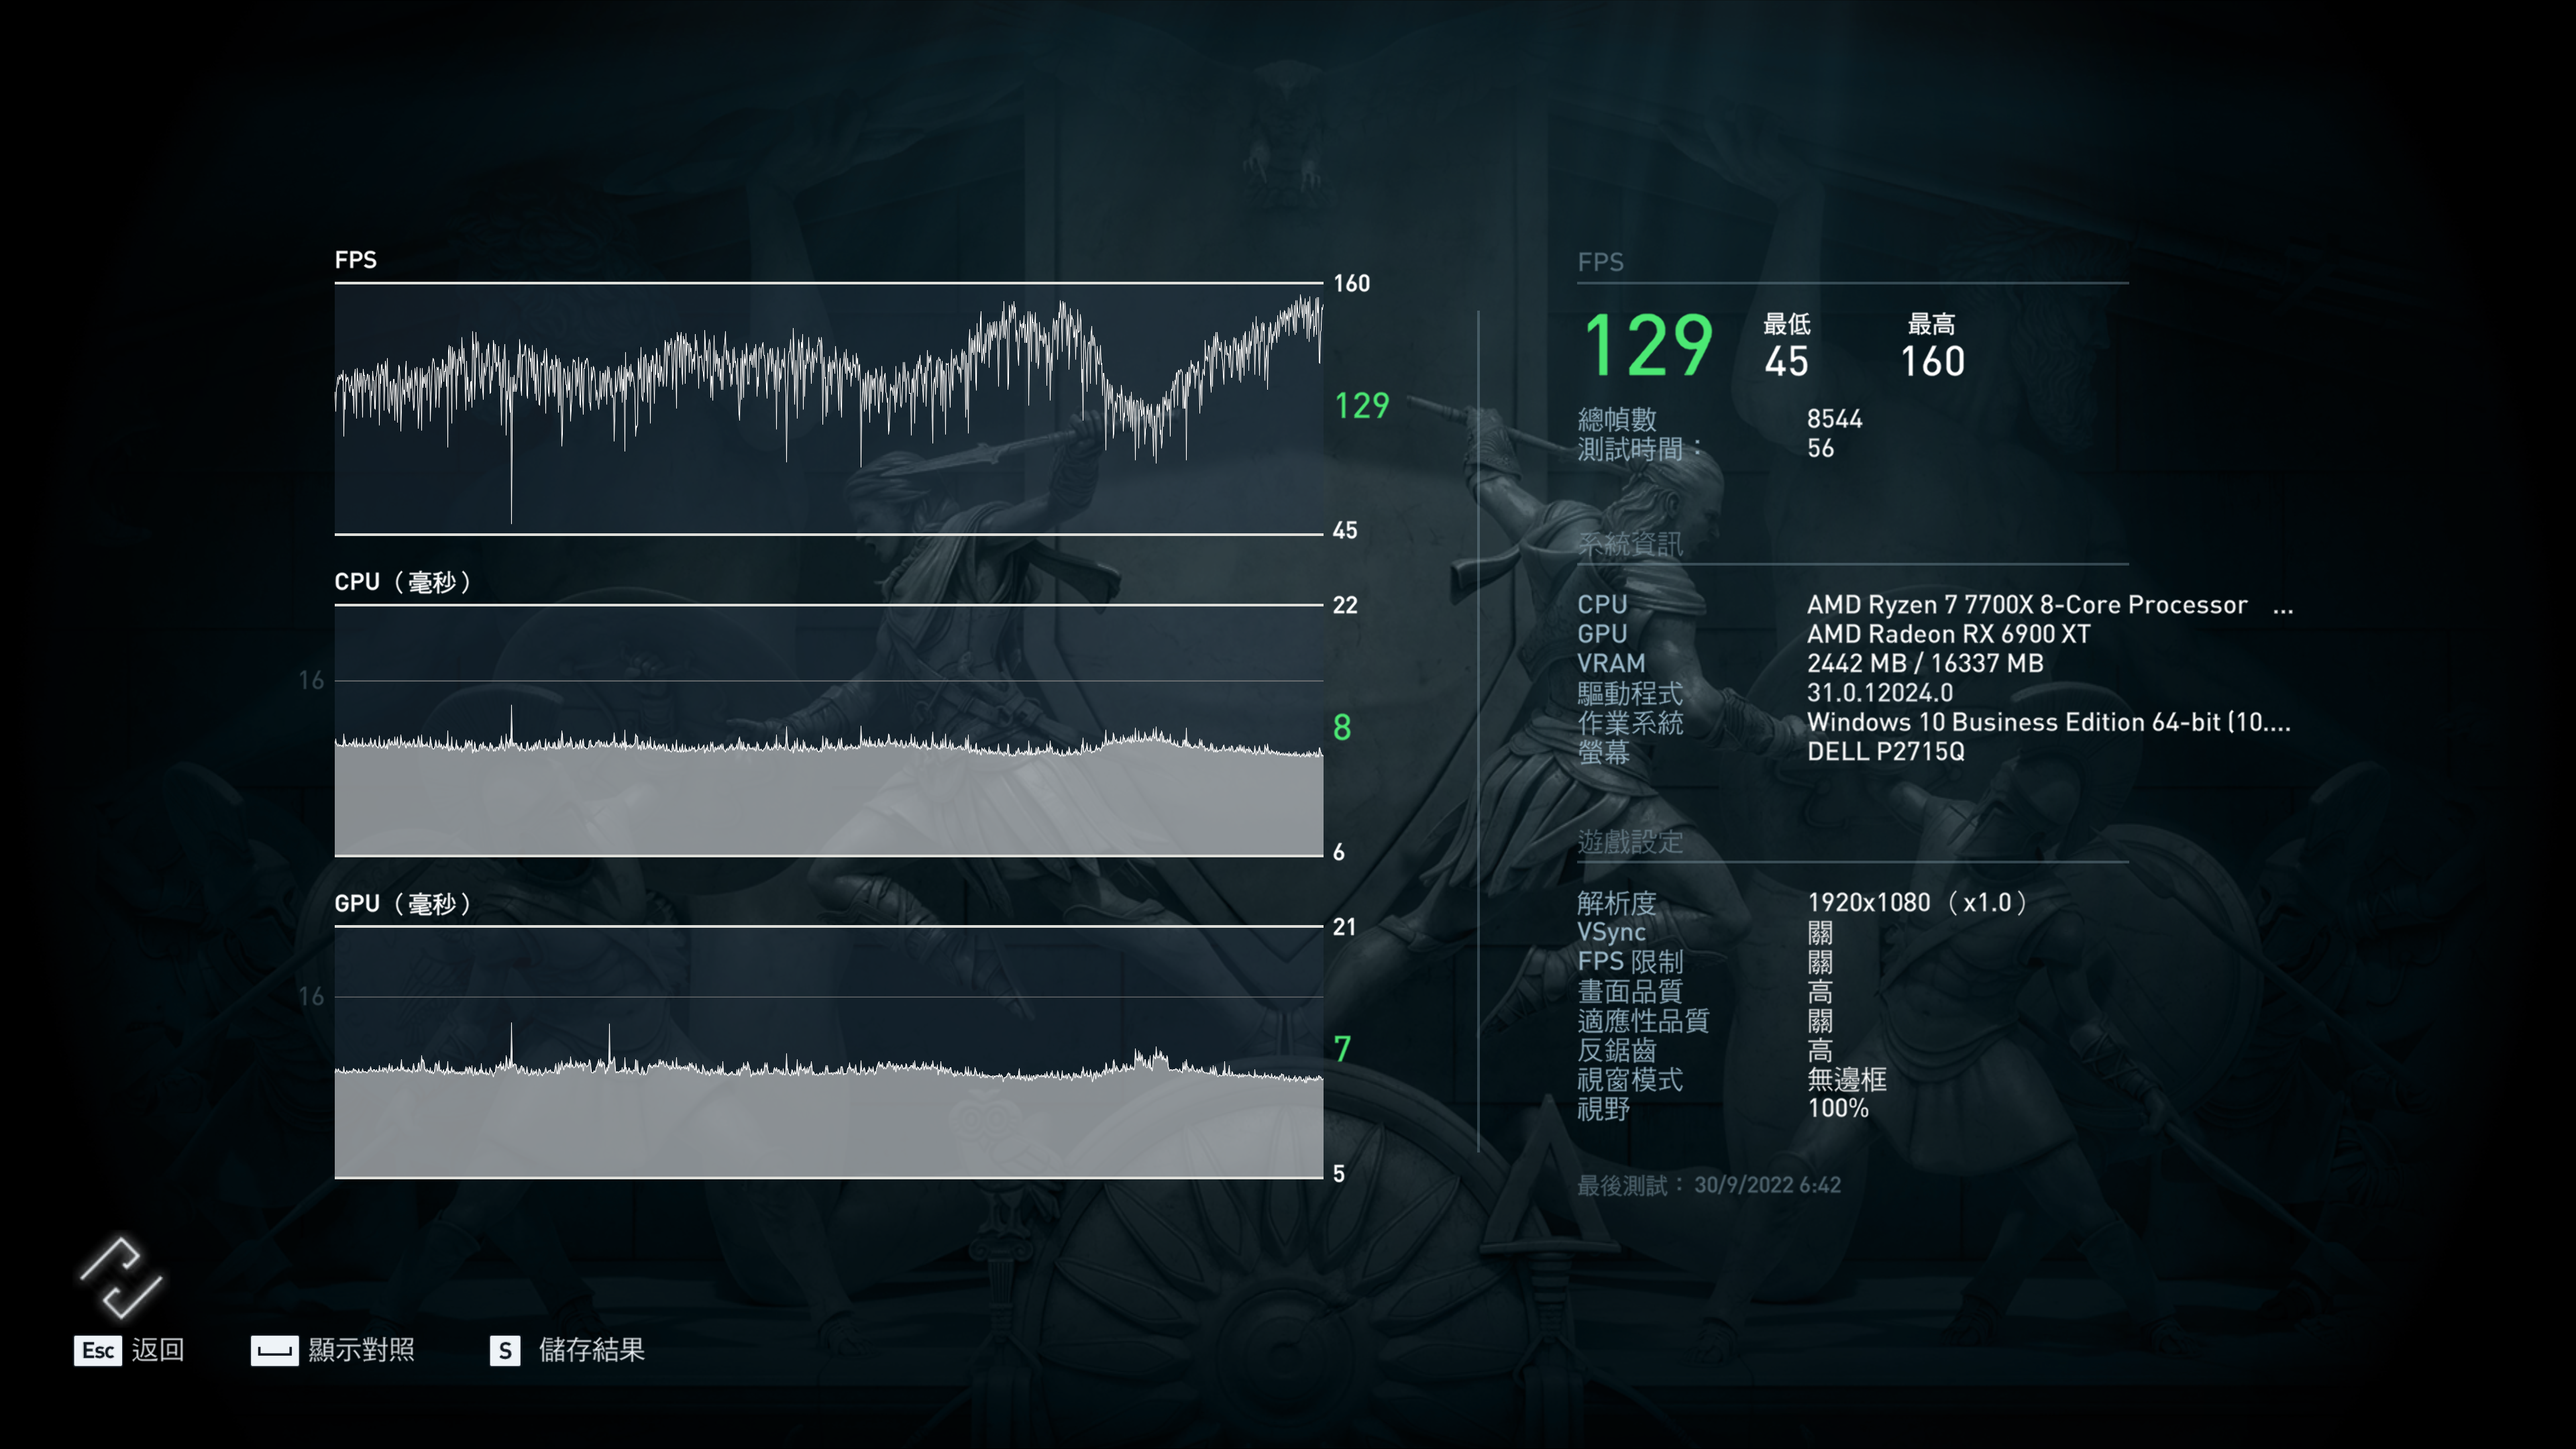
對照組
Ryzen 7 7700X 1080P Results:129fps
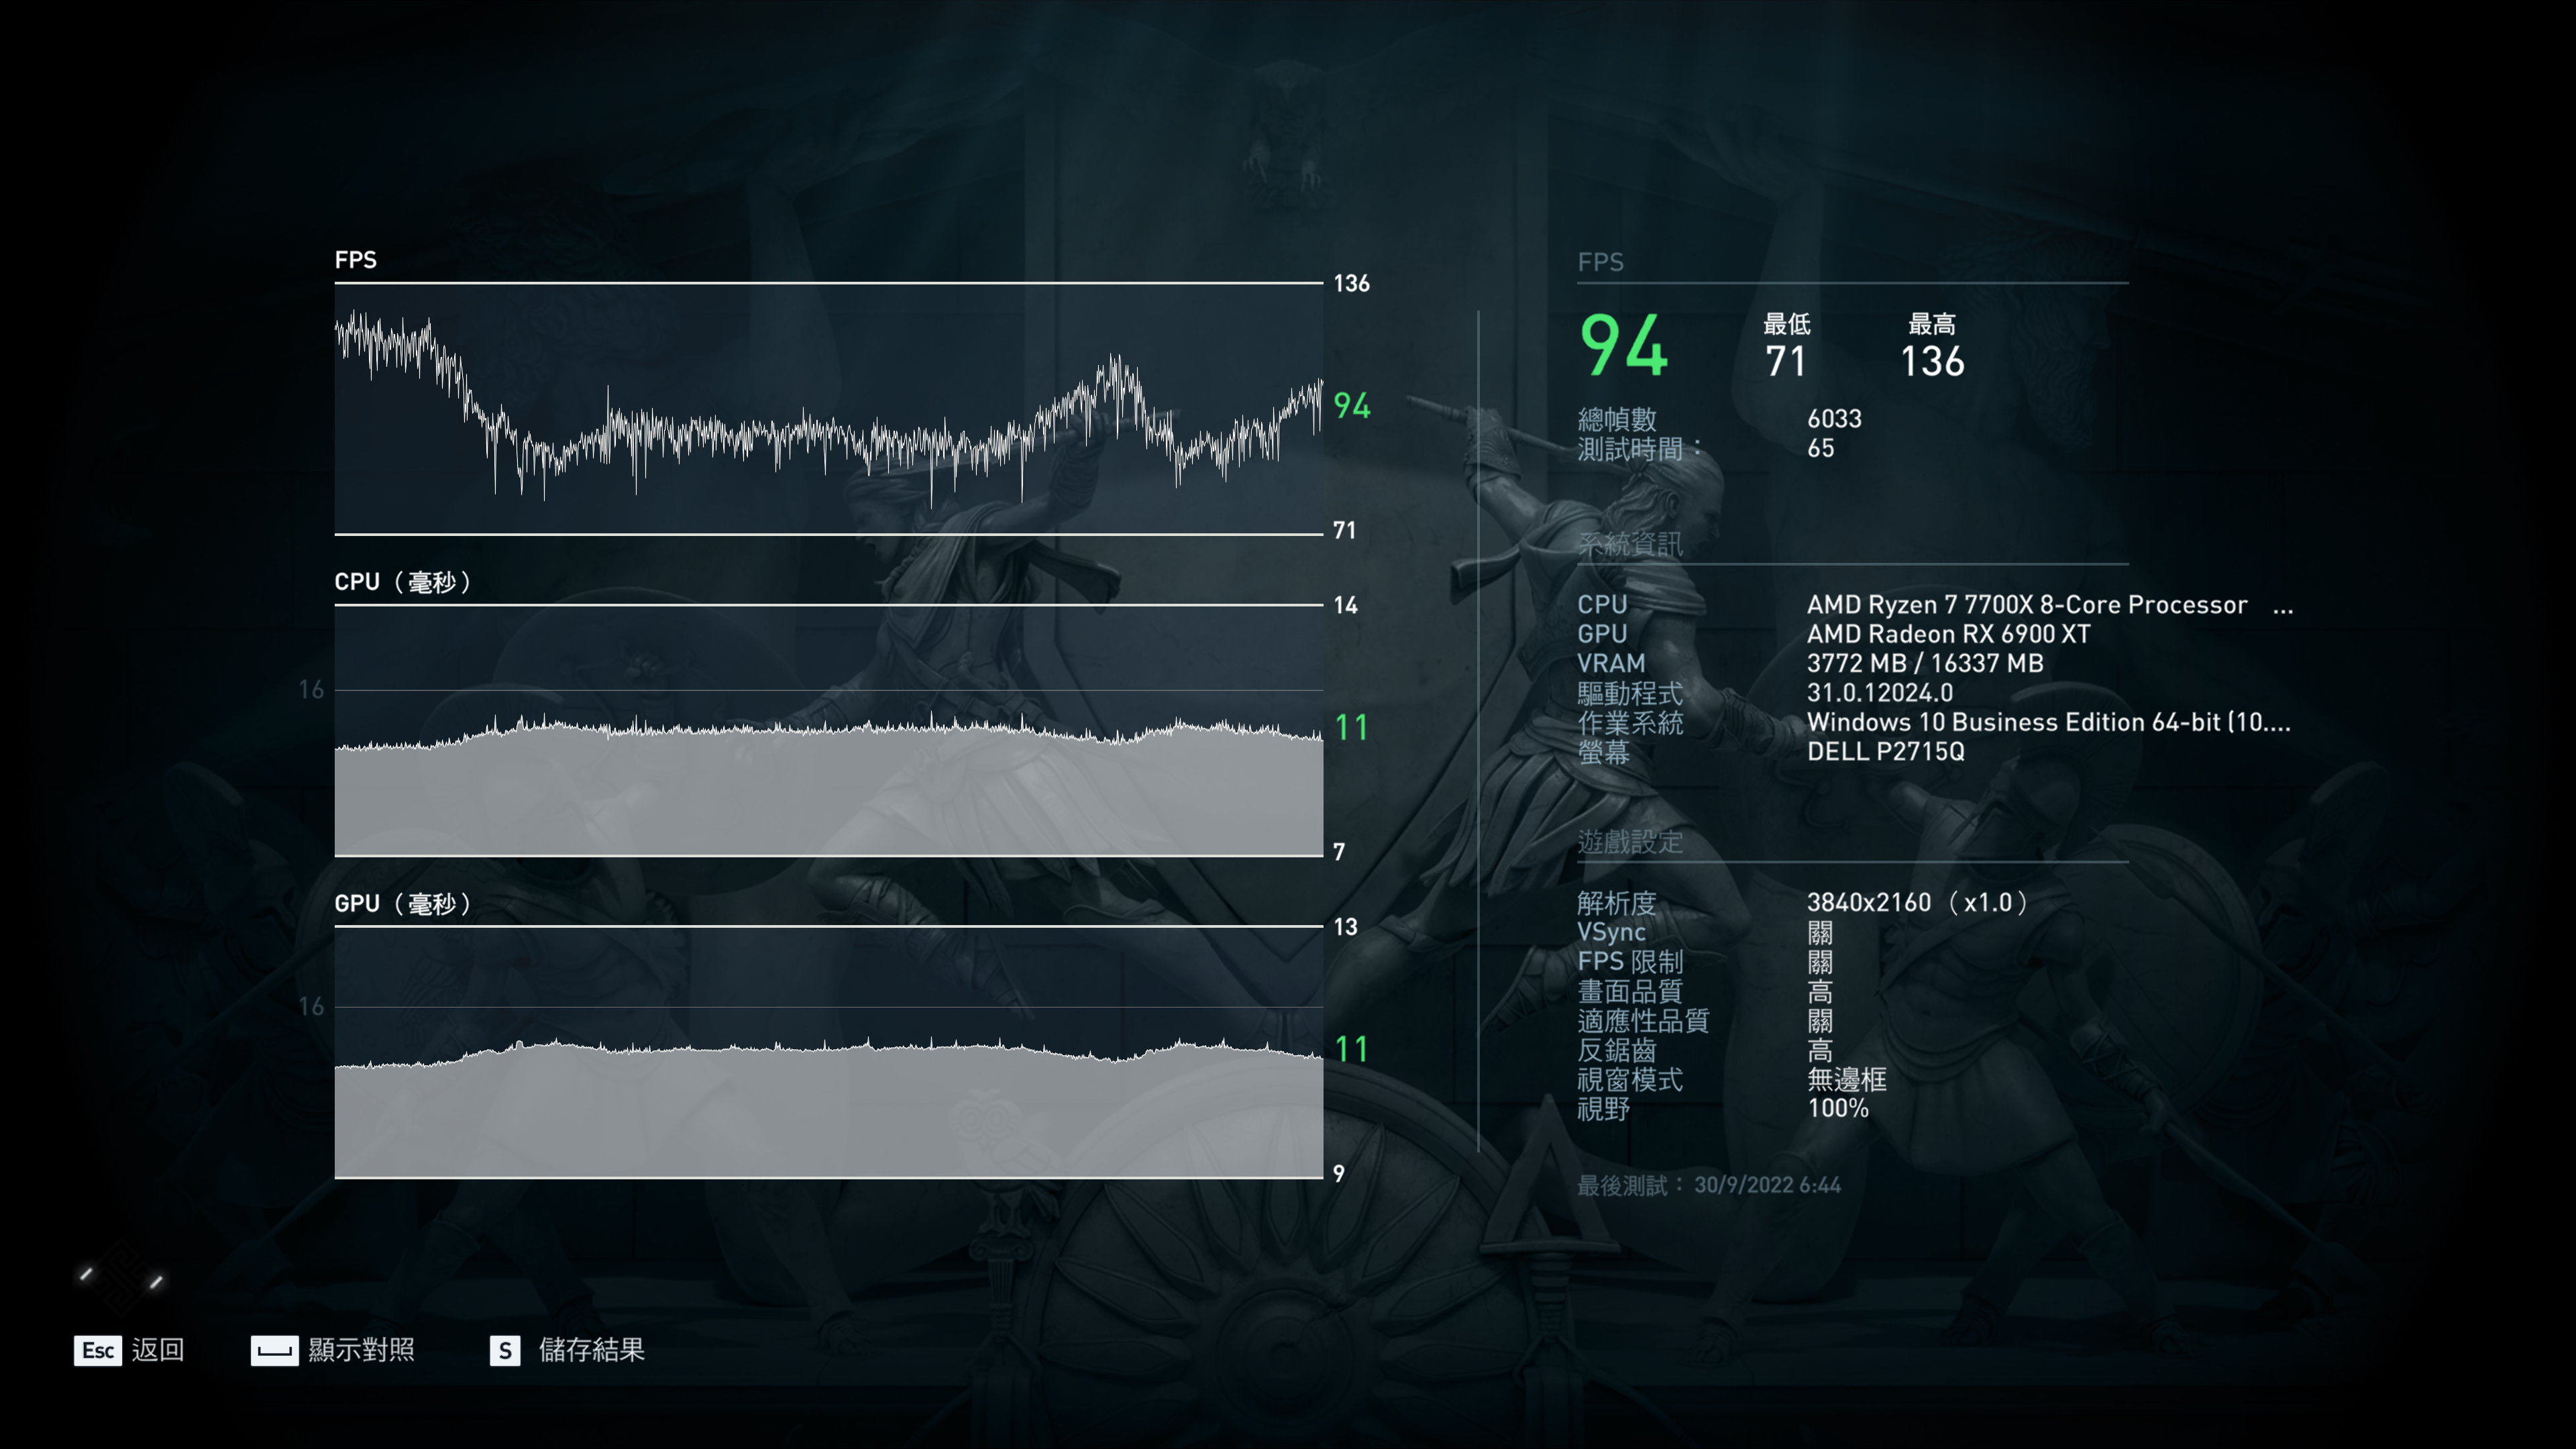
Assassin's Creed Odyssey 4K Results
Ryzen 7 7700 4K Results:97fps
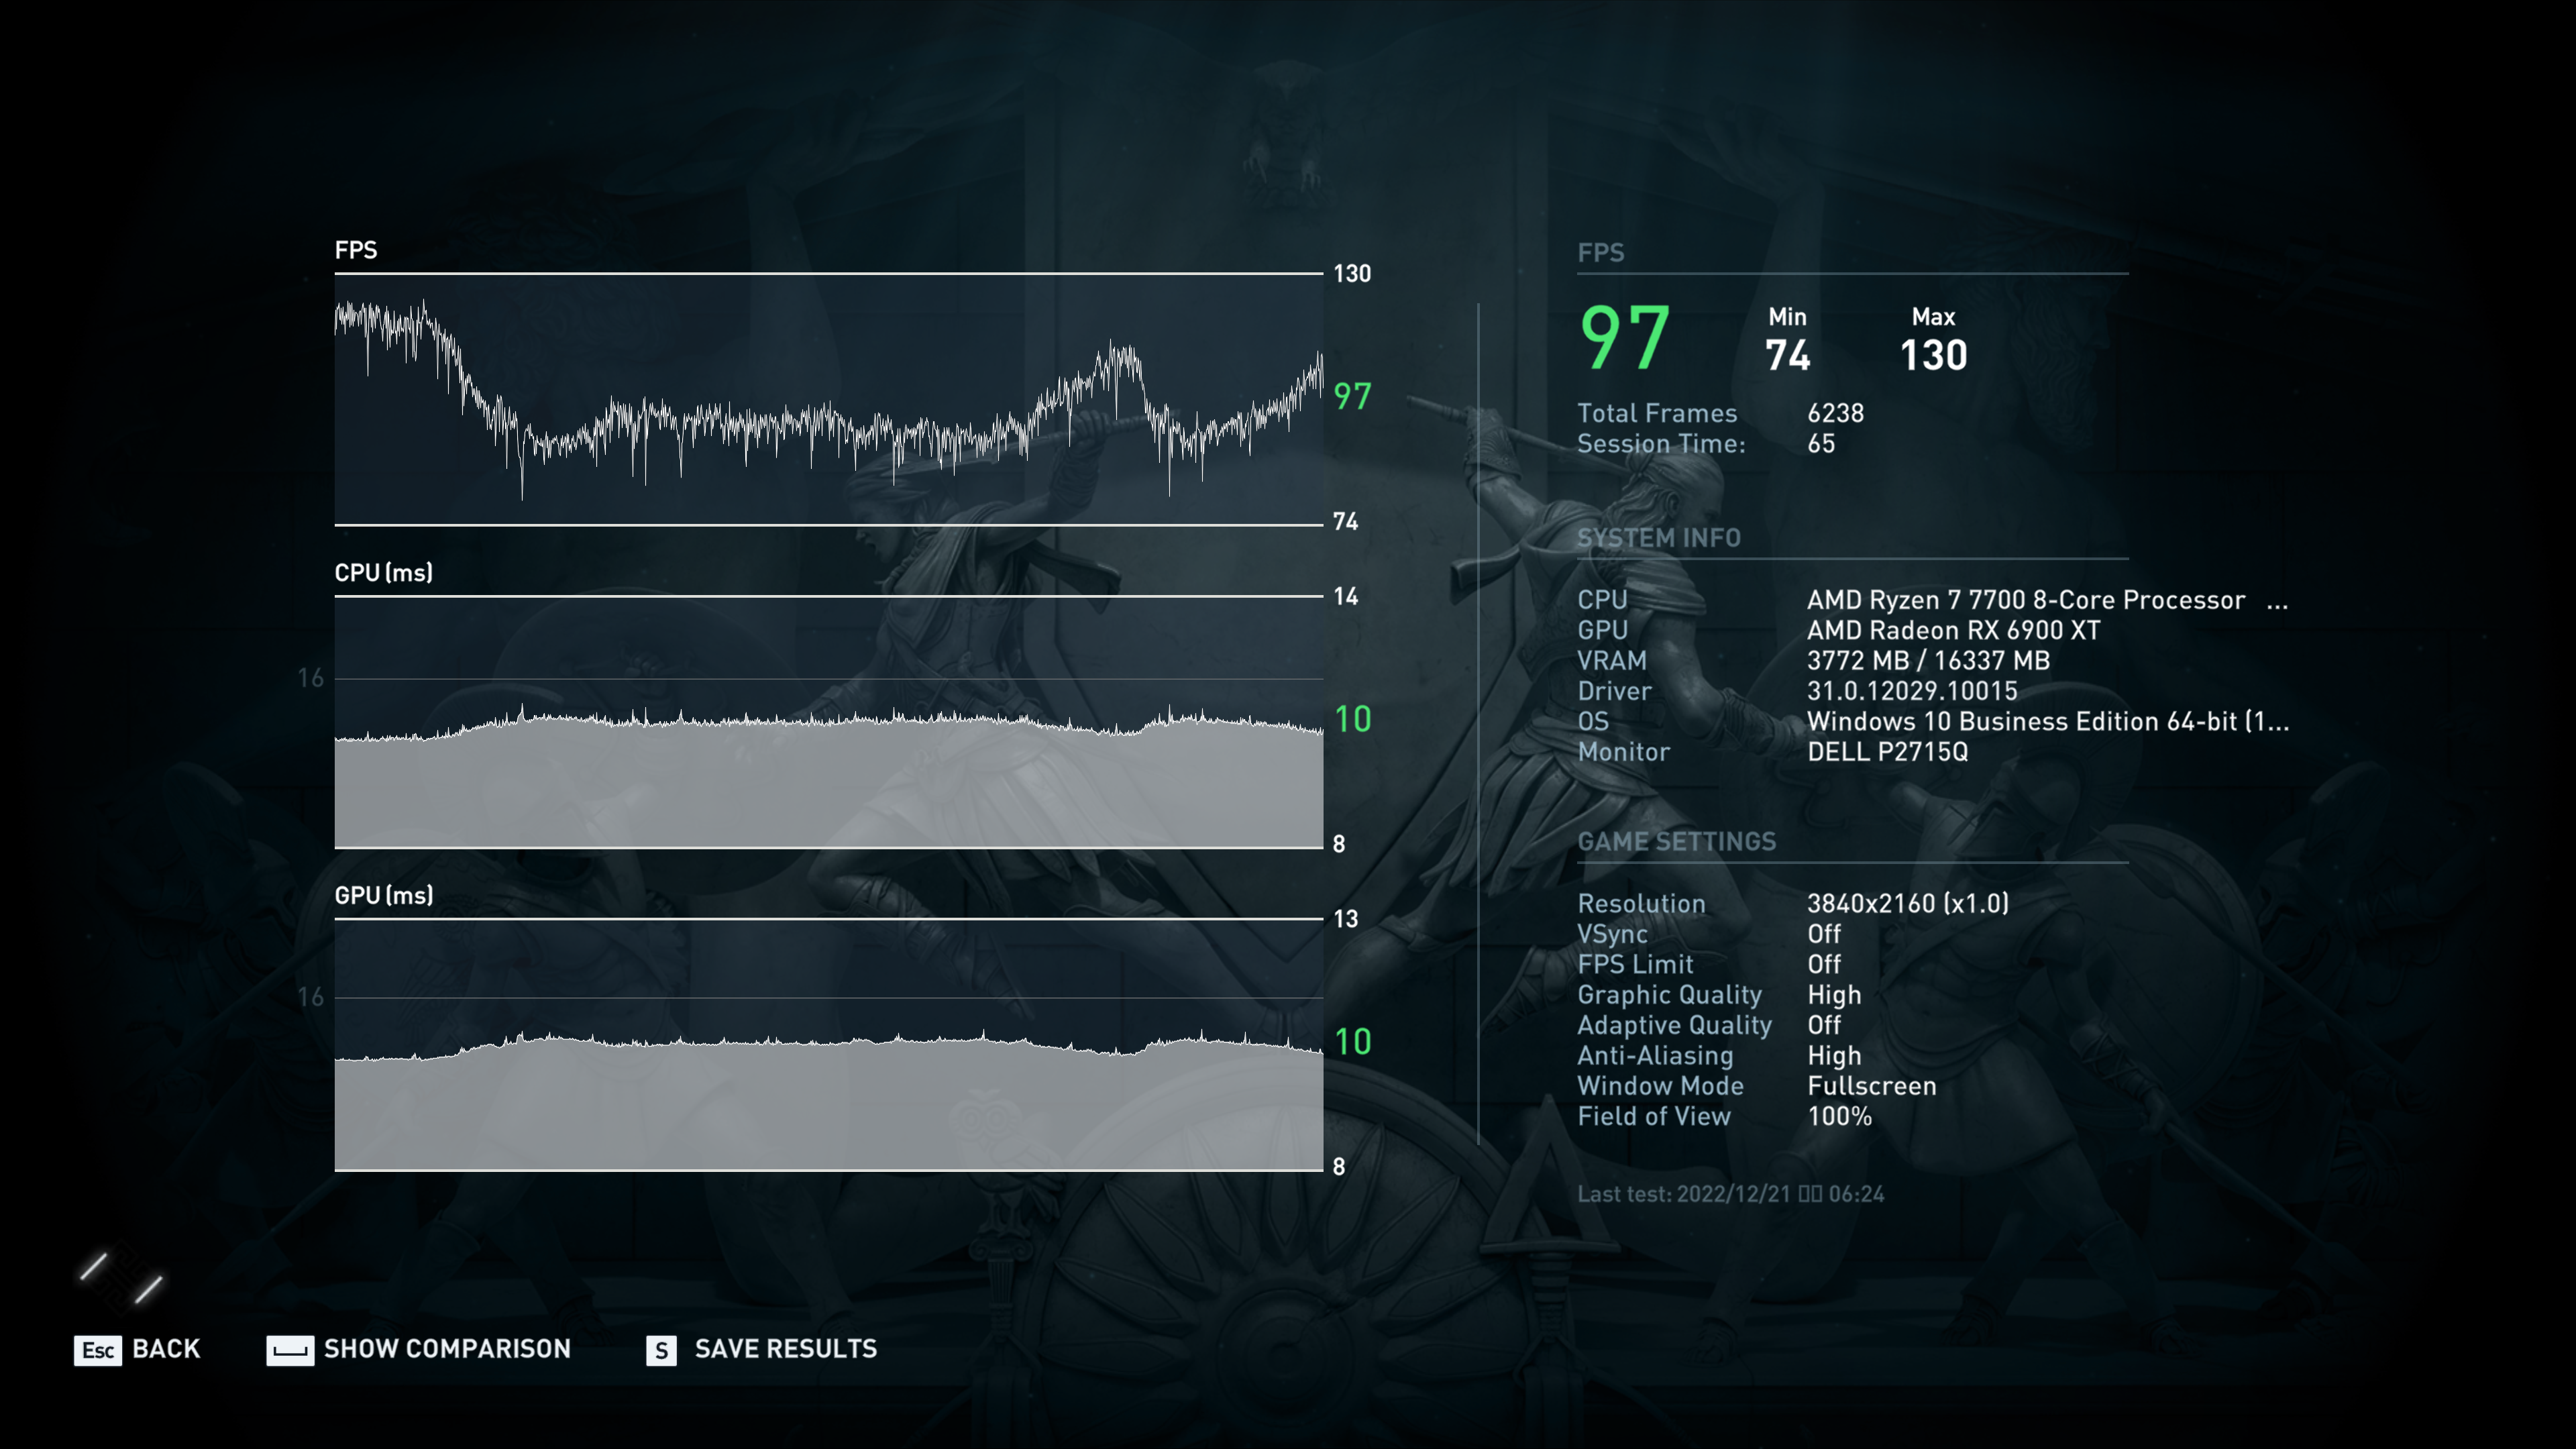
對照組
Ryzen 7 7700X 4K Results:94fps
Assassin's Creed Odyssey Benchmark測試比較表
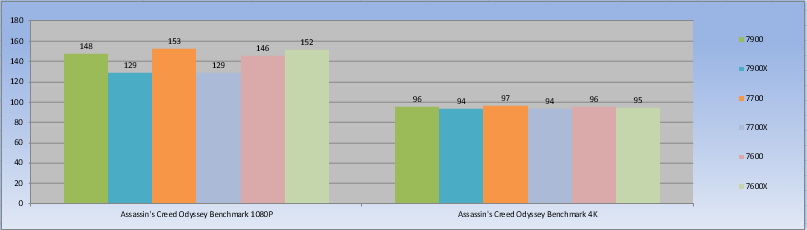
⇧單位:fps數字愈大愈好, 元/fps數字愈小愈好
j.Total War: Three Kingdoms《全軍破敵:三國》
《全軍破敵:三國》(英語:Total War: Three Kingdoms,中國大陸譯作「全面戰爭:三國」)是一款由 Creative Assembly開發、由 SEGA發行的回合制策略遊戲。該遊戲原計劃於 2018年秋季發售,後經過兩次跳票延期至 2019年 5月 23日發售,首周單周銷量達 100萬,19萬玩家同時線上,創下全軍破敵系列之最

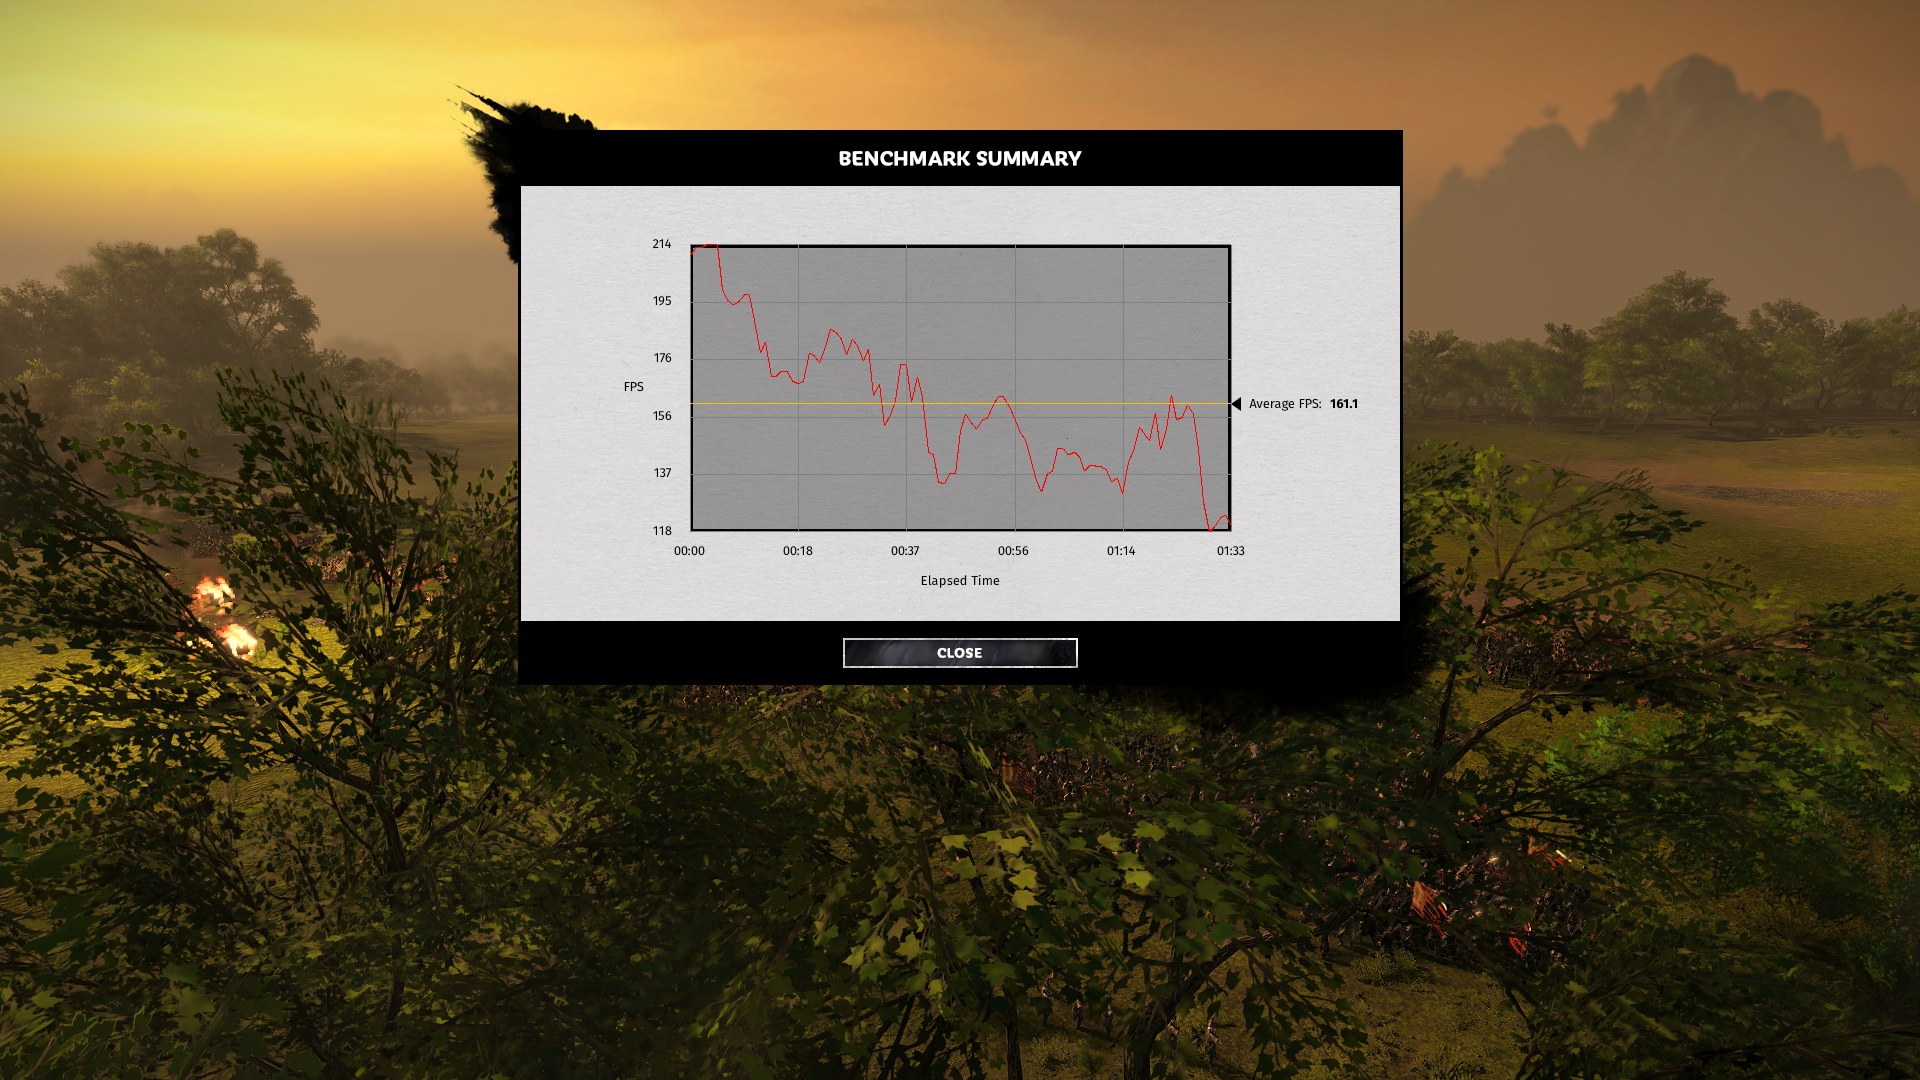
Total War: Three Kingdoms 1080P Results
Ryzen 7 7700 1080P Results:166.8fps
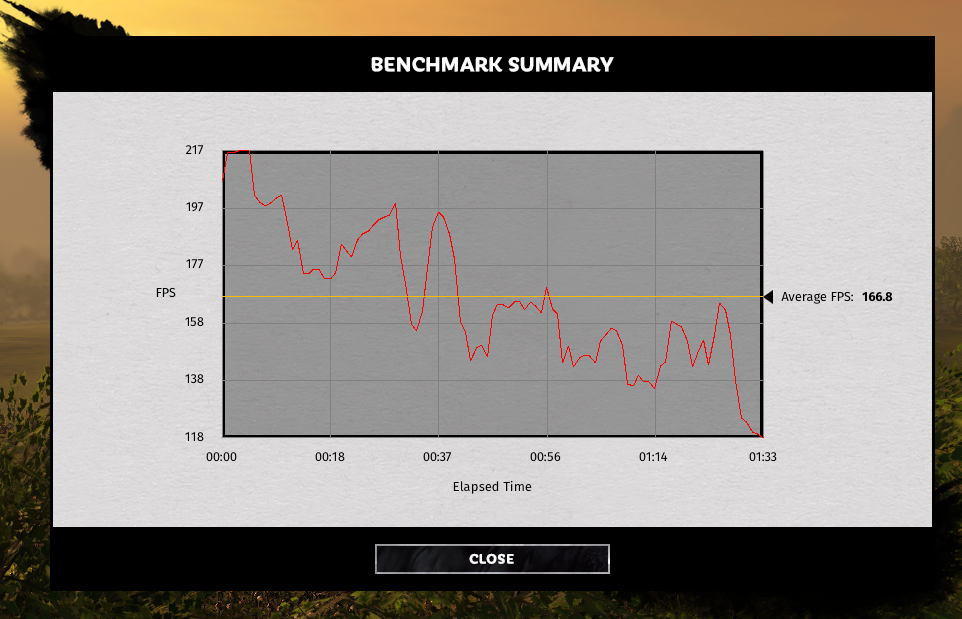
對照組
Ryzen 7 7700X 1080P Results:161.1fps
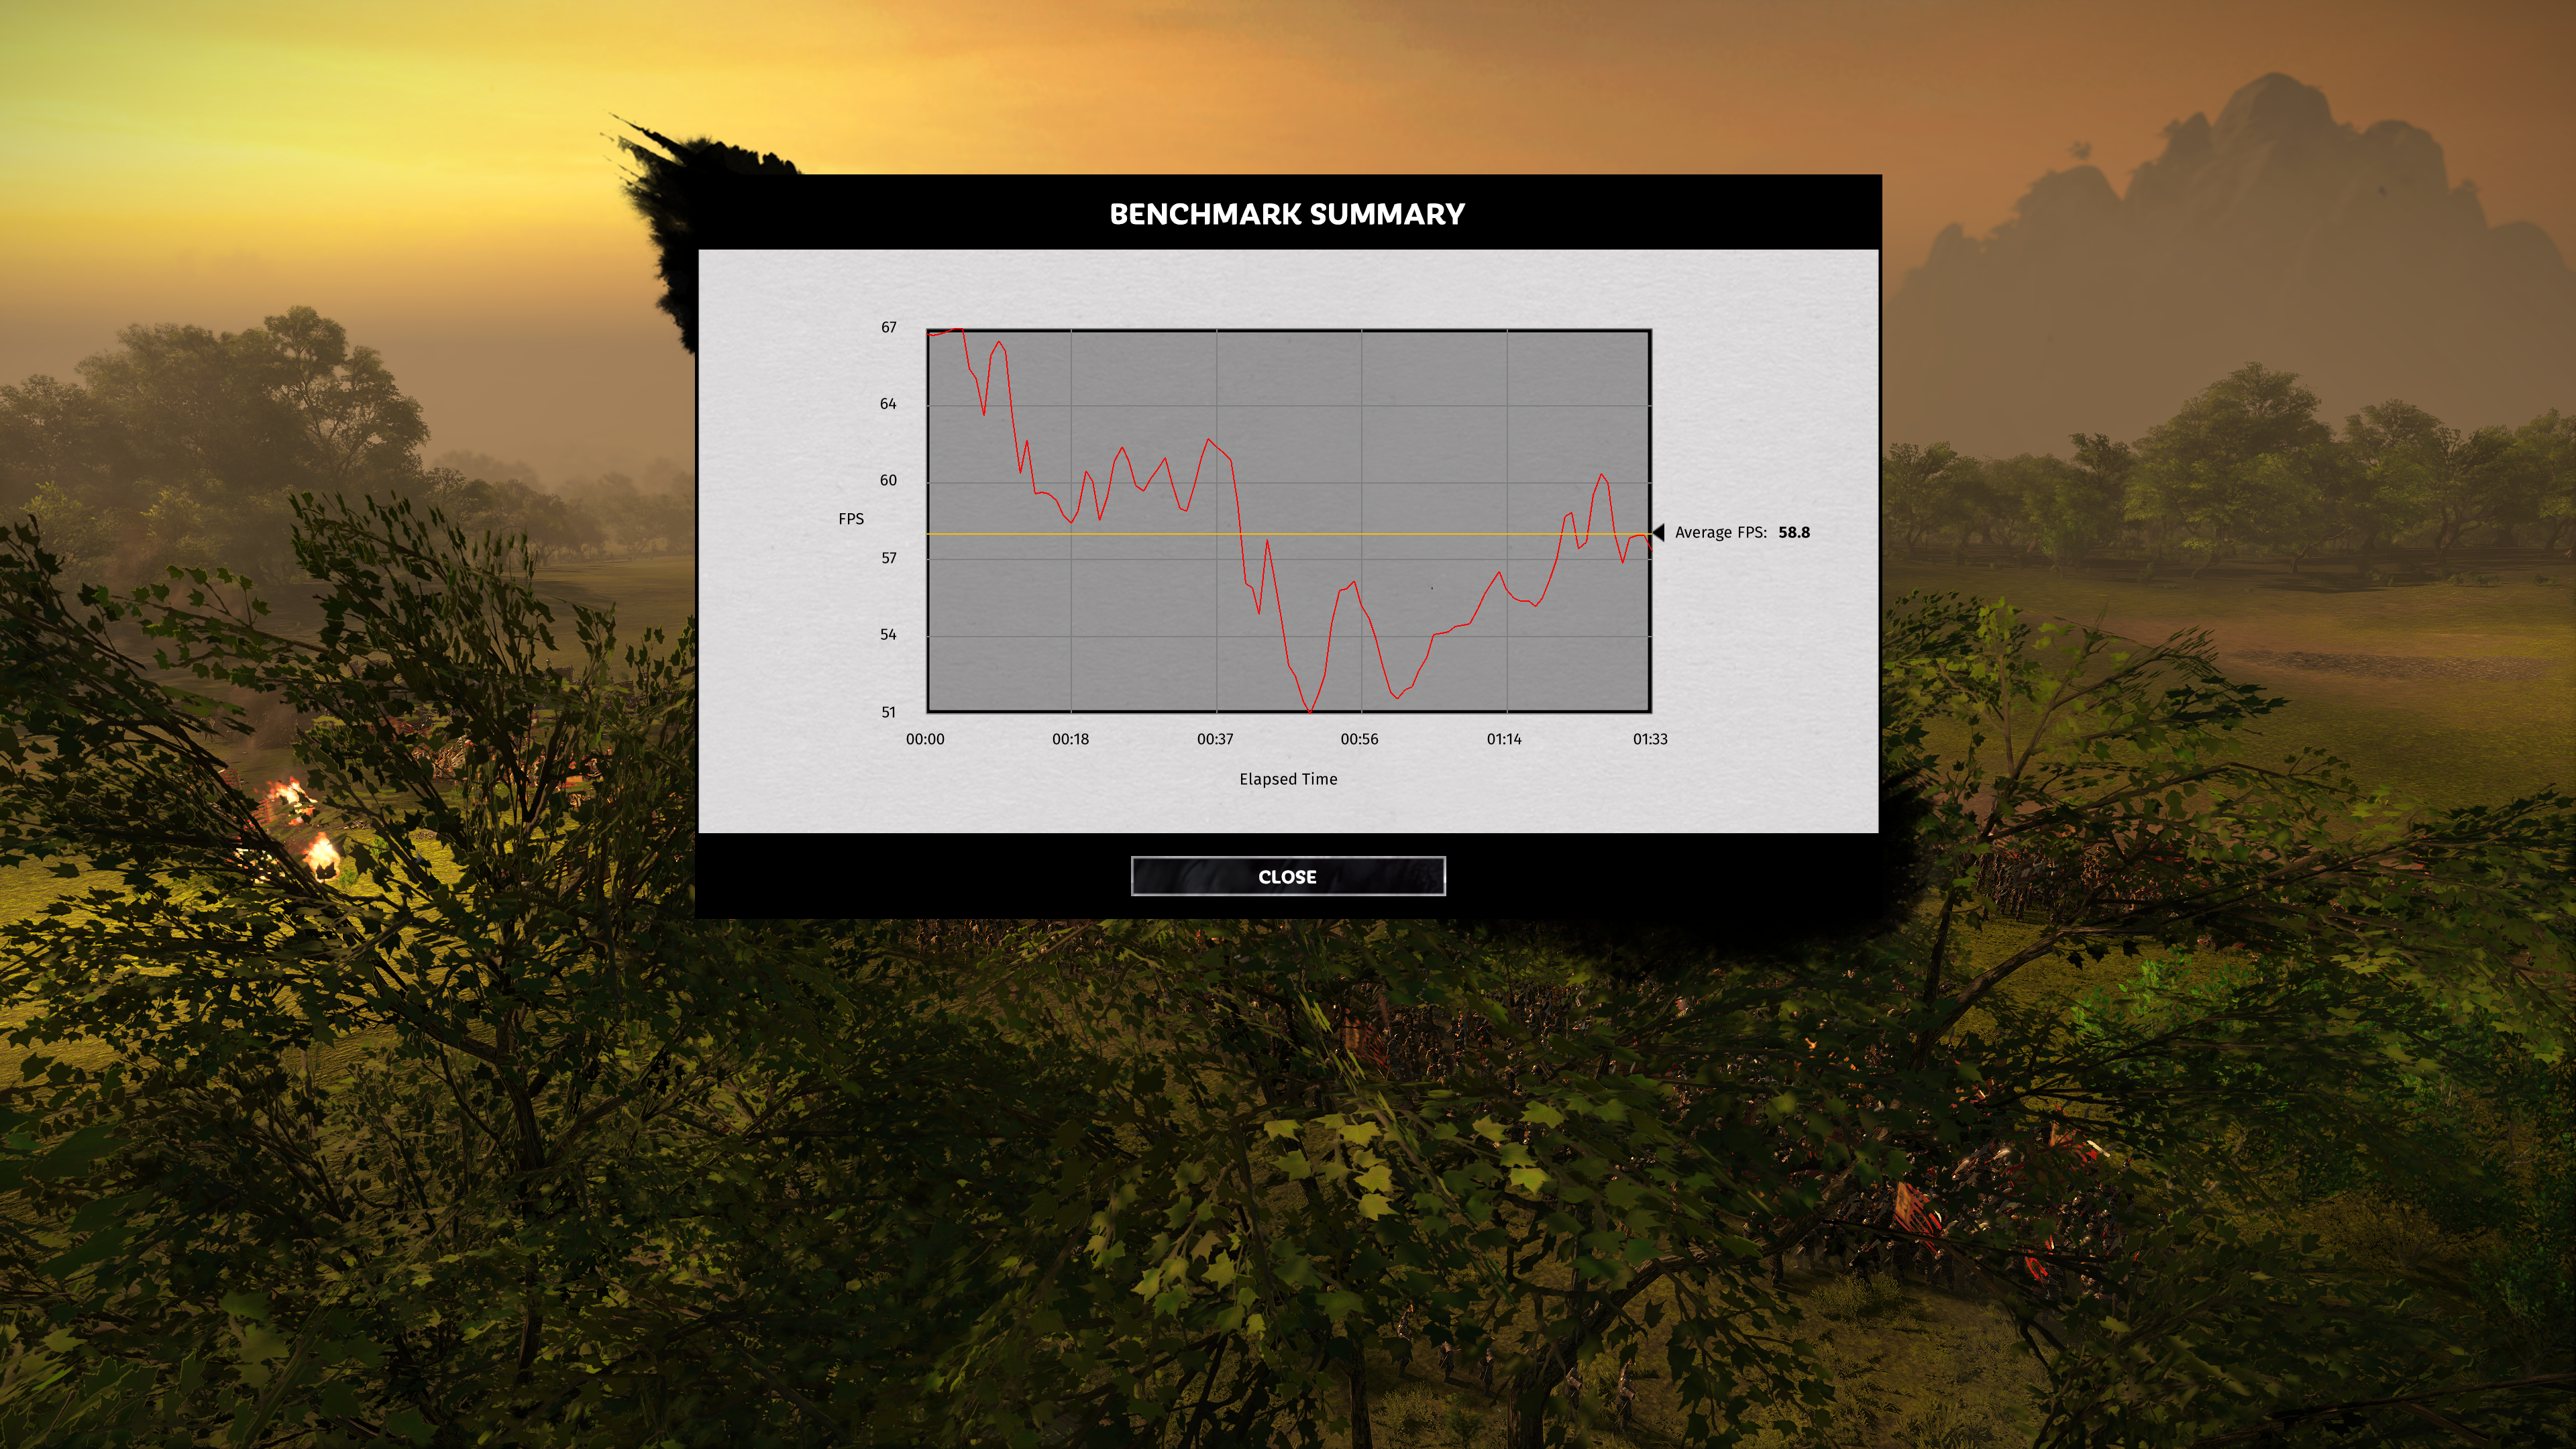
Total War: Three Kingdoms 4K Results
Ryzen 7 7700 4K Results:60.2fps
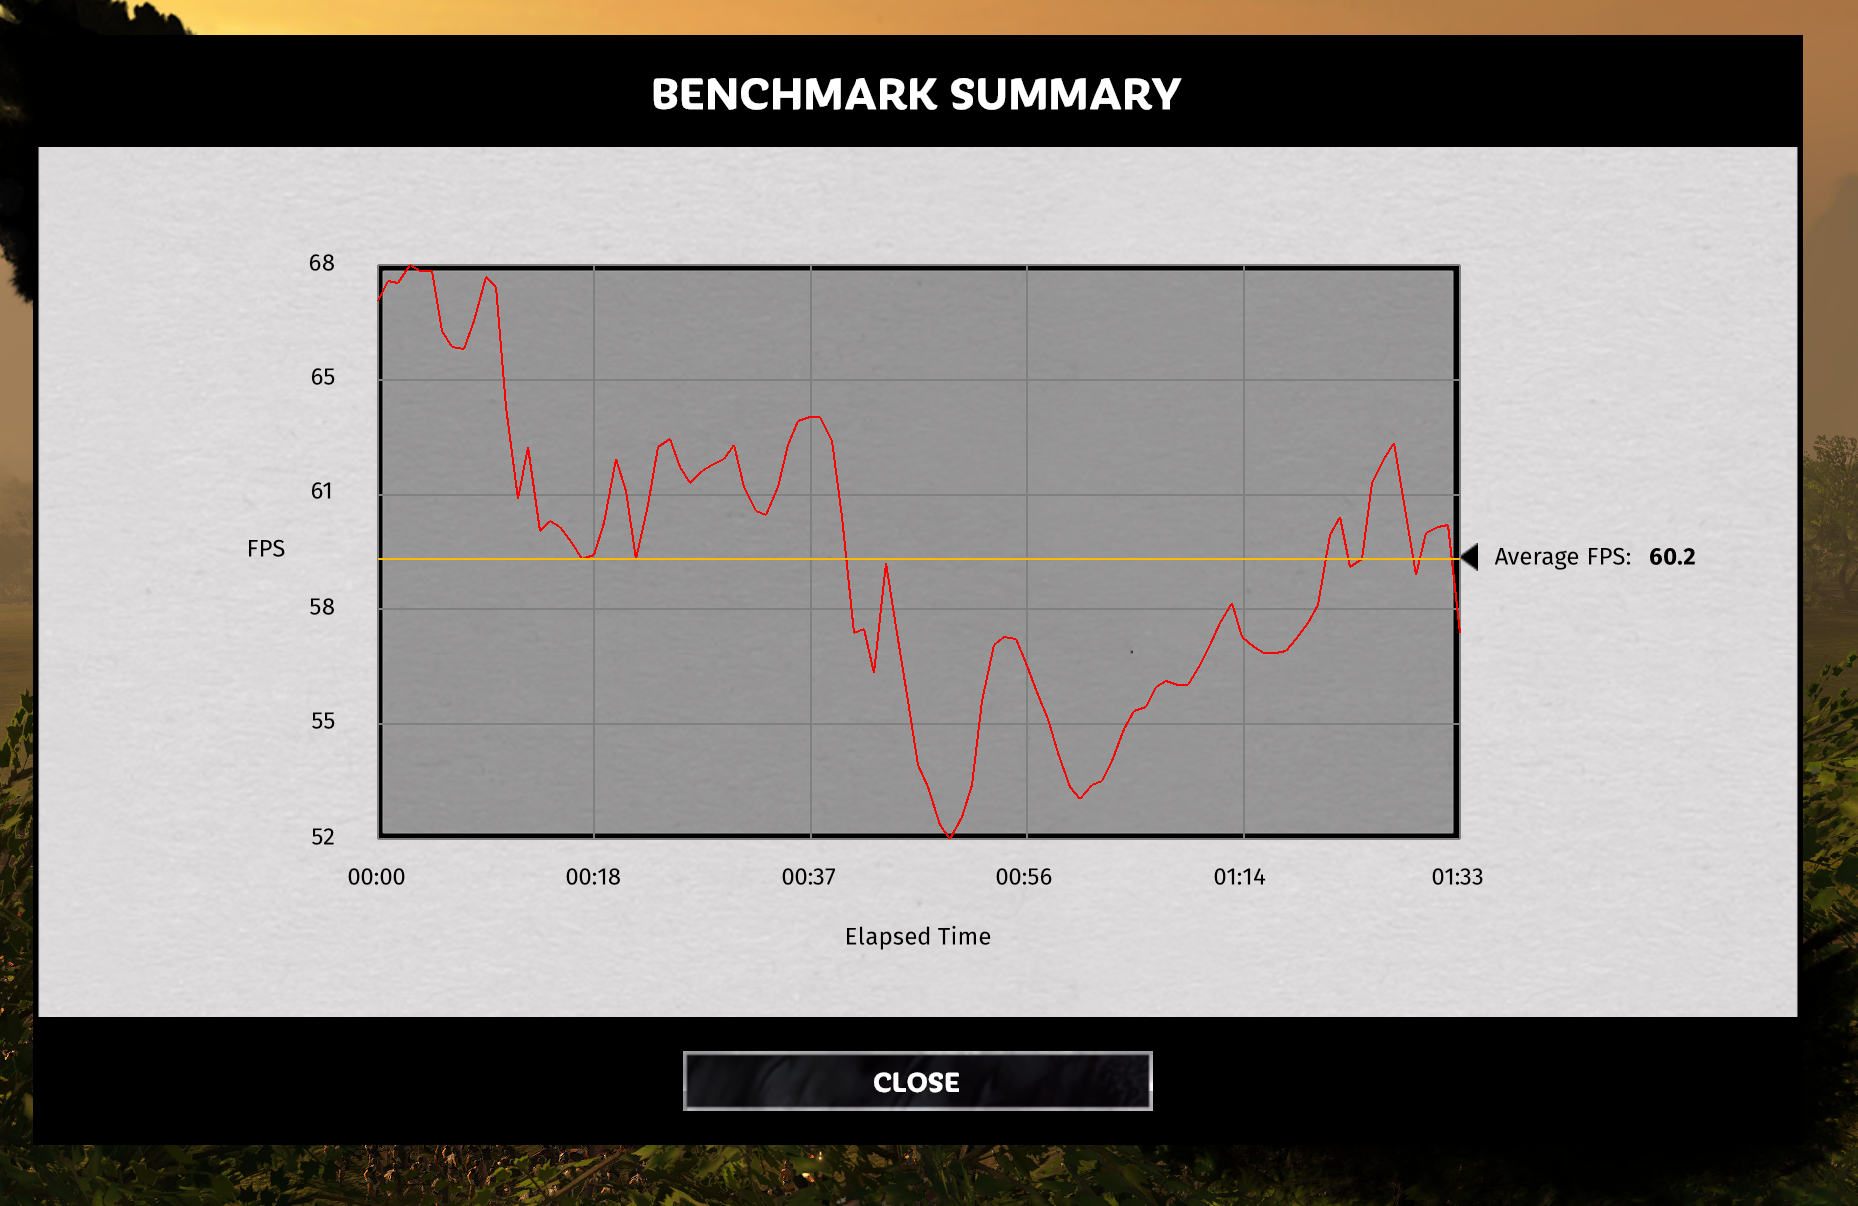
對照組
Ryzen 7 7700X 4K Results:58.8fps
Total War : Three Kingdoms Benchmark測試比較表
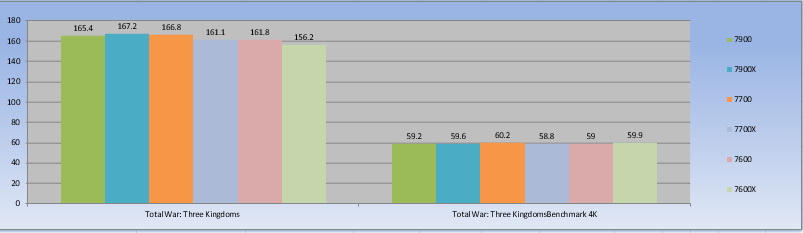
⇧單位:fps數字愈大愈好, 元/fps數字愈小愈好
評比 :
非 X版之 Ryzen 7 7700處理器除了能在遊戲的領域中表現出極佳的效能之外,同時也兼顧了內容創作的效能,是個全能型的桌上型處理器;但因為 Ryzen 7 7700的功耗只有 65W的關係,原本滄者以為會因此而拉大了與 Ryzen 7 7700X處理器的效能差距,但從以上各項測試比較表中可以看出,TDP只有 65W的 Ryzen 7 7700,其在內容創作的效能表現仍是中規中矩,而其在遊戲幀數的表現上與 Ryzen 7 7700X的差距更少,加上非 X版本的 Ryzen 7 7700的售價較 X版低,還隨盒附贈 Wraith Prism RGB LED CPU cooler,讓Ryzen 7 7700成為低價版本之 12 核心處理器
非 X版 Ryzen 7000系列桌上型處理器在跟 Ryzen 5800X相比時,「Zen4」因為新增了對 AVX-512的支援,借助新前端設計、存取、分支預測、執行引擎以及 L2 Cache,因此實現了在 IPC效能對「Zen3」有大幅的提升,相較 Ryzen 5000X系列處理器,非 X版 Ryzen 7000系列桌上型處理器反而在功耗只有 65W的情況下仍對 Ryzen 5800X的勝出
在 WinRAR解壓縮的比較表中,所有的 Ryzen 7000系列處理器與 Ryzen 7 5800X及 Ryzen 5 5600X之比較,Ryzen 7000系列處理器均能勝出

在 CPUMARK99運算測試比較表中,所有的 Ryzen 7000系列處理器與 Ryzen 7 5800X及 Ryzen 5 5600X之比較,Ryzen 7000系列處理器均能勝出
在 CPU-Z Bench測試比較表中,所有的 Ryzen 7000系列處理器與 Ryzen 7 5800X及 Ryzen 5 5600X之比較,Ryzen 7000系列處理器均能勝出
在 POV-Ray Benchmark測試比較表中 (數字愈小愈好) ,所有的 Ryzen 7000系列處理器與 Ryzen 7 5800X及 Ryzen 5 5600X之比較,Ryzen 7000系列處理器均能勝出
在 Assassin's Creed Origins Benchmark測試比較表中 (數字愈大愈好) ,所有的 Ryzen 7000系列處理器與 Ryzen 7 5800X之比較,Ryzen 7000系列處理器均能勝出

在不犧牲太多的效能下,非 X版 Ryzen 7000系列處理器更能降低功耗因而達到更省電的目的,從底下的 Cinebench R23 Benchmark比較表可以看出省電版的 Ryzen 9 7900、Ryzen 7 7700、Ryzen 5 7600其效能還是挺優質的,不過其實無論是何種規格的 AMD處理器,相對友商 AMD的進步是大家有目共睹的,玩家只需按照個人的需求去從 AMD Ryzen 7000系列處理器中選擇適合自己的處理器就好
Cinebench R23 Benchmark比較表
⇧單位: Performance Score (數字愈大愈好)
在這 DDR5、PCIE 5.0的跨世代變革之際,AMD之 AM5平台已不再對 DDR4平台的支持,經過測試比對在 DDR5頻率方面在與友商的 DDR5頻率相比時,滄者覺得 AMD還得加油,我想這多半與 AMD給主機板廠商對 BIOS的開放權限程度,不如友商來的高有關
一個成功的處理器除了要做到出眾的效能之外還必須擁有親民的售價,通過本篇測試之後,除了 Ryzen 3系列處理器之外,所有的 Ryzen 7000系列處理器也都已經完測;以新品來說非 X版本的 Ryzen 7000系列處理器不但附贈了 CPU散熱器而且價格更加親民,確實是非常值得考慮預算的玩家入手
AMD自 2017推出第一代 Ryzen桌上型處理器發表至今已經 5年多,Ryzen桌上型處理器由漸入佳境至碩果累累,Ryzen桌上型處理器一代強於一代之效能也有目共睹,AMD秉持突破再創新,並以「Zen4」繼續引領遊戲與內容創作之高性能先驅以滿足使用者需求,而今年 AMD還會在 AM5平台上推出代號「Phoenix Point」擁有 8核心 16線程,12個 CU RDNA 3內顯的 APU,以及採用 4nm,3nm製程的「Zen5」也預計將在今年問世,謝謝收看
地表最強 5nm非 X版本之 AMD Ryen 7000系列桌上型處理器將於 1/10上市開賣,滄者也在第一時間為您一一奉上 Ryzen 9 7900、Ryzen 7 7700、Ryzen 5 7600之各項測試,而本篇為 Ryzen 7 7700效能測試,所有的測試均有實測圖並與 Ryzen 9 7900X、Ryzen 7 7700X、Ryzen 5 7600X比較;Ryzen 7 7700處理器相對應不鎖頻版本之 Ryzen 7 7700X處理器有著相同的核心數量,不過非 X版本的處理器頻率與功耗本來就比 X版本低,所有非 X版的處理器的功耗均為 65W,而且 Ryzen 9 7900、Ryzen 7 7700還隨盒附贈 Wraith Prism RGB LED CPU cooler,Ryzen 5 7600則附贈 Wraith Stealth CPU cooler,且售價也相對 X版本便宜,有關非 X版 Ryzen 7000系列處理器與不鎖頻的 Ryzen 7000系列處理器版頻率售價功耗比較請詳下表
非 X版 Ryzen 7000系列處理器與不鎖頻的 Ryzen 7000系列處理器版頻率售價功耗比較表
AMD Ryzen 9 7900X:12C24T/ 4.7~5.6GHz / 170W/ $549
AMD Ryzen 9 7900: 12C24T/ 3.6~5.4GHz / 65W /$429 /Wraith Prism RGB LED cooler
AMD Ryzen 7 7700X:8C16T / 4.5~5.4GHz /105W/ $399
AMD Ryzen 7 7700: 8C16T / 3.6~5.3GHz / 65W /$329 /Wraith Prism RGB LED cooler
AMD Ryzen 5 7600X:6C12T / 4.7~5.3GHz/ 105W/ $299
AMD Ryzen 5 7600: 6C12T / 3.8~5.1GHz/ 65W / $229 /Wraith Stealth cooler
另外與本篇同步發表的還有
地表最強 5nm非X版本處理器現身,看 AMD Ryzen 9 7900、Ryzen 7 7700、Ryzen 5 7600開箱及規格介紹
地表最強 5nm非 X版本處理器 Ryzen 9 7900測試,並與 Ryzen 9 7900X、Ryzen 7 7700X、Ryzen 5 7600X效能比較
地表最強 5nm非 X版本處理器 Ryzen 5 7600測試,並與 Ryzen 9 7900X、Ryzen 7 7700X、Ryzen 5 7600X效能比較
歡迎持續關注
測試元件:
Ryzen 7 7700
MOBO: GIGABYTE X670E AORUS MASTER
VGA CARD:AMD RX 6900 XT
RAM:G.SKILL Trident Z5 Neo DDR5 6000 16GBX2
測試平台
CPU: Ryzen 7 7700
CPU Cooler:Wraith Prism cooler
MB:GIGABYTE X670E AORUS MASTER
VGA:AMD RX 6900 XT
RAM:G.SKILL Trident Z5 Neo RGB DDR5 6000 16GBX2
RAM:GSKILL Trident Z DDR5 6000 16GB X2
PSU:GIGABYTE UD1000GM
OS:Windows11
電源計畫:Balanced
Wraith Prism RGB LED cooler之燈效
測試項目
A.一般測試
1.CrossMark 1.0.1.77 Pro
2.AIDA64 Cache & Memory Benchmark EXPO
3.Cinebench R23
4.PCMark10 applications benchmark
5.POV-Ray Benchmark
6.3DMark CPU Profile
7.WebXPRT3
8.UL Procyon Office Productivity Benchmark
9.WinRAR Benchmark
10.NVMe Gen4 SSD Crystal DiskMark7 Benchmark
11.Geekbench 5.4
12.CPUZ-Bench
13.CPUMark99
B.遊戲測試
a.Far Cry 5 Benchmark《極地戰嚎5》
b.Assassin's Creed Origins Benchmark《刺客教條:起源》
c.UNIGINE Superposition Benchmark
d.3DMark Time Spy
e.3DMark Time Spy Extreme
f.Final Fantasy XV Benchmark《太空戰士15:新帝國》
g.Far Cry 6《極地戰嚎6》
h.《 DIRT 5 》《大地長征 5》
i.Assassin's Creed Odyssey《刺客信條奧德賽》
j.Total War: Three Kingdoms《全軍破敵:三國》
BIOS Setting F8C Ryzen 7 7700 EXPO 6000
A.一般測試[/B]
測試諸元
Ryzen 7 7700
Ryzen 7 7700 AIDA64 Extreme CPU FPU Stress燒機測試 ,燒機頻率 5071MHz,最高溫度 75°C
Ryzen 7 7700 AIDA64 Extreme CPU FPU Stress燒機測試 ,最高功耗 90W
AIDA64 Extreme CPU FPU Stress燒機功耗溫度頻率比較表
1.CrossMark 1.0.1.77 Pro[/B]
CrossMark是一種新型的跨平台基準測試,用於衡量系統效能和使用對效能特徵建模的常見和相關工作負載的響應能力真實世界的應用程式,CrossMark使用開源和專有的組合工作負載來評估生產力、創造力和響應性 CrossMark安裝迅速,只需幾分鐘即可得出結果,整體性能評分旨在跟踪 SYSmark 25的評分,CrossMark還允許在一系列操作系統中進行比較
CrossMark為商業和政府 IT決策者、媒體、渠道購買者、顧問、系統和組件設計者和製造商,政府和非政府機構以及標準機構一種客觀,易於使用的評估 PC 的工具用戶可能遇到的各種活動的性能
CrossMark的其他功能和亮點包括:
• 跨架構系統基準測試 – 在 Windows、iOS 和 macOS上運行以評估性能,與操作系統無關。未來將添加更多平台
• 以真實應用為模型的系統基準測試-通過以下方式衡量普通用戶的性能使用開源和專有工作負載對真實應用程序進行建模
• 真實的性能擴展-在 CPU頻率上與實際應用程序類似地擴展,內核和線程、系統記憶體、存儲、GPU和其他功能
• 具有支持觸摸屏的直觀界面的輕量級安裝 – 簡化用戶從不到一分鐘的快速安裝過程開始的經驗,需要更少超過 1GB的存儲空間-用戶可以通過單擊或點擊屏幕開始基準測試
• 自動運行時支持-提供自動基準測試的選項,以簡化和簡化系統測量
• 在線系統性能數據庫-支持在線結果提交,以實現實時設備比較和評估
CrossMark Results
Ryzen 7 7700 Overall 2043、Productivity 1881、Creativity 2369、Responsiveness 1677
對照組
Ryzen 7 7700X Overall 2176、Productivity 2002、Creativity 2506、Responsiveness 1828
CrossMark Benchmark比較表
⇧單位: Performance Score (數字愈大愈好)
2.AIDA64 Cache & Memory Benchmark EXPO
AIDA64 Cache & Memory Benchmark可測量 CPU高速緩存和系統內存的帶寬和延遲。通過雙擊窗口中的任何矩形,列或行,我們可以單獨啟動基準測試或基準測試類型。例如,如果我們雙擊 “Memory”,則只會運行系統內存讀取,寫入,複製和延遲基準測試,即只執行給定行中的操作。同樣,如果我們雙擊 “Read”,則只會對所有內存類型運行讀取基準測試,即只執行給定列中的操作。如果我們雙擊任何矩形,則只會運行選定的單個基準
右鍵單擊 “Start Benchmark”按鈕將打開一個上下文菜單,我們可以在其中選擇運行所有基準測試或僅運行內存或緩存基準測試
Ryzen 7 7700 EXPO DDR 5 6000 30-38-38-96-CR1
AIDA64 Cache & Memory Benchmark Results
Read 69,172MB/s
Write.86,470MB/s
Copy.68,570MB/s
Latency 69.3ns
對照組
Ryzen 7 7700X DDR 5 6400 32-39-39-79-CR1
AIDA64 Cache & Memory Benchmark Results
Read 60,878MB/s
Write.90,469MB/s
Copy.61,326MB/s
Latency 65.1ns
3.Cinebench R23 CPU Test
Cinebench是一個真實的跨平台測試套件,用於評估計算機的硬件功能,現有最新版本已至 R23版本,由於它是 以 Cinema 4D動畫製作軟體為基礎進行測試,所以能夠反應出多線程處理器與顯示卡面對實際應用軟體所能發揮的效能,且能在短時間內得知測試結果,是一個能快速得知是否能 All Core 5GHz的測試軟體
Cinebench的改進反映了近年來 CPU和渲染技術的整體進步,為 Cinema 4D利用多個 CPU核心和普通用戶可用的現代處理器功能提供了更準確的測量,最重要的是它是免費的
Cinebench R23 Results
Ryzen 7 7700 1T 1928pts、nT 18914pts
對照組
Ryzen 7 7700X 1T 1982pts、nT 20011pts
Cinebench R23比較表
[/B]
⇧單位: Performance Score (數字愈大愈好)
4.PCMark10 applications benchmark
PCMark10 applications benchmark在 Microsoft Word、Excel、PowerPoint和 Edge中運行的測試通過Mark來通過實用測試針對適用於現代工作場所的性能、真實性的 PC進行測試,您還可以通過 Windows 11 PC進行,其結果可與基於 x86的傳統設備的基準測試相媲美
- 真實世界的表現
- 基於微軟應用程序的相關測試
- 測試和比較基於 Arm 和 x86 的設備
Ryzen 7 7700「Overall」 14545分
[/B]
對照組
Ryzen 7 7700X「Overall」 14357分
PCMark10 applications benchmark比較表
⇧單位: Performance Score (數字愈大愈好)
5.POV-Ray Benchmark
POV-Ray全名是 Persistence of Vision Raytracer,是一個使用光線跟蹤繪製三維圖像的開放原始碼自由軟體。運行 POV腳本語言。它是基於 DKBTrace來開發的,DKBTrace是由 David Kirk Buck和 Aaron A. Collins編寫在 Amiga上的。POV-Ray早期也受到了 Polyray raytracer作者 Alexander Enzmann的幫助。很多漂亮的圖片就是由 POV-Ray來製作的
Ryzen 7 7700 POV-Ray Benchmark Results 604.06
對照組
Ryzen 7 7700X POV-Ray Benchmark Results 574.02s
POV-Ray Benchmark比較表
⇧單位: Performance Score (數字愈大愈好)
6.3DMark CPU Profile
3DMark CPU Profile引入了一種新的 CPU基準測試方法。 3DMark CPU配置文件不是生成單個數字,而是顯示 CPU性能如何隨使用的內核和線程數量而變化。 3DMark CPU配置文件有六項測試,可幫助您對一系列場景的 CPU 性能進行基準測試和比較
3DMark CPU Profile Results
Ryzen 7 7700 Max threads 8613、16 threads 8601、8 threads 7301、4 threads 3946、2 threads 2043、1 threads 1053
對照組
Ryzen 7 7700X Max threads 9309、16 threads 9296、8 threads 5498、4 threads 3134、2 threads 2102、1 threads 1099
3DMark CPU Profile比較表
[/B]
⇧單位: Performance Score (數字愈大愈好)
7.WebXPRT3
WebXPRT 3是一個瀏覽器基準測試,可以比較幾乎所有支持 Web的設備的性能。它包含六個基於 HTML5和 JavaScript的場景,用於反映您每天執行的任務:照片增強、使用 AI 組織相冊、股票期權定價、加密筆記和 OCR掃描、銷售圖表和在線作業。使用 WebXPRT可以準確了解不同設備處理實際任務的情況,WebXPRT 是 Web基準測試的黃金標準,可以免費使用,並且可以直接從您的瀏覽器運行。立即嘗試或查看來自各種設備的發布結果
WebXPRT3 Results
Ryzen 7 7700 WebXPRT3 Results 454
對照組
Ryzen 7 7700X WebXPRT3 Results 396
WebXPRT3 Benchmark比較表
[/B]
⇧單位: Performance Score (數字愈大愈好)
8.UL Procyon Office Productivity Benchmark
UL Procyon Office Productivity Benchmark使用 Microsoft Office應用程式來衡量辦公室生產力工作的 PC性能,基準工作負載具有使用 Microsoft Word、Excel、PowerPoint和 Outlook的相關現實任務,該基準測試將測試性能與辦公室工作人員每天使用的相同應用程序的相關性與標準化測試的便利性相結合,每次都能產生一致、可重複的結果,更重要的是,Office Productivity Benchmark也很容易從 UL Procyon應用程式或命令行安裝和運行,無需提升權限或複雜的配置
Ryzen 7 7700 UL Procyon Office Productivity Benchmark Results 7045
對照組
Ryzen 7 7700X UL Procyon Office Productivity Benchmark Results 7381
UL Procyon Office Productivity Benchmark比較表
[/B]
⇧單位: Performance Score (數字愈大愈好)
9.WinRAR Benchmark
WinRAR為常用壓縮,支援多線程軟體,內建測試程式,其演算法由作者尤金·羅謝爾研發,享有原創專利
WinRAR Benchmark Results
Ryzen 7 7700 WinRAR 47,096KB/S
對照組
Ryzen 7 7700X WinRAR 59,774KB/S
WinRAR比 Benchmark比較表
[/B]
⇧單位: Performance Score (數字愈大愈好)
10.Geekbench5.4
Geekbench是一款跨平台的處理基準測試程序,其評分系統可分為單核和多核性能,以及模擬真實使用場景的工作負載能力。有 Geekbench 2、Geekbench 3,Geekbench4以及 Geekbench 5。軟體基準測試適用於 macOS、Windows、Linux、Android和 iOS。Geekbench 4、Geekbench5還測量 GPU性能包括圖像處理和計算機視覺等領域
Ryzen 7 7700 Geekbench5 Results Single-Core Score 2074 Multi-Core Score 14061
對照組
Ryzen 7 7700X Geekbench5 Results Single-Core Score 2070 Multi-Core Score 13700
Geekbench 5 Benchmark比較表
⇧單位: Performance Score (數字愈大愈好)
11.CPU-Z Bench
CPU-Z為一個中央處理器、記憶體及主機板資訊的 Windows軟體,在近年新增了 Bench item,提供處理器的快速簡單測試
Ryzen 7 7700 CPU-Z Bench Results Single Thread 757.2 Multi Thread 7674.2
對照組
Ryzen 7 7700X CPU-Z Bench Results Single Thread 772.5 Multi Thread 7779.3
CPU-Z Benchmark比較表
⇧單位: Performance Score (數字愈大愈好)
13.CPUMark99
Ryzen 9 7900 CPUMARK99 1190分
Ryzen 7 7700
CPUMARK99 1160分
對照組
Ryzen 7 7700X
CPUMARK99 1190分
CPUMark99 Benchmark比較表
[/B]
⇧單位: Performance Score (數字愈大愈好)
C.遊戲測試
測試諸元
Ryzen 7 7700
a.Far Cry 5 Benchmark
Far Cry 5 Benchmark《極地戰嚎5》
Far Cry 5《極地戰嚎5》是一個自帶 Benchmark的新遊戲,是由育碧蒙特婁、育碧多倫多開發和育碧軟體發行的開放世界第一人稱動作冒險遊戲
1080P Far Cry 5 Benchmark Ave Results
Ryzen 7 7700 Far Cry 5 1080P Benchmark Ave 199fps
對照組
Ryzen 7 7700X Far Cry 5 1080P Benchmark Ave 180fps
Far Cry 5 Benchmark 4K Ave Results[/B]
Ryzen 7 7700 Far Cry 5 4K Benchmark Ave 124fps
對照組
Ryzen 7 7700X Far Cry 5 4K Benchmark Ave 123fps
Far Cry 5 Benchmark比較表
[/B]
⇧單位: Performance Score (數字愈大愈好)
b.Assassin's Creed Origins Benchmark
Assassin's Creed Origins《刺客教條:起源》中國大陸譯作「刺客信條:起源」)是一部由育碧蒙特婁開發由育碧公司發行的動作冒險遊戲
本作是刺客教條主系列的第十部作品,也是系列首次把時間線推前到刺客教條初代以前,同樣也自帶有測試軟體,遊戲的舞台是在托勒密王朝埃及豔后統治下的埃及,玩家所操控的角色是一位隸屬於法老的護衛,稱為守護者(Medjai),來自錫瓦(Siwa)名為巴耶克(Bayek)的埃及刺客
Assassin's Creed Origins Benchmark 1080P Results
Ryzen 7 7700 1080P Assassin's Creed Origins Benchmark :19142分
對照組
Ryzen 7 7700X 1080P Assassin's Creed Origins Benchmark :16657分
Assassin's Creed Origins Benchmark 4K Results[/B]
Ryzen 7 7700 4K Assassin's Creed Origins Benchmark :12494分
對照組
Ryzen 7 7700X 4K Assassin's Creed Origins Benchmark :12395分
Assassin's Creed Origins Benchmark比較表
[/B]
⇧單位: Performance Score (數字愈大愈好)
c.UNIGINE Superposition Benchmark
UNIGINE是一款專有的跨平台遊戲引擎,由俄羅斯軟件公司 UNIGINE Corp開發。除了用作遊戲引擎外,它還用於虛擬現實系統,嚴肅遊戲和可視化
UNIGINE最強大的功能是它的高級渲染器,支持 OpenGL 4.0和 DirectX 11,Superposition則為 2017版本,包含極端性能和穩定性測試:視頻卡,電源,冷卻系統,檢查預設和超頻模式與真實負載及在環境中的互動體驗
UNIGINE Superposition Benchmark 1080P Extreme Results
Ryzen 7 7700 1080P UNIGINE Superposition Benchmark Extreme:11556分
對照組
Ryzen 7 7700X 1080P UNIGINE Superposition Benchmark Extreme:11480分
UNIGINE Superposition Benchmark 4K Optimazed Results[/B]
Ryzen 7 7700 4K UNIGINE Superposition Benchmark Extreme:16646分
對照組
Ryzen 7 7700X 4K UNIGINE Superposition Benchmark Extreme:16578分
UNIGINE Superposition Benchmark比較表
[/B]
⇧單位: Performance Score (數字愈大愈好)
d.3DMark Time Spy & Extreme
3DMark Time Spy用來測試處理器及顯示卡之 3D圖形表現和工作負載,現由 UL擁有,主要是針對 DirectX 12的效能,測試有三個部分,第一個為顆粒陰影、曲面細分等效果,第二個則是光線追蹤的體積光照明技術,最後則是 CPU效能測試,在前兩個測試中,包含了數千萬個頂點跟多邊形,上百萬個曲面細分,這些都是 FireStrike的幾十倍,而 3DMark Time Spy Extreme是 3DMark Time Spy的 4K版本,所有圖形都是 4K規格
3DMark Time Spy Benchmark Results
Ryzen 7 7700 3DMark Time Spy:19771分
對照組
Ryzen 7 7700X 3DMark Time Spy:19323分
3DMark Time Spy Benchmark比較表
[/B]
⇧單位: Performance Score (數字愈大愈好)
e.3DMark Time Spy Extreme
3DMark Time Spy Extreme Benchmark Results
Ryzen 7 7700 3DMark Time Spy Extreme:9385分
對照組
Ryzen 7 7700X 3DMark Time Spy Extreme:9348分
3DMark Time Spy Extreme Benchmark比較表
[/B]
⇧單位: Performance Score (數字愈大愈好)
f.Final Fantasy XV Benchmark
Final Fantasy XV《太空戰士 15》的 Benchmark,是一款由史克威爾艾尼克斯在 2016年 11月推出的動作角色扮演遊戲《Final Fantasy系列》的第 15部,依照傳統,太空戰士都有 Benchmark的項目
Final Fantasy XV Benchmark 1080P Results
Ryzen 7 7700 1080P Final Fantasy XV Benchmark:18656分
對照組
Ryzen 7 7700X 1080P Final Fantasy XV Benchmark:18463分
Final Fantasy XV Benchmark 4K Results[/B]
Ryzen 7 7700 4K Final Fantasy XV Benchmark:8238分
對照組
Ryzen 7 7700X 4K Final Fantasy XV Benchmark:8086分
Final Fantasy XV Benchmark比較表
[/B]
⇧單位: Performance Score (數字愈大愈好)
g.Far Cry 6《極地戰嚎6》
Far Cry 6《極地戰嚎6》(英語:Far Cry 6,中國大陸譯作「孤島驚魂6」)是一款由育碧多倫多開發並由育碧發行在 Amazon Luna、Microsoft Windows、PlayStation 4、PlayStation 5、Xbox One、Xbox Series X/S和 Google Stadia平台上的動作冒險第一人稱射擊遊戲,是極地戰嚎系列的第六部正統作品
《極地戰嚎6》支援 AMD FidelityFX Super Resolution (FSR)、AMD FreeSync Premium Pro,以及 AMD FidelityFX視覺工具套件,包括在未使用 FSR時的對比調適銳化(CAS)這項不受硬體限制的動態銳化濾鏡可改善低對比畫面區域的細節,提高影像清晰度並針對因後製而導致柔化的影像進行銳化處理,確保在激烈對戰時視線不會被阻擋
畫質設定:高
Far Cry 6 1080P Results
Ryzen 7 7700 Far Cry 6 1080P Result 171fps
對照組
Ryzen 7 7700X Far Cry 6 1080P Result 143fps
Far Cry 6 4K Results [/B]
Ryzen 7 7700 Far Cry 6 4K Result 107fps
對照組
Ryzen 7 7700X Far Cry 6 4K Result 106fps
Far Cry 6 Benchmark Benchmark測試比較表[/B]
⇧單位:fps數字愈大愈好, 元/fps數字愈小愈好
h.《 DIRT 5 》《大地長征 5》
《 DIRT 5 》《大地長征 5》是一款專注於越野賽車的賽車遊戲。遊戲中的紀律包括拉力賽,冰上賽車,體育場超級卡車和越野車。玩家可以在亞利桑那州,巴西,摩洛哥,中國,意大利,紐約市和挪威等眾多地區的比賽項目中比賽。遊戲包含動態天氣系統和季節,影響賽車;例如,玩家只能在冬季參加紐約的冰上比賽。遊戲中還引入了四人分屏系統
《 DIRT 5 》還具有敘述性的職業生涯模式,在一系列錦標賽中,玩家角色與競爭對手布魯諾·杜蘭德(Blano Durand)(由諾蘭·諾斯(Nolan North)表達)相對。玩家還有一位名為 Alex“ AJ”Janiček的導師(由 Troy Baker講),在整個職業生涯中為他們提供建議。
DIRT 5 1080P Results
Ryzen 7 7700 1080P Results:198.4fps
對照組
Ryzen 7 7700X 1080P Results:187.5fps
DIRT 5 4K Results
Ryzen 7 7700 4K Results:104.8fps
對照組
Ryzen 7 7700X 4K Results:104.8fps
DIRT 5 Benchmark測試比較表
⇧單位:fps數字愈大愈好, 元/fps數字愈小愈好
i.Assassin's Creed Odyssey《刺客信條奧德賽》
(英語:Assassin's Creed Odyssey,中國大陸譯作「刺客信條:奧德賽」) 是由魁北克育碧( Ubisoft Quebec)開發,育碧( Ubisoft)發行的動作角色扮演視頻遊戲。這是《刺客教條》系列的第十一個主要部分,總體上是第 21個,是 2017年《刺客教條》起源的繼任者。該情節設定於公元前 431-422年,講述了雅典和斯巴達之間的伯羅奔尼撒戰爭的神話歷史。玩家控制男性或女性傭兵(古希臘: μίσθιος misthios )在試圖團結家人的同時在衝突雙方中戰鬥的人
Assassin's Creed Odyssey 1080P Results
Ryzen 7 7700 1080P Results:153fps
對照組
Ryzen 7 7700X 1080P Results:129fps
Assassin's Creed Odyssey 4K Results
Ryzen 7 7700 4K Results:97fps
對照組
Ryzen 7 7700X 4K Results:94fps
Assassin's Creed Odyssey Benchmark測試比較表
⇧單位:fps數字愈大愈好, 元/fps數字愈小愈好
j.Total War: Three Kingdoms《全軍破敵:三國》
《全軍破敵:三國》(英語:Total War: Three Kingdoms,中國大陸譯作「全面戰爭:三國」)是一款由 Creative Assembly開發、由 SEGA發行的回合制策略遊戲。該遊戲原計劃於 2018年秋季發售,後經過兩次跳票延期至 2019年 5月 23日發售,首周單周銷量達 100萬,19萬玩家同時線上,創下全軍破敵系列之最
Total War: Three Kingdoms 1080P Results
Ryzen 7 7700 1080P Results:166.8fps
對照組
Ryzen 7 7700X 1080P Results:161.1fps
Total War: Three Kingdoms 4K Results
Ryzen 7 7700 4K Results:60.2fps
對照組
Ryzen 7 7700X 4K Results:58.8fps
Total War : Three Kingdoms Benchmark測試比較表
⇧單位:fps數字愈大愈好, 元/fps數字愈小愈好
評比 :
非 X版之 Ryzen 7 7700處理器除了能在遊戲的領域中表現出極佳的效能之外,同時也兼顧了內容創作的效能,是個全能型的桌上型處理器;但因為 Ryzen 7 7700的功耗只有 65W的關係,原本滄者以為會因此而拉大了與 Ryzen 7 7700X處理器的效能差距,但從以上各項測試比較表中可以看出,TDP只有 65W的 Ryzen 7 7700,其在內容創作的效能表現仍是中規中矩,而其在遊戲幀數的表現上與 Ryzen 7 7700X的差距更少,加上非 X版本的 Ryzen 7 7700的售價較 X版低,還隨盒附贈 Wraith Prism RGB LED CPU cooler,讓Ryzen 7 7700成為低價版本之 12 核心處理器
非 X版 Ryzen 7000系列桌上型處理器在跟 Ryzen 5800X相比時,「Zen4」因為新增了對 AVX-512的支援,借助新前端設計、存取、分支預測、執行引擎以及 L2 Cache,因此實現了在 IPC效能對「Zen3」有大幅的提升,相較 Ryzen 5000X系列處理器,非 X版 Ryzen 7000系列桌上型處理器反而在功耗只有 65W的情況下仍對 Ryzen 5800X的勝出
在 WinRAR解壓縮的比較表中,所有的 Ryzen 7000系列處理器與 Ryzen 7 5800X及 Ryzen 5 5600X之比較,Ryzen 7000系列處理器均能勝出
在 CPUMARK99運算測試比較表中,所有的 Ryzen 7000系列處理器與 Ryzen 7 5800X及 Ryzen 5 5600X之比較,Ryzen 7000系列處理器均能勝出
在 CPU-Z Bench測試比較表中,所有的 Ryzen 7000系列處理器與 Ryzen 7 5800X及 Ryzen 5 5600X之比較,Ryzen 7000系列處理器均能勝出
在 POV-Ray Benchmark測試比較表中 (數字愈小愈好) ,所有的 Ryzen 7000系列處理器與 Ryzen 7 5800X及 Ryzen 5 5600X之比較,Ryzen 7000系列處理器均能勝出
在 Assassin's Creed Origins Benchmark測試比較表中 (數字愈大愈好) ,所有的 Ryzen 7000系列處理器與 Ryzen 7 5800X之比較,Ryzen 7000系列處理器均能勝出
在不犧牲太多的效能下,非 X版 Ryzen 7000系列處理器更能降低功耗因而達到更省電的目的,從底下的 Cinebench R23 Benchmark比較表可以看出省電版的 Ryzen 9 7900、Ryzen 7 7700、Ryzen 5 7600其效能還是挺優質的,不過其實無論是何種規格的 AMD處理器,相對友商 AMD的進步是大家有目共睹的,玩家只需按照個人的需求去從 AMD Ryzen 7000系列處理器中選擇適合自己的處理器就好
Cinebench R23 Benchmark比較表
⇧單位: Performance Score (數字愈大愈好)
在這 DDR5、PCIE 5.0的跨世代變革之際,AMD之 AM5平台已不再對 DDR4平台的支持,經過測試比對在 DDR5頻率方面在與友商的 DDR5頻率相比時,滄者覺得 AMD還得加油,我想這多半與 AMD給主機板廠商對 BIOS的開放權限程度,不如友商來的高有關
一個成功的處理器除了要做到出眾的效能之外還必須擁有親民的售價,通過本篇測試之後,除了 Ryzen 3系列處理器之外,所有的 Ryzen 7000系列處理器也都已經完測;以新品來說非 X版本的 Ryzen 7000系列處理器不但附贈了 CPU散熱器而且價格更加親民,確實是非常值得考慮預算的玩家入手
AMD自 2017推出第一代 Ryzen桌上型處理器發表至今已經 5年多,Ryzen桌上型處理器由漸入佳境至碩果累累,Ryzen桌上型處理器一代強於一代之效能也有目共睹,AMD秉持突破再創新,並以「Zen4」繼續引領遊戲與內容創作之高性能先驅以滿足使用者需求,而今年 AMD還會在 AM5平台上推出代號「Phoenix Point」擁有 8核心 16線程,12個 CU RDNA 3內顯的 APU,以及採用 4nm,3nm製程的「Zen5」也預計將在今年問世,謝謝收看