前言:
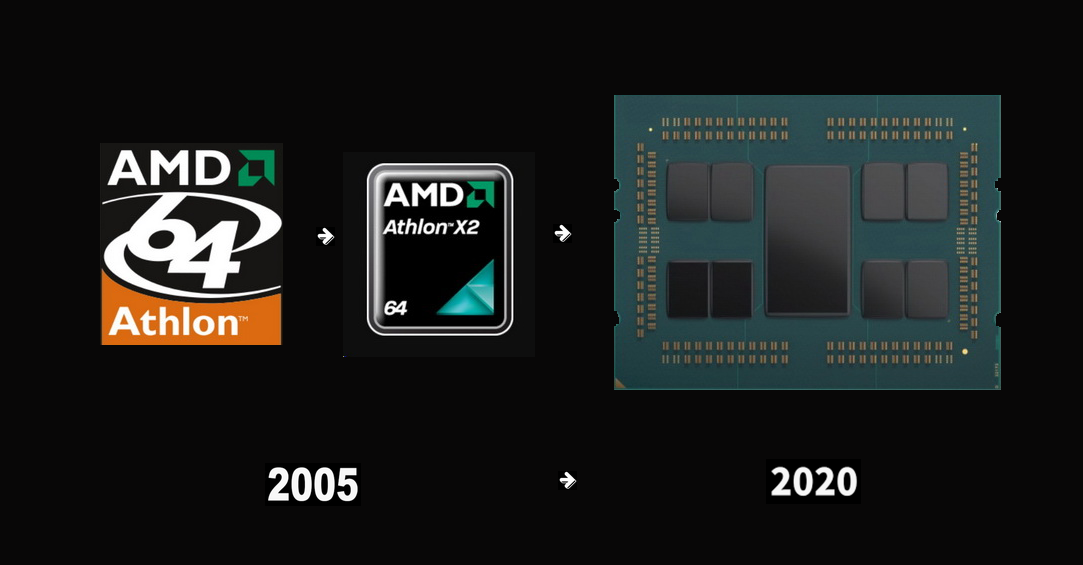
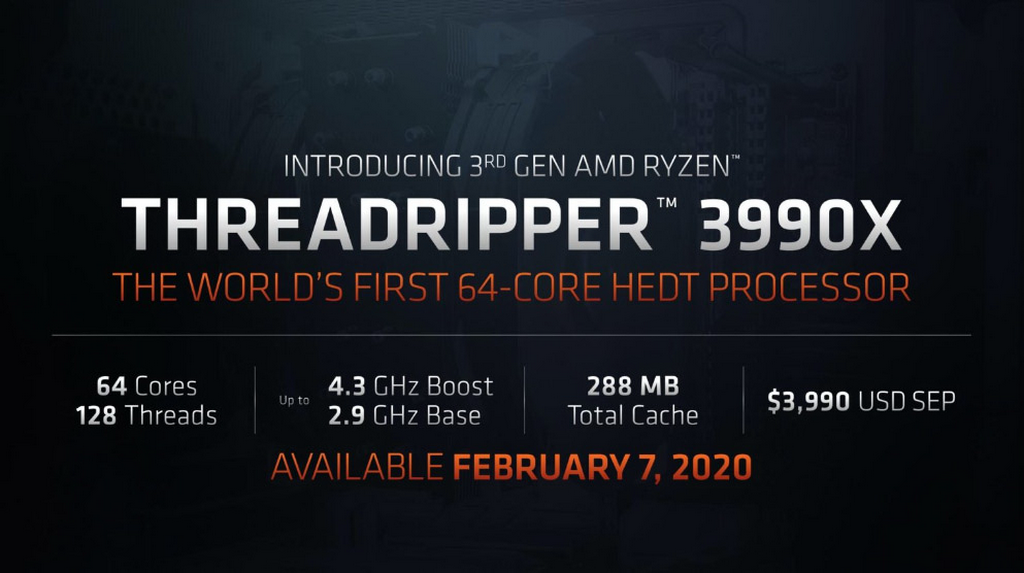
還記得 AMD的第一款雙核心桌上型處理器是在 15年前 2005年 5月誕生的嗎?從此桌上型處理器步入了多核心時代,而在 15年後的今天,全球首顆 64核心桌上型處理器 Ryzen Threadripper 3990X解禁開賣了
這顆 3990X與才在 3個月前上市的 3970X同為 TR 3000家族,同為 TSMC 7nm製程,而 3990X的上市讓桌上型處理器核心數在短短 3個月成長了 2倍,在 15年間成長了 64倍,也讓 AMD穩居多核心桌上型處理器的霸主
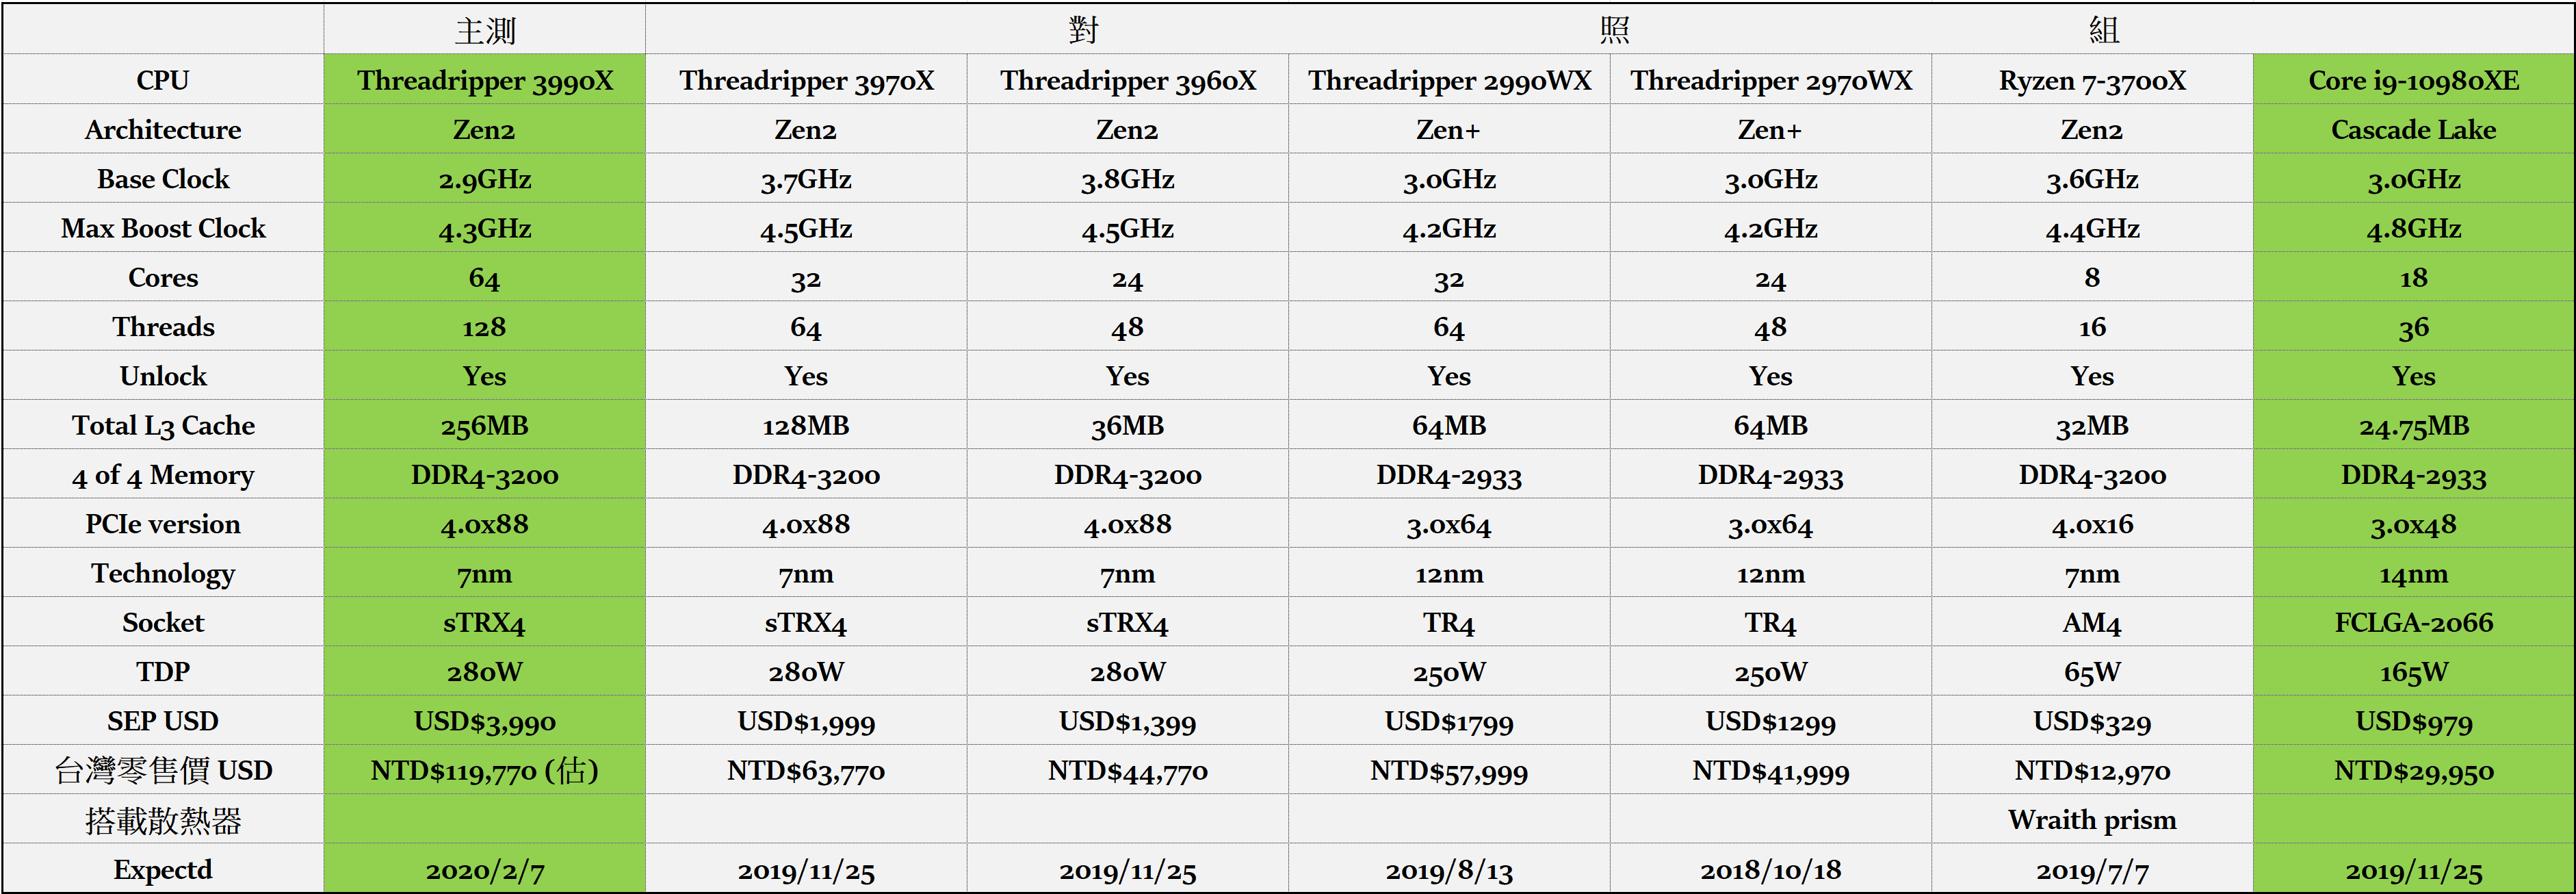
3990X的基礎核心頻率為 2.9GHz (3970X為 3.7GHz ) Boost頻率為 4.3GHz (3970X為 4.5GHz ) ,Total L3 Cache為 256MB (3970X為 128MB )、PCIE 4.0同為 88 Lanes、TDP同為 280W、4通道最大速度 DDR4 3200,並支援 ECC Memory
為了控制 TDP在相同的情況下,從 3990X與 3970X的頻率比較可看出,當處理器的核心數愈多其基礎頻率就愈低,至於該如何維持核心數與頻率之間的平衡 (多工效能與單工效能間的平衡) 在開發多核心成為趨勢的當下則將是廠商必須面對的課題
在定價方面 3990X則因為核心數倍增的關係器其預定售價 $3,990美元 (相當於台幣 $120,000元) 也是 3970X的 2倍,但 3990X是不是值得這個價當您耐心的看完本篇之後心中自有答案,稱 3990X為創作者或發燒級玩家的夢幻極品並不為過


滄者極限也在前幾天受邀對這顆 3990X Sample進行測試,測試的設定除了有別於官方的預設頻率而改以在多工創作 4.0GHz、4.1GHz,單工 4.5GHz,遊戲 4.0GHz進行之外,測試的軟體則有多工的 Corona、POV-Ray、Cinebench R15、R20、CPU-Z Bench、7-Zip、X264 FHD Benchmark、V-Ray Benchmark、Geekbench,以及單工、遊戲、浮點運算,3990X在不同頻率的測試結果並會與不同核心數的對照組 Core i9-10980XE、3970X、3960X、3700X、2990WX做比對,以分析在不同核心數不同處理器頻率的設定下,對多工創作及單工遊戲的影響,敬請持續關注
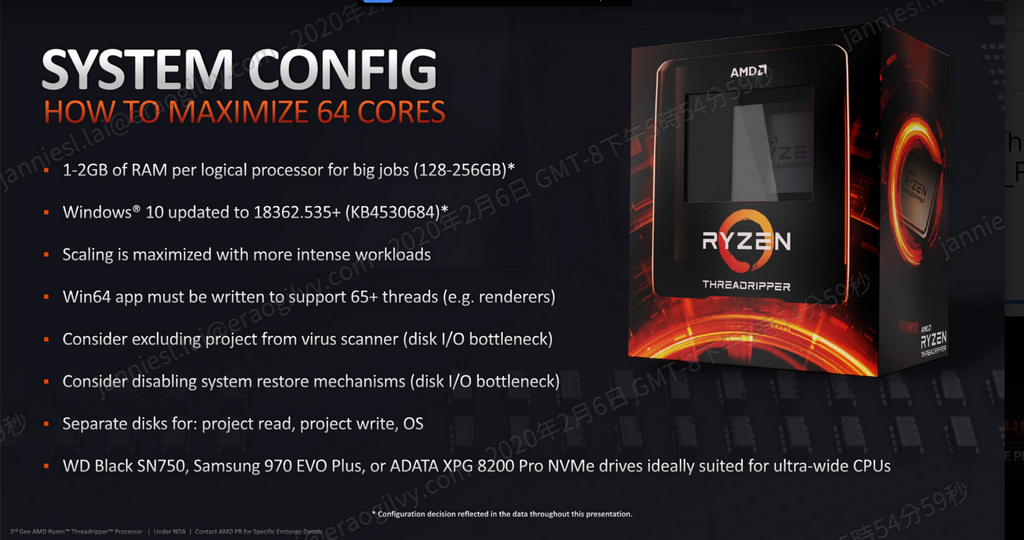
3990X官方系統配置建議
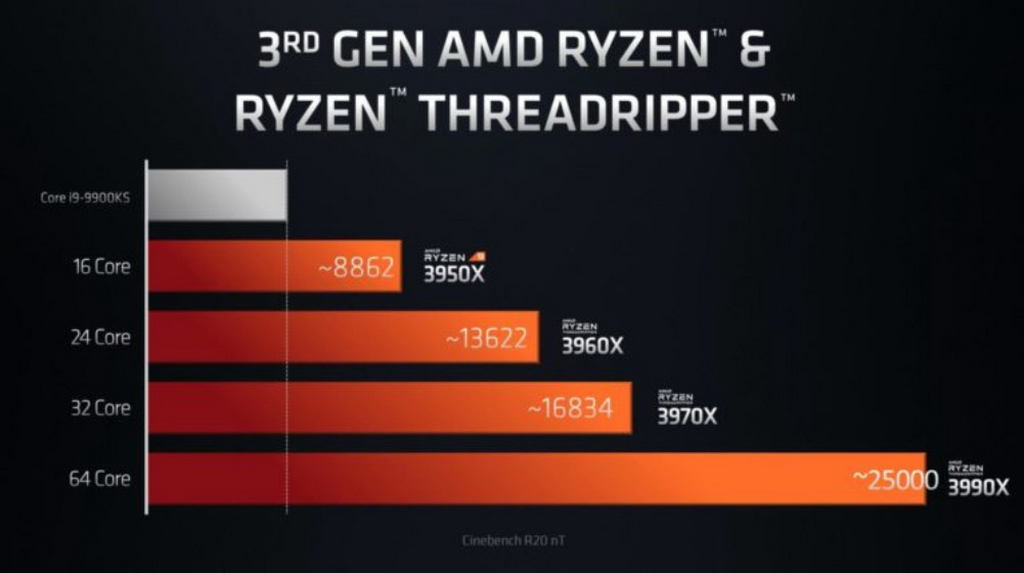
3990X官方效能介紹
3990X在官方 Cinebench R20的分數為 25000左右,是 3970X的 1.48X,是 3960X的 1.83X,是 3950X的 2.82X
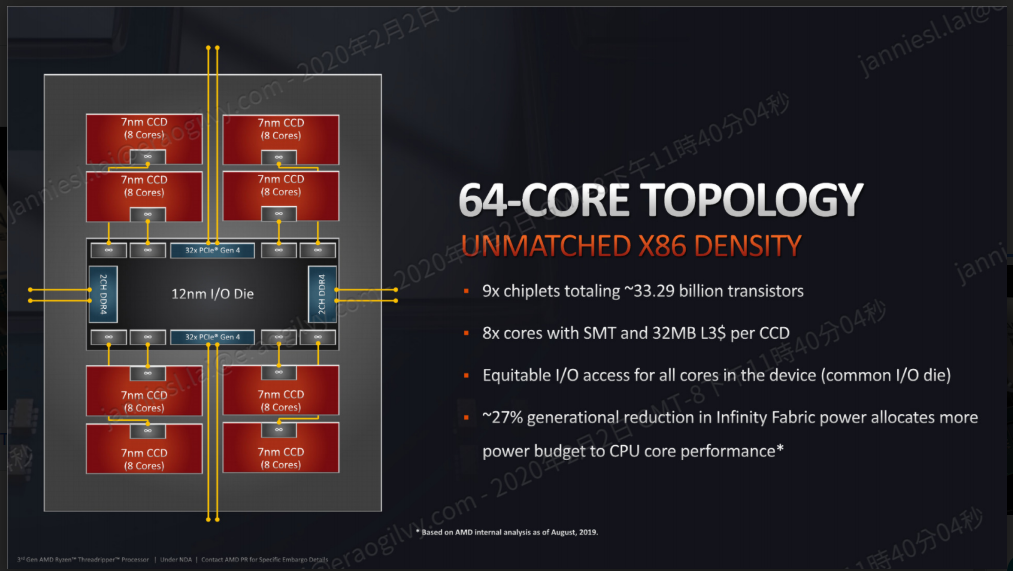
64-Core Topology
3990X的 Topology架構,在中間的是 12nm製程的 I/O die,上下則各有 4個 7nm的 Chiplet,每個 Chiplet有 8Cores,每個 Chiplet並各自擁有 32MB的 L3 Cache,各個 Chiplet透過 Infinity Fabric技術連結到中間的 I/O die,Zen 2的 Infinity Fabric技術降低了 27%的功耗,並且可為 CPU核心分配到更多的電量與更高的效能,各個 Chiplet均具有與 I/O die的直接 IFOP連接,從而可以公平地獲取 DRAM和 PCIe資源,每個 IFOP鏈路均以1600Clock提供 51.2GB/s的讀取速度和 25.6GB/s的寫入速度
因為 Chiplet的配置可使處理器擁有更快的 DRAM和更高的核心頻率,在文件壓縮之類的處理速度上更提高了 2倍
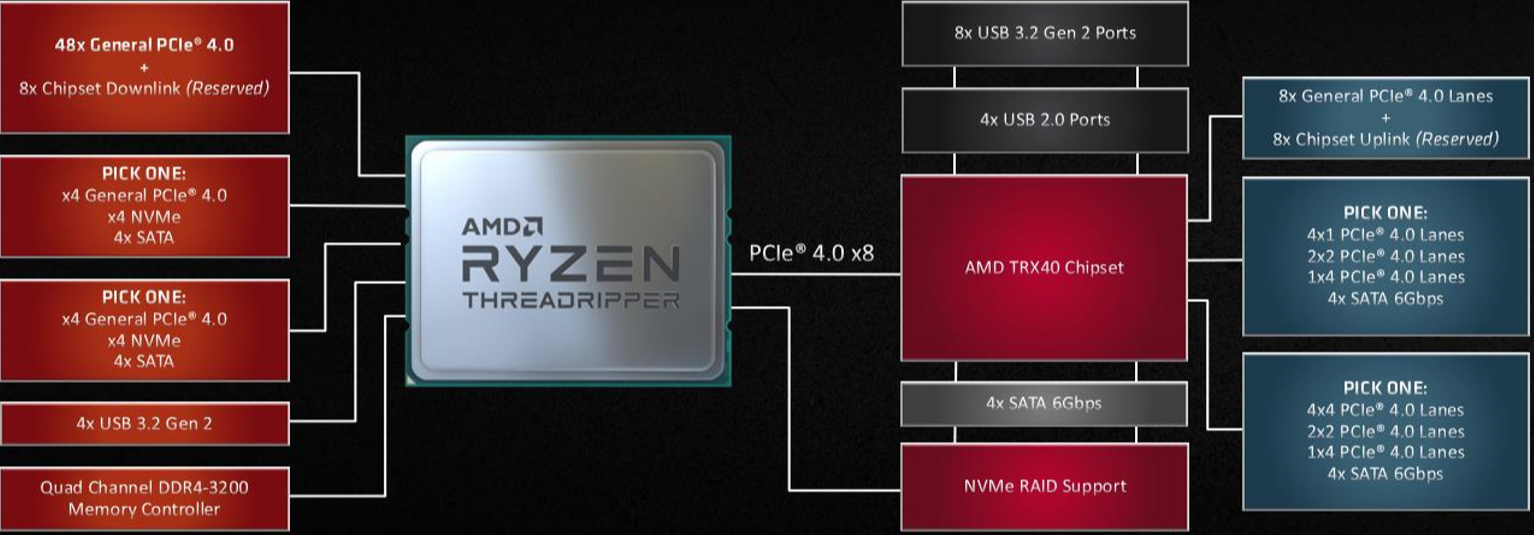
AMD TRX40 Chipset
Threadripper 3000的 PCI Express升級到 PCIe Gen 4,在處理器和 TRX40之間的頻寬也較上一代增加了 4倍,可用的 PCIe Lanes也從之前的 60 Lanes增加到 72 Lanes,跟 X299平台相比 TRX40的頻寬多了 2.5倍
Cinebench R20 nT Performance

V-Ray Performance

Cinebench R20 Performance

POV-Ray Performance

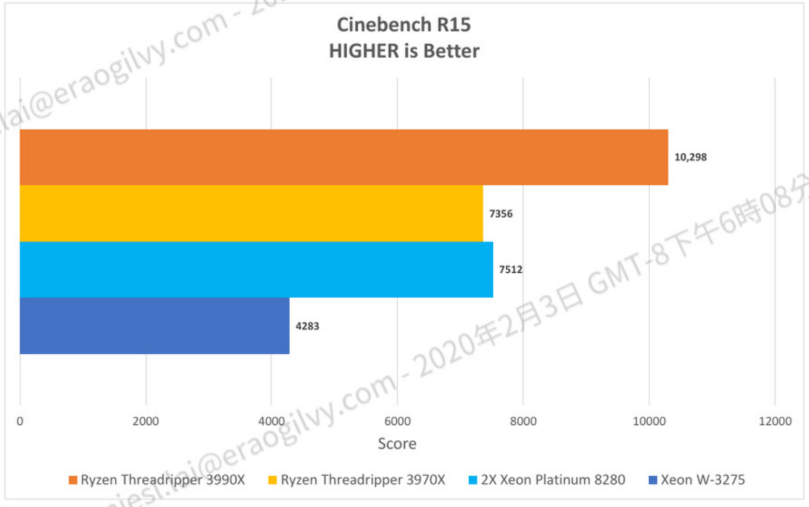
Cinebench R15 Performance
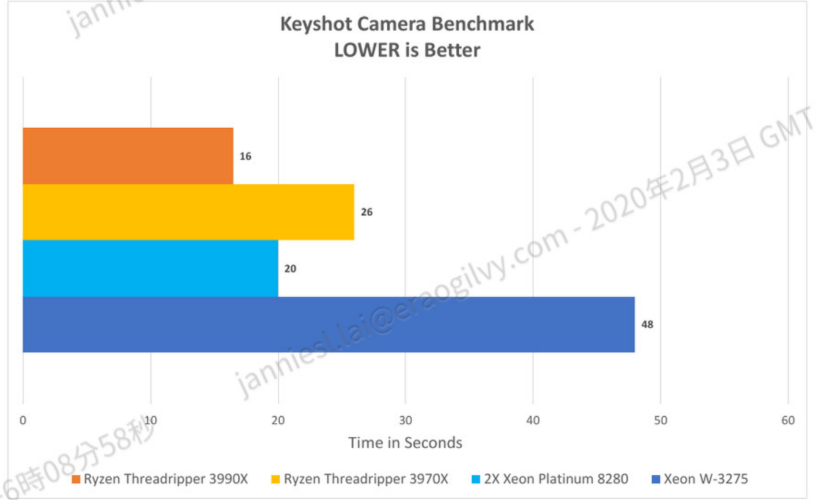
Keyshot Camera Benchmark
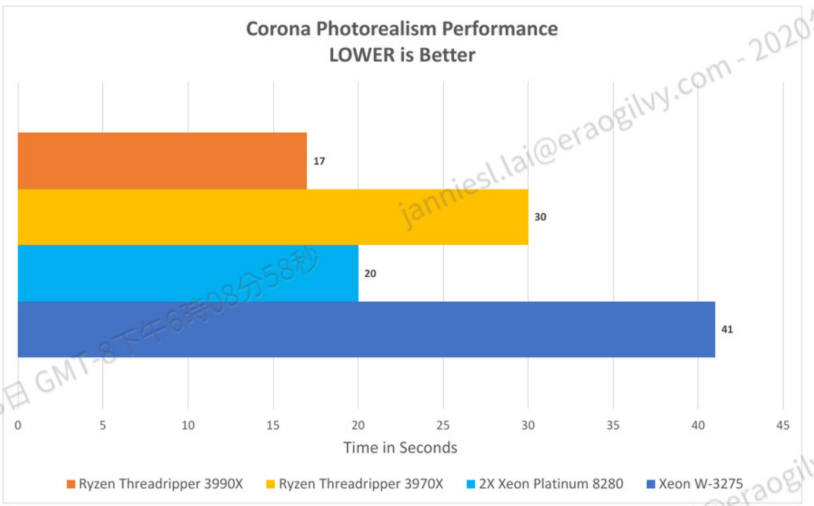
Corona Benchmark
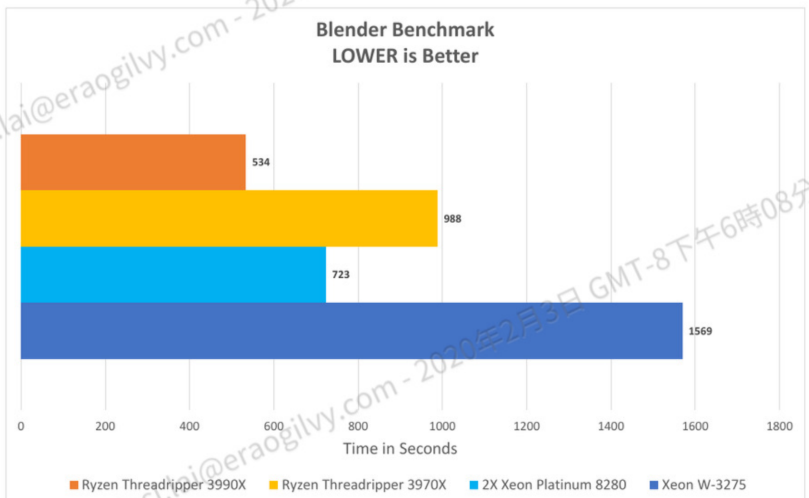
Blender Benchmark
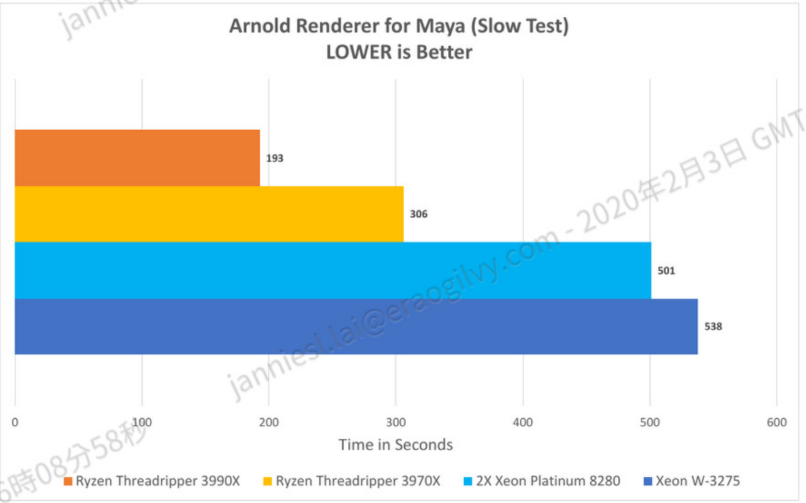
Arnold Renderer for Maya test
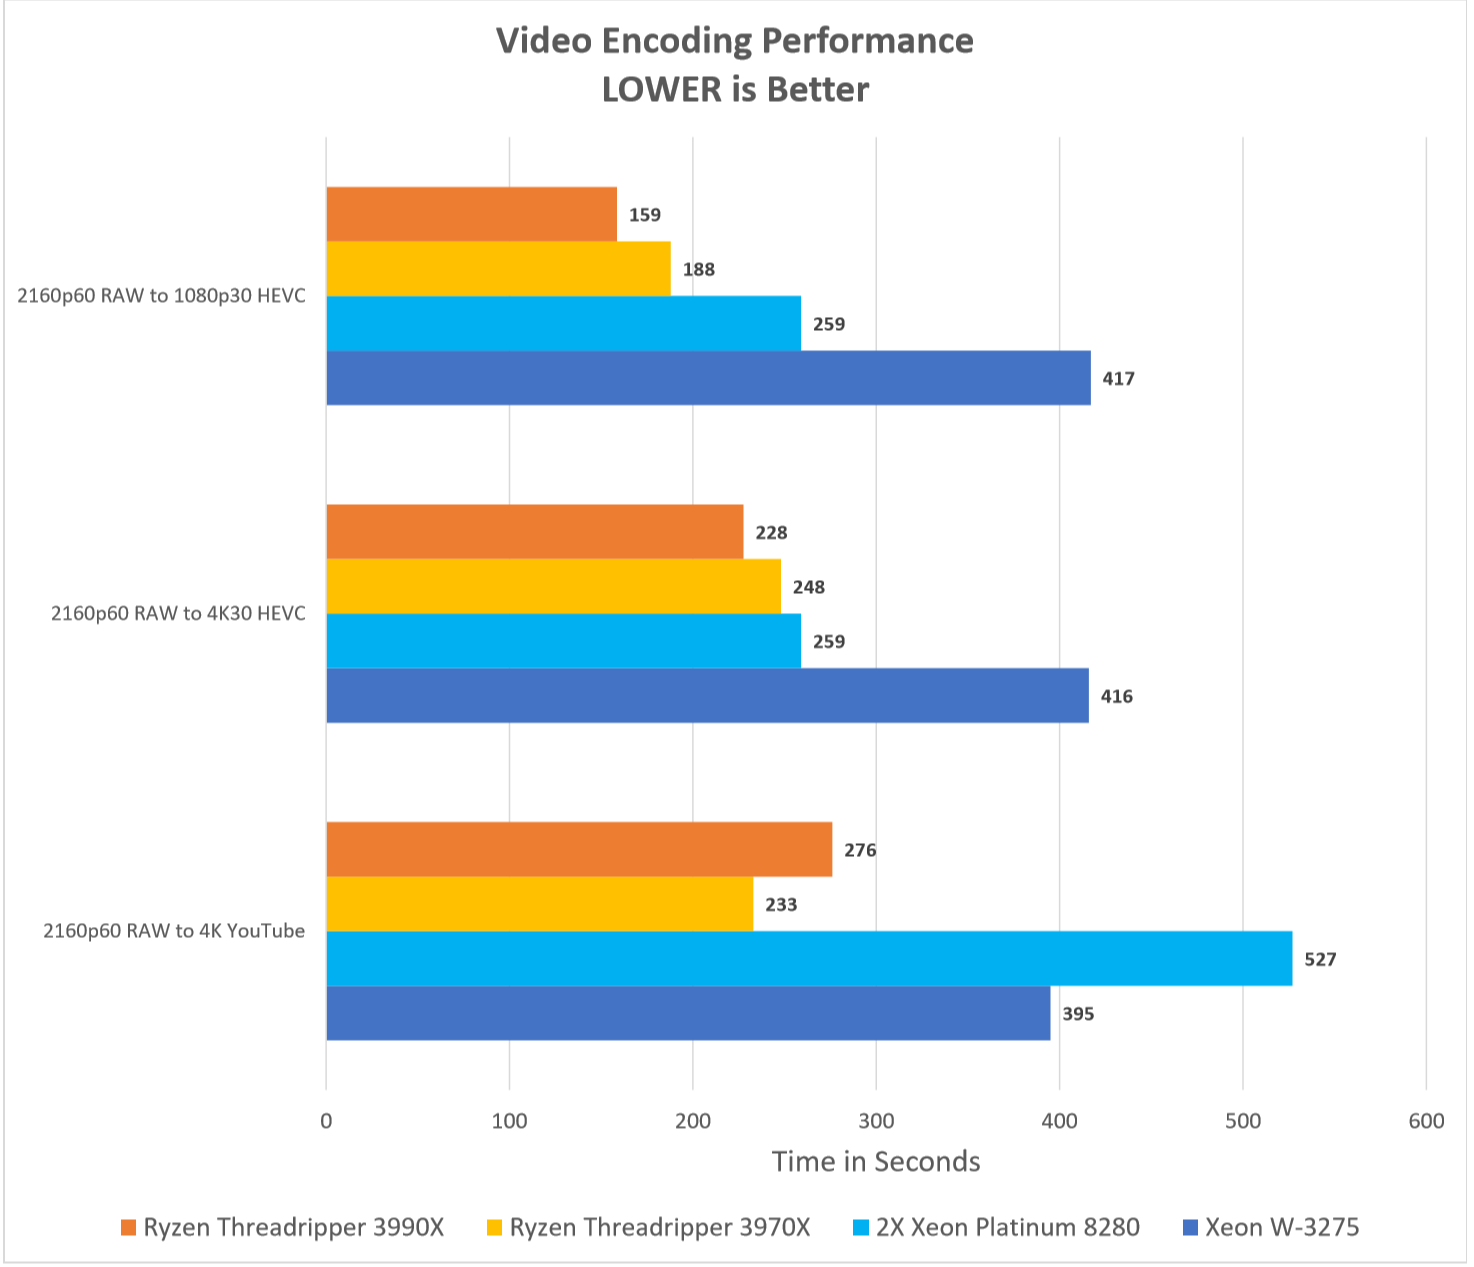
Vedio Encoding Performance
CHAOS Group V-Ray

Xeon W-3275 VS 3990X VS 3970X
3D Rendring

Movie Mastering & Encoding

Software Compiling

從以上的官方效能介紹中可以看出,3990X在預設時的表現就已經是當前最強的創作型處理器,接著就來看看 3990X設在 4.0~4.1GHz時是否能穩定通過各項創作及多工的測試,以及在 4.0~4.1GHz的設定下其各項實測的效能又將能增加多少
3990X開箱
在看測試前先來看看 3990X的開箱與安裝
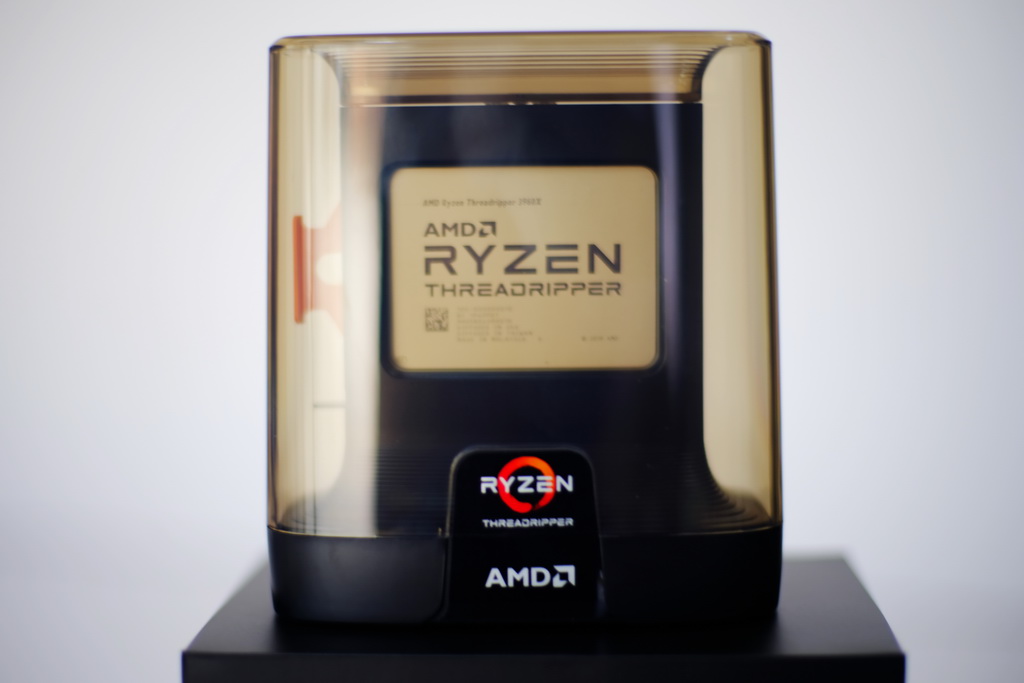
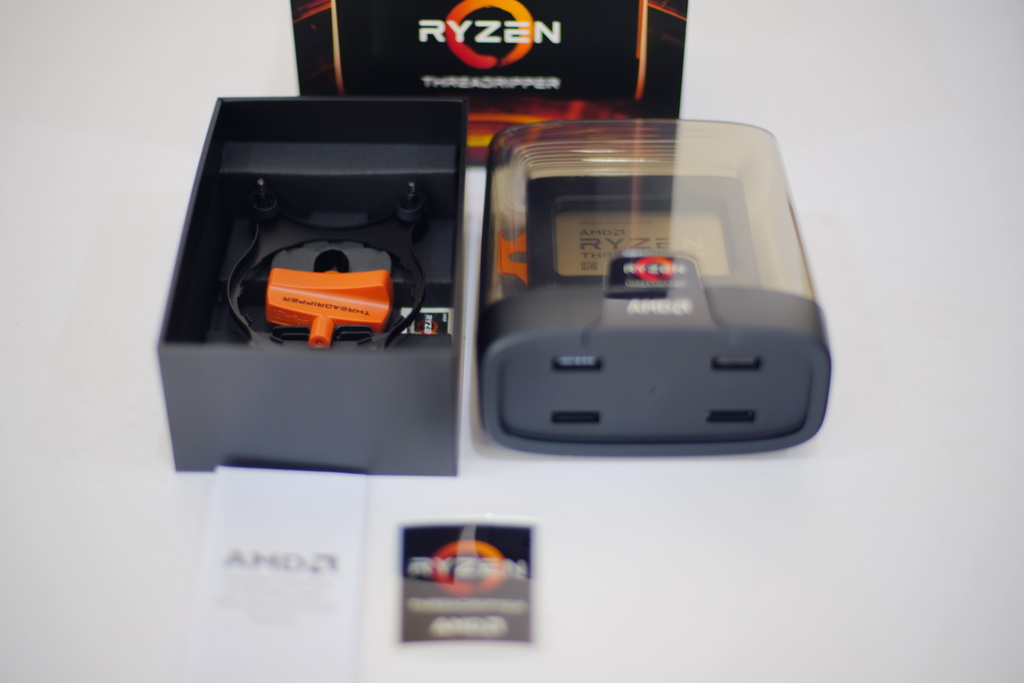
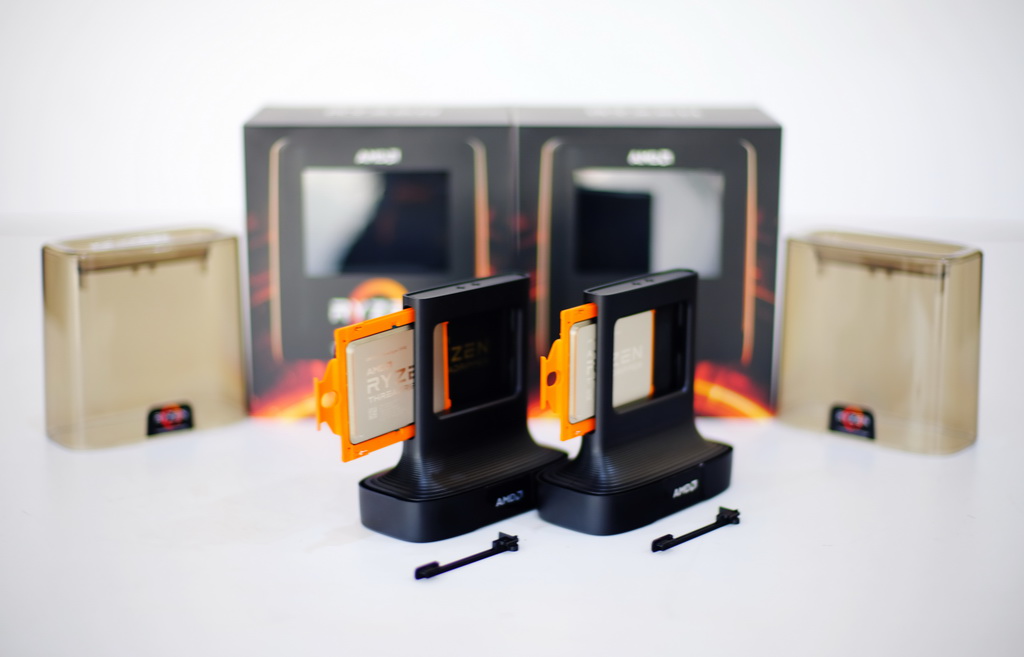
3990X處理器外盒其實是與 3970X相同的,將處理器外盒移開後先將裝有處理器的塑膠盒從底座盒中取出,這時就可以看見底座盒內還放有水冷轉接架、Socket座扭力扳手、說明書、貼紙
接著再將處理器塑膠盒上之 AMD LOGO標籤貼紙切開,就可以將透明塑膠蓋掀開,並將裝有 3990X的保護盒取出
在保護盒的一側可以看到外露的處理器助裝器 (橙黃色的小耳朵) 由一個卡榫固定住
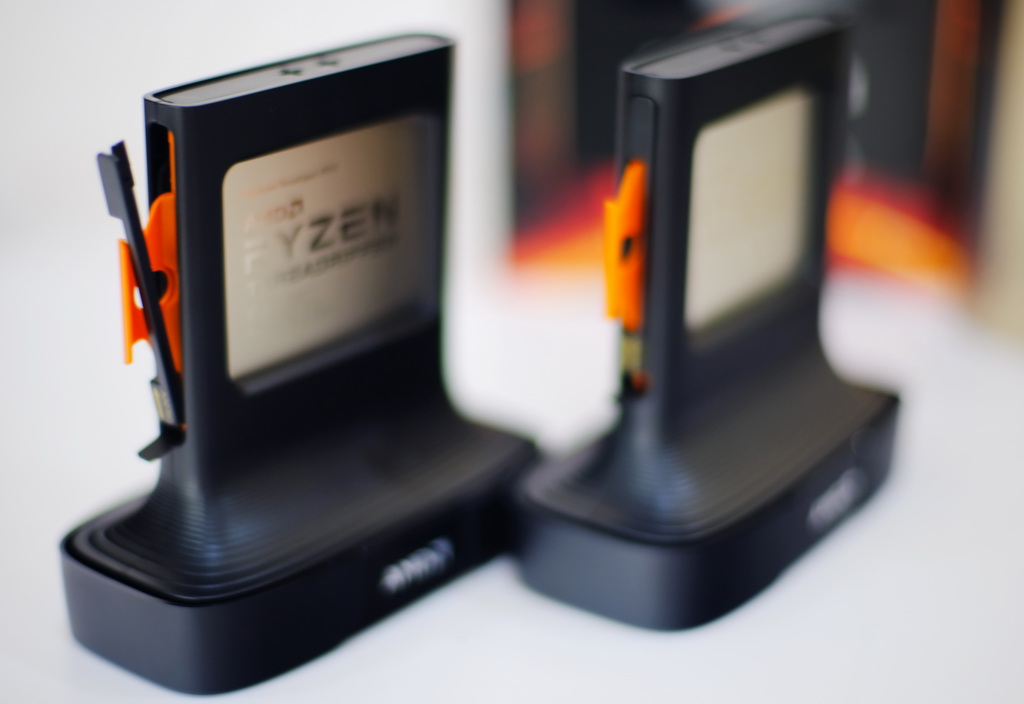
先將卡榫往下壓就可以將卡榫移除,然後再拉住橙黃色的小耳朵往外抽,就可以將處理器從保護盒中取出了
3990X處理器的安裝
先將 Socket蓋掀起,再握住助裝器小耳朵連同處理器從 Socket蓋上端邊緣的槽中慢慢的插入
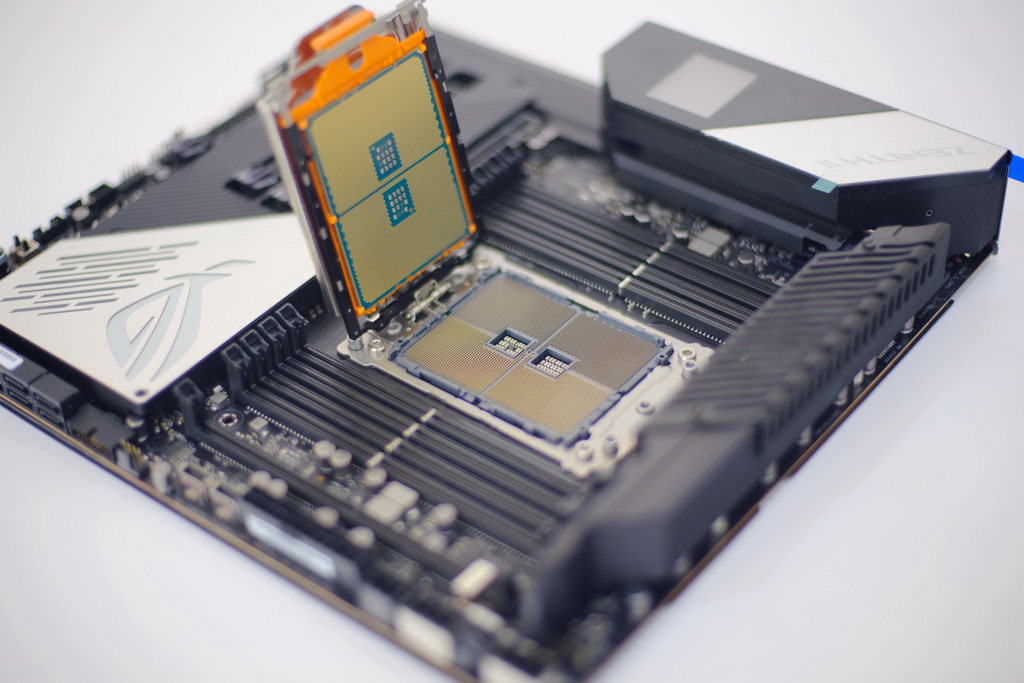
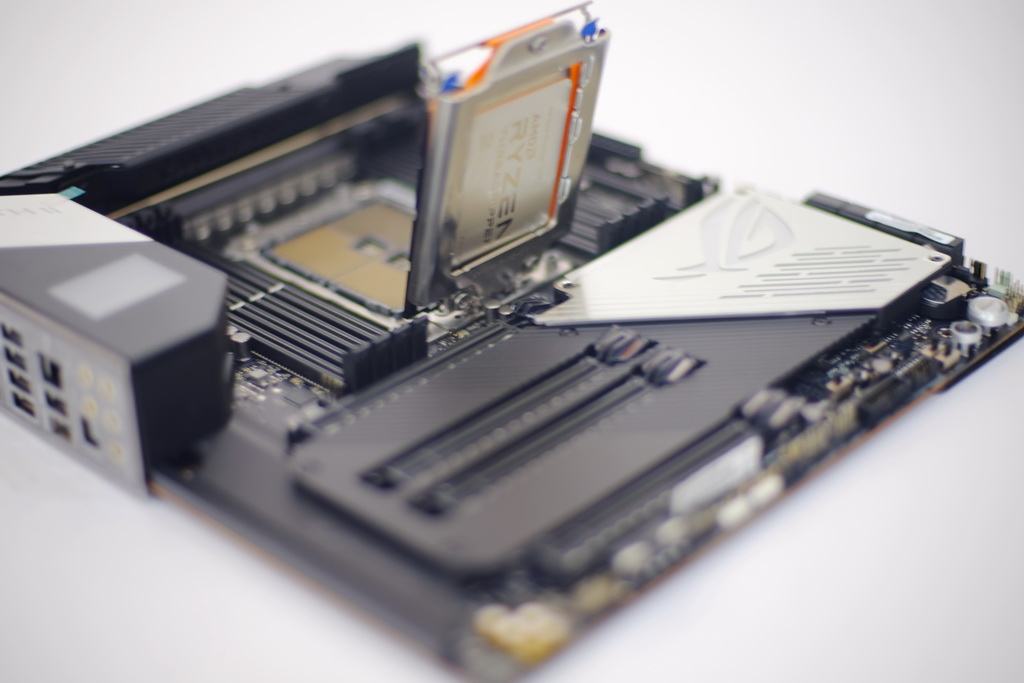
待處理器插入底處並確認與 Socket蓋完全密合後就將 Socket蓋下壓扣緊
接著再以配件中所附的扭力扳手將位於 Socket座的 3顆螺絲按照 Socket上之 1~2~3的順序鎖緊,欲取出處理器時則反向為之

測試平台
CPU1:AMD Ryzen Threadripper 3990X
CPU2:AMD Ryzen Threadripper 3970X
CPU3:AMD Ryzen Threadripper 3960X
CPU4:AMD Ryzen Threadripper 2990WX
CPU1~4 cooler:Wraith Ripper官方散熱器
CPU5:AMD Ryzen 7-3700X
CPU5 cooler:Wraith Prism原廠散熱器
CPU6:Intel Core i9-10980XE
CPU6 cooler:Thermalright IB-E Extreme
M/B1 :ASUS ROG Zenith II Extreme Alpha X399 BIOS 0807
M/B2:GIGABYTE AORUS TRX40 XTREME
M/B3:ASUS ROG RAMPAGE VI EXTREME ENCORE BIOS 0401
MEM1 :G.SKILL Trindent Z RGB 16GBX8 128GB DDR4 3600同步 QUAD Channel
MEM2 :G.SKILL Trindent Z RGB 8GBX4 32GB DDR4 3600同步 QUAD Channel
SSD:CORSAIR Force MP600 Gen4 PCIe x4 NVMe M.2 SSD 2TB
OS :WIN10 64bit 1909
Graphic Card:ASUS ROG STRIX RTX 2080 TI 11GB
PSU:Thermaltake 1200W
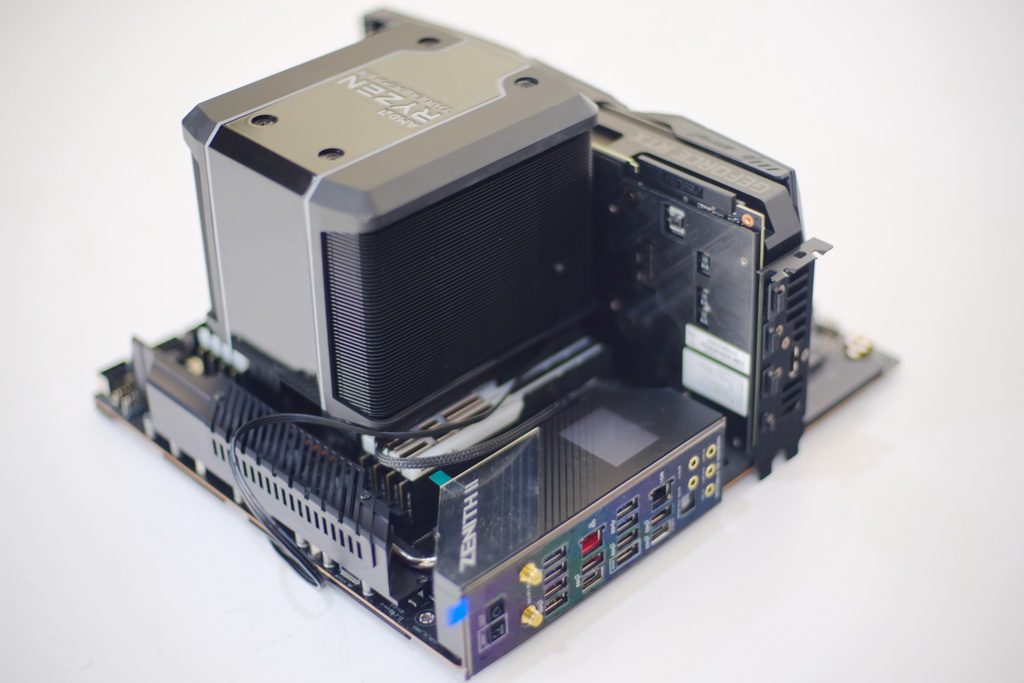
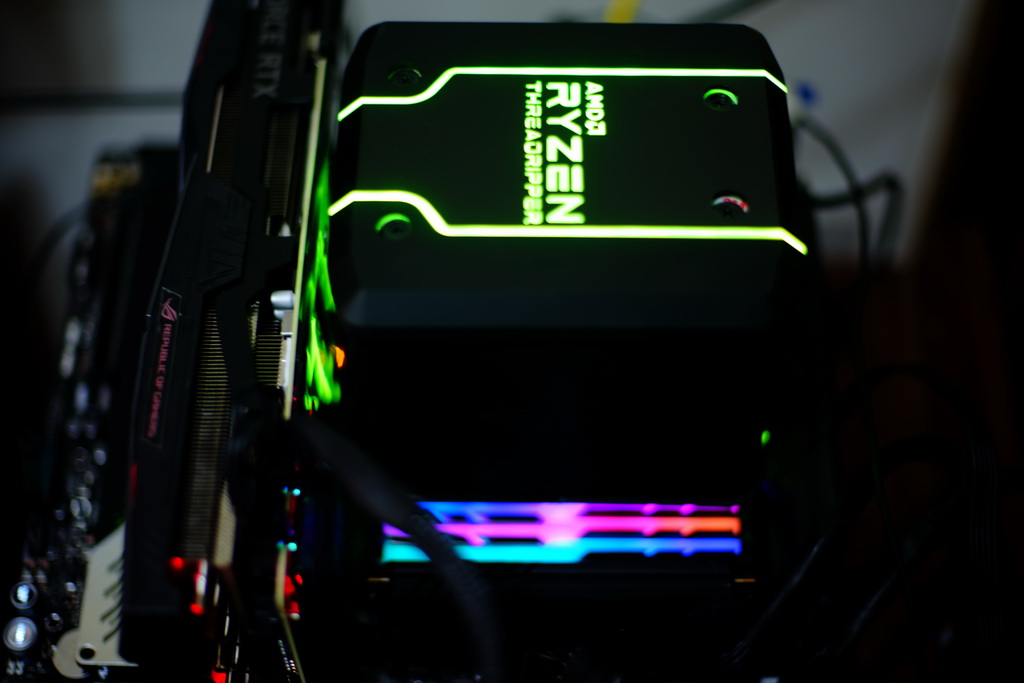
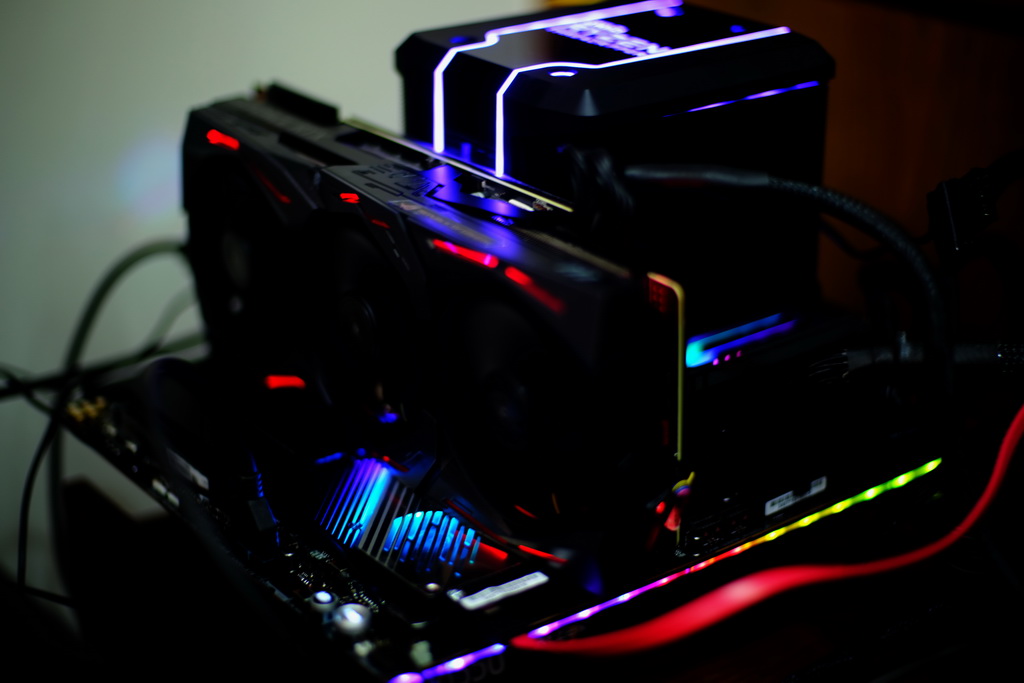
3990X平台照


測試項目 A:
1.Corona Benchmark
2.POV-Ray
3.Geekbench
測試設定:
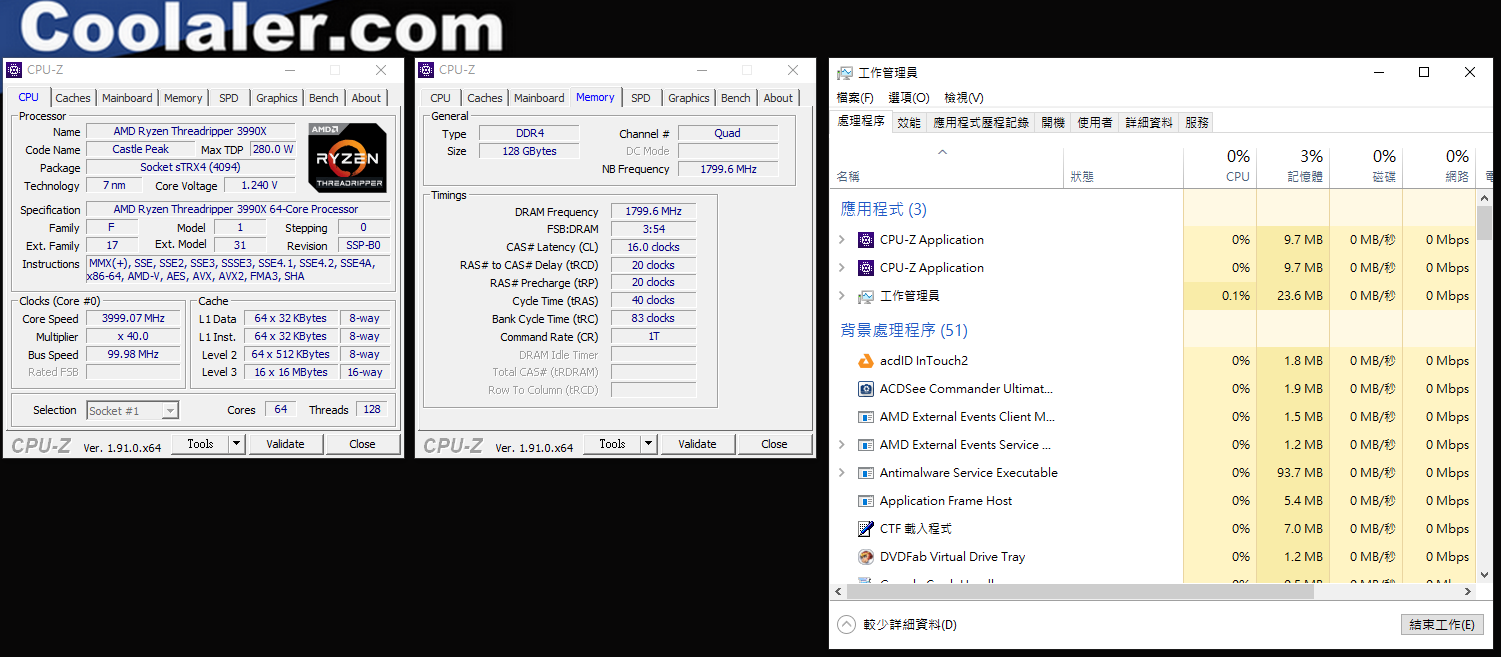
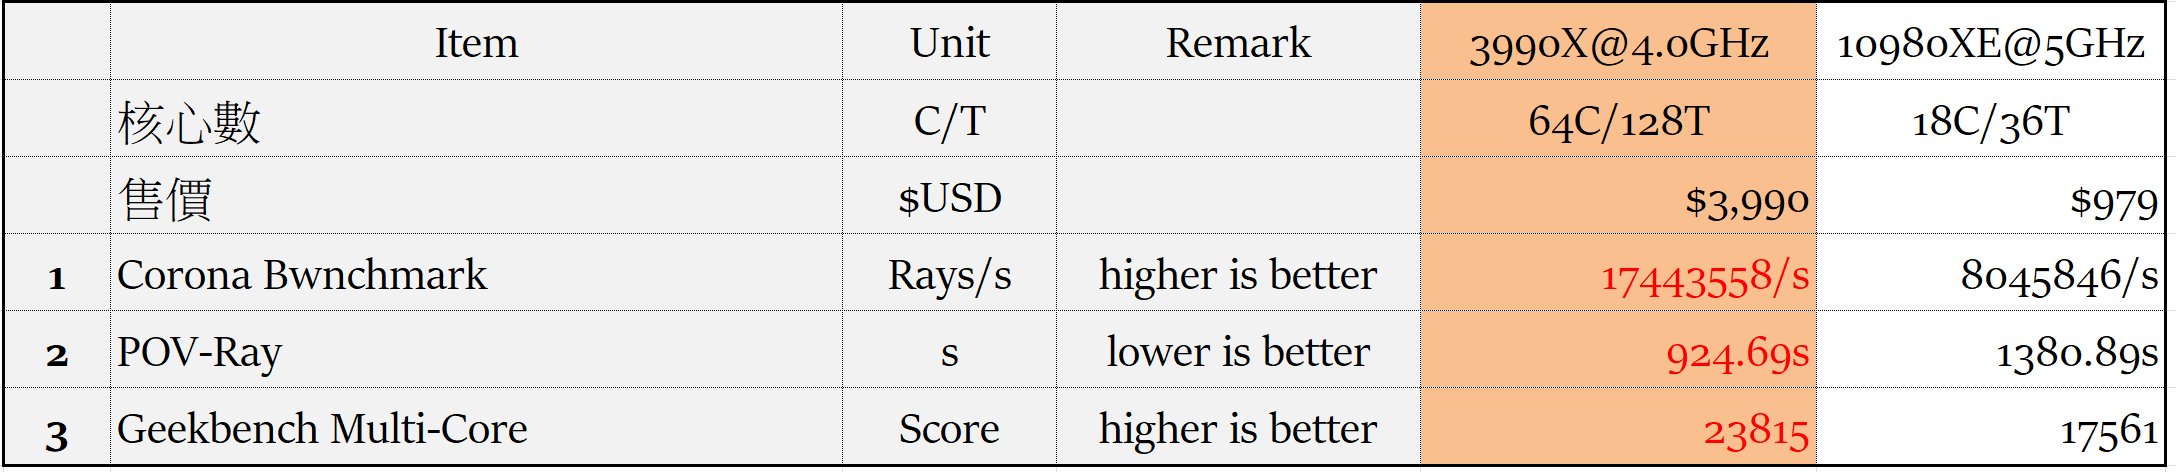
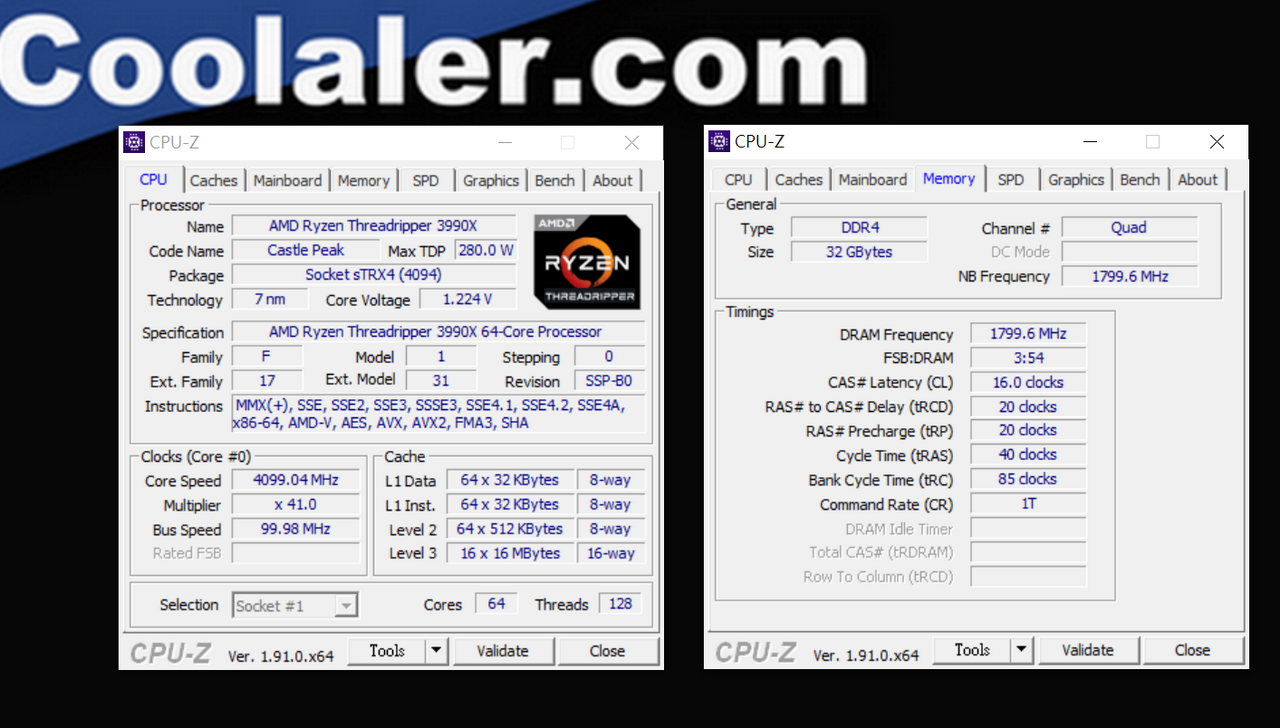
3990X@4.0GHz DDR4 3600 128GB同步
對照組10980XE@5GHz

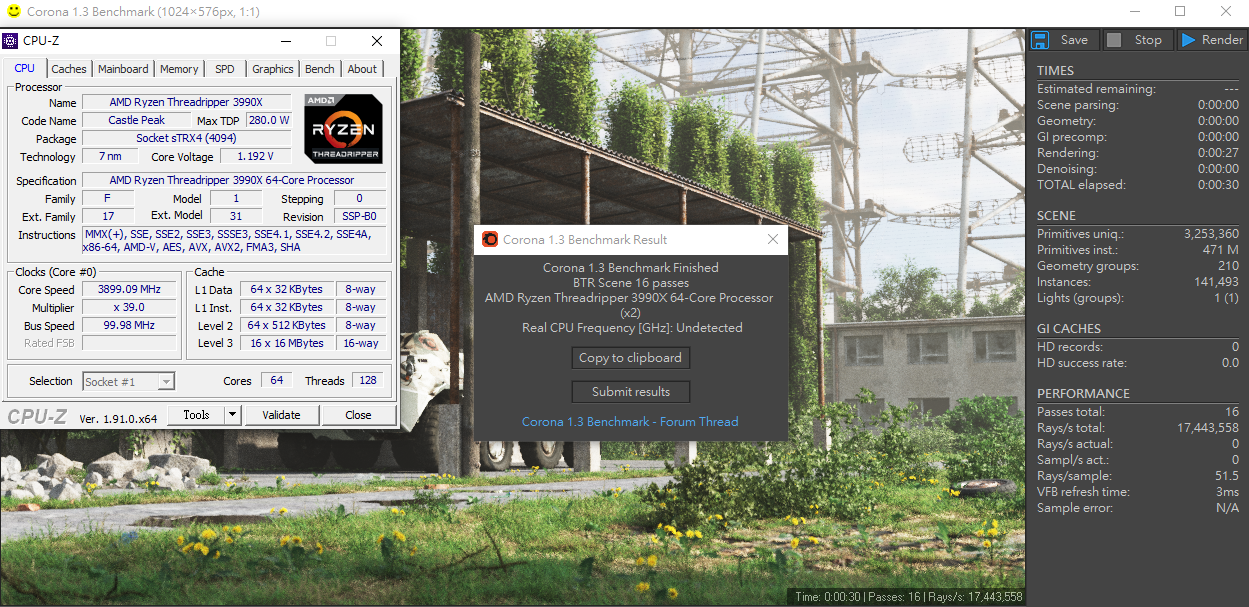
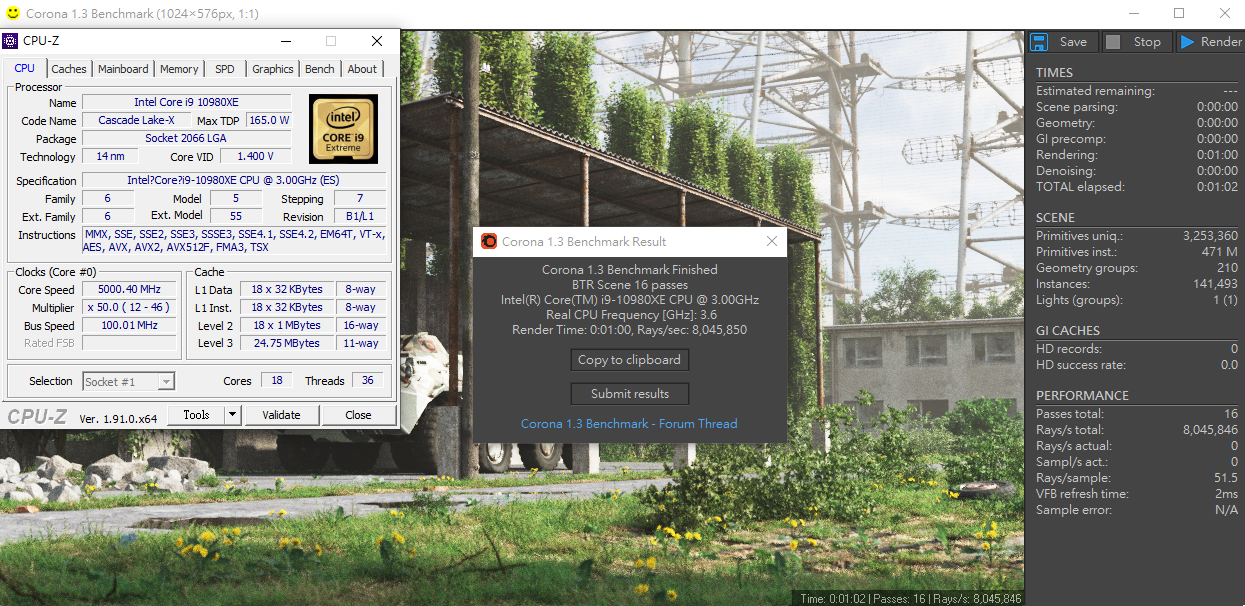
1.Corona Benchmark
Corona是由 Corona Labs Inc.在 2009年中開發的軟件開發套件 ,而 Corona Benchmark則是渲染引擎的測試軟體,它可以構建 iOS ,Android和 Kindle的 2D 移動應用程序,Windows和 OS X的桌面應用程序以及Apple TV,Fire的聯網電視應用程序電視和 Android電視
Corona使用位於 C ++ / OpenGL之上的集成 Lua構建圖形應用程序。 該軟件具有兩種操作模式:Corona Simulator和Corona Native。 使用 Corona Simulator,可以直接從 Corona Simulator構建應用程序。 Corona Native允許您將 Lua代碼和資產集成到 Xcode或 Android Studio項目中,以構建您的應用並包含本機功能

Corona Benchmark Results
3990X@3.9GHz之 Corona Benchmark 17,443,558Rays/s
對照組 10980XE@5.0GHz之 Corona Benchmark 8,045,850 Rays/s
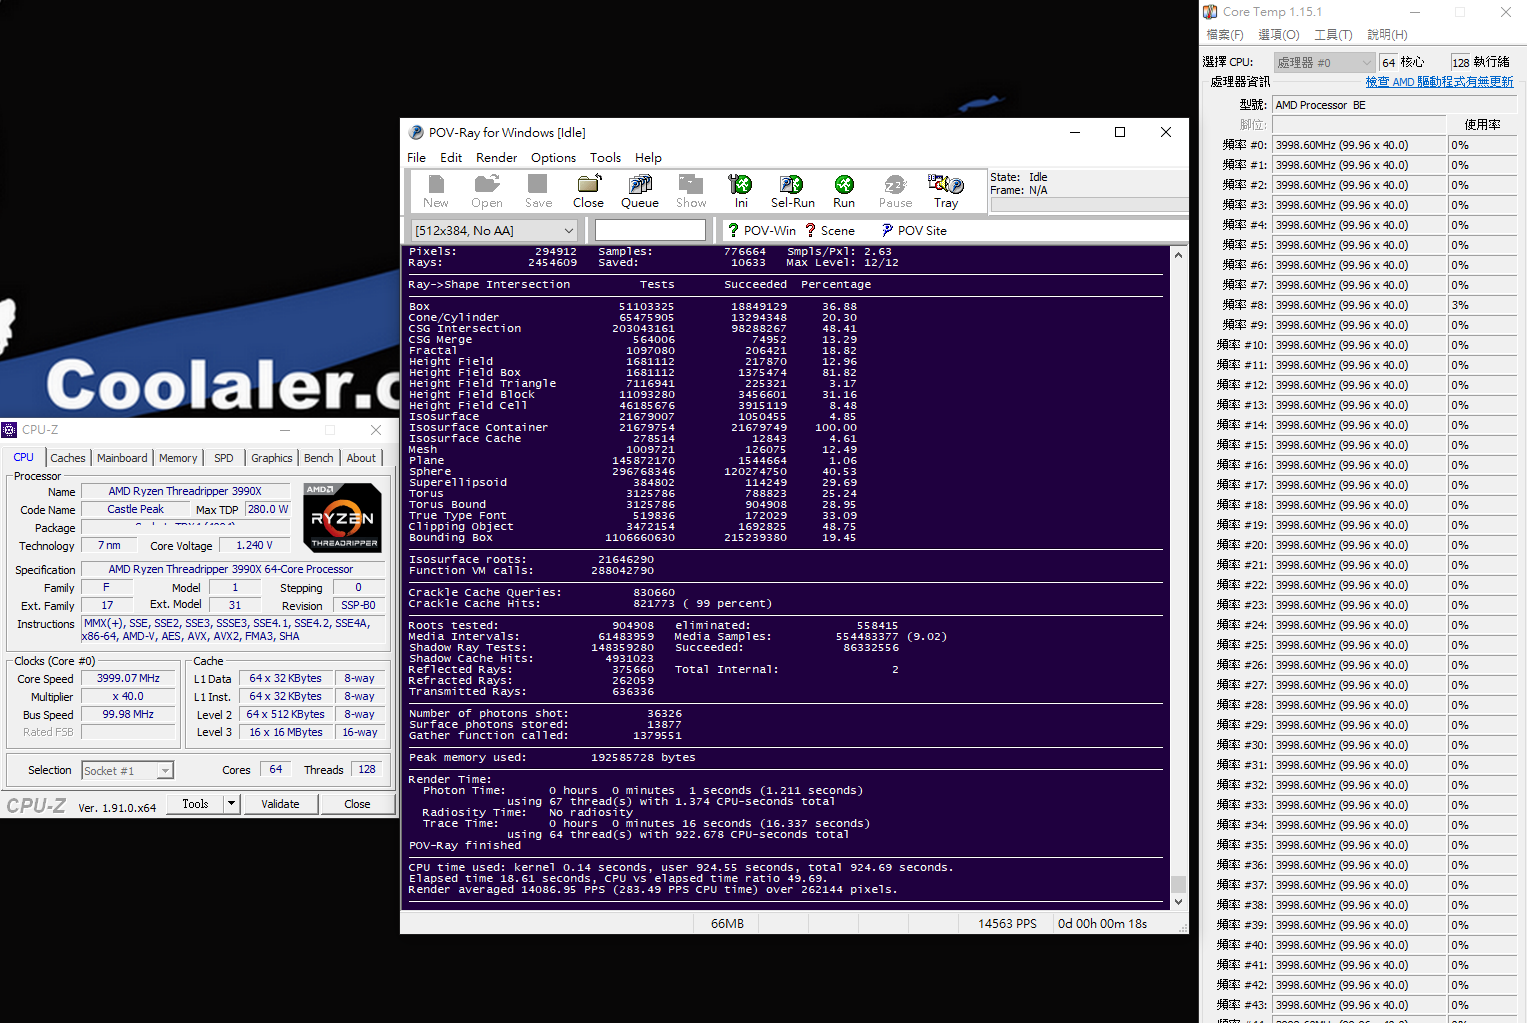
2.POV-Ray Benchmark
POV-Ray全名是 Persistence of Vision Raytracer,是一個使用光線跟蹤繪製三維圖像的開放原始碼自由軟體。運行 POV腳本語言。它是基於 DKBTrace來開發的,DKBTrace是由 David Kirk Buck和 Aaron A. Collins編寫在 Amiga上的。POV-Ray早期也受到了 Polyray raytracer作者 Alexander Enzmann的幫助。很多漂亮的圖片就是由 POV-Ray來製作的

POV-Ray Benchmark Results
3990X@4.0GHz之 POV-Ray 為 924.69s (lower is better)
對照組 10980XE@5.0GHz之 POV-Ray 1380.89s (lower is better)

3.Geekbench
Geekbench是一款跨平台的處理基準測試程序,其評分系統可分為單核和多核性能,以及模擬真實使用場景的工作負載能力。有 Geekbench 2、Geekbench 3,而目前的 Geekbench 4版本所使用的分數是基於 4000的基線分數計算的,這代表表現Intel Core i7 -6600U @ 2.60 GHz的性能。軟體基準測試適用於 macOS、Windows、Linux、Android和 iOS。Geekbench 4還測量 GPU性能包括圖像處理和 計算機視覺等領域

Geekbench Results
3990X@4.0GHz之 Geekbench Multi Core 23815 Single Core 1208

對照組 10980XE@5.0GHz
Geekbench Multi Core17561 Single Core 1365

測試項目 A比較表
測試項目 B:
1.Cinebench R15 Benchmark
2.CPU-Z Bench
測試設定:
3990X@4.0GHz DDR4 3600 128GB同步
3990X@4.1GHz DDR4 3600 32GB同步
對照組 2990WX@4.1GHz
對照組 2990WX@5.1GHz
對照組 3970X@PBO
對照組 3960X@PBO
對照組 3700X@4.3GHz
對照組 3700X@5GHz
對照組10980XE@5GHz
1.Cinebench R15 CPU Test
Cinebench是一個真實的跨平台測試套件,用於評估計算機的硬件功能,由於它是以 Cinema 4D動畫製作軟體為基礎進行測試,所以能夠反應出多線程處理器與顯示卡面對實際應用軟體所能發揮的效能,且能在短時間內得知測試結果,是一個能快速得知是否能 All Core的測試軟體

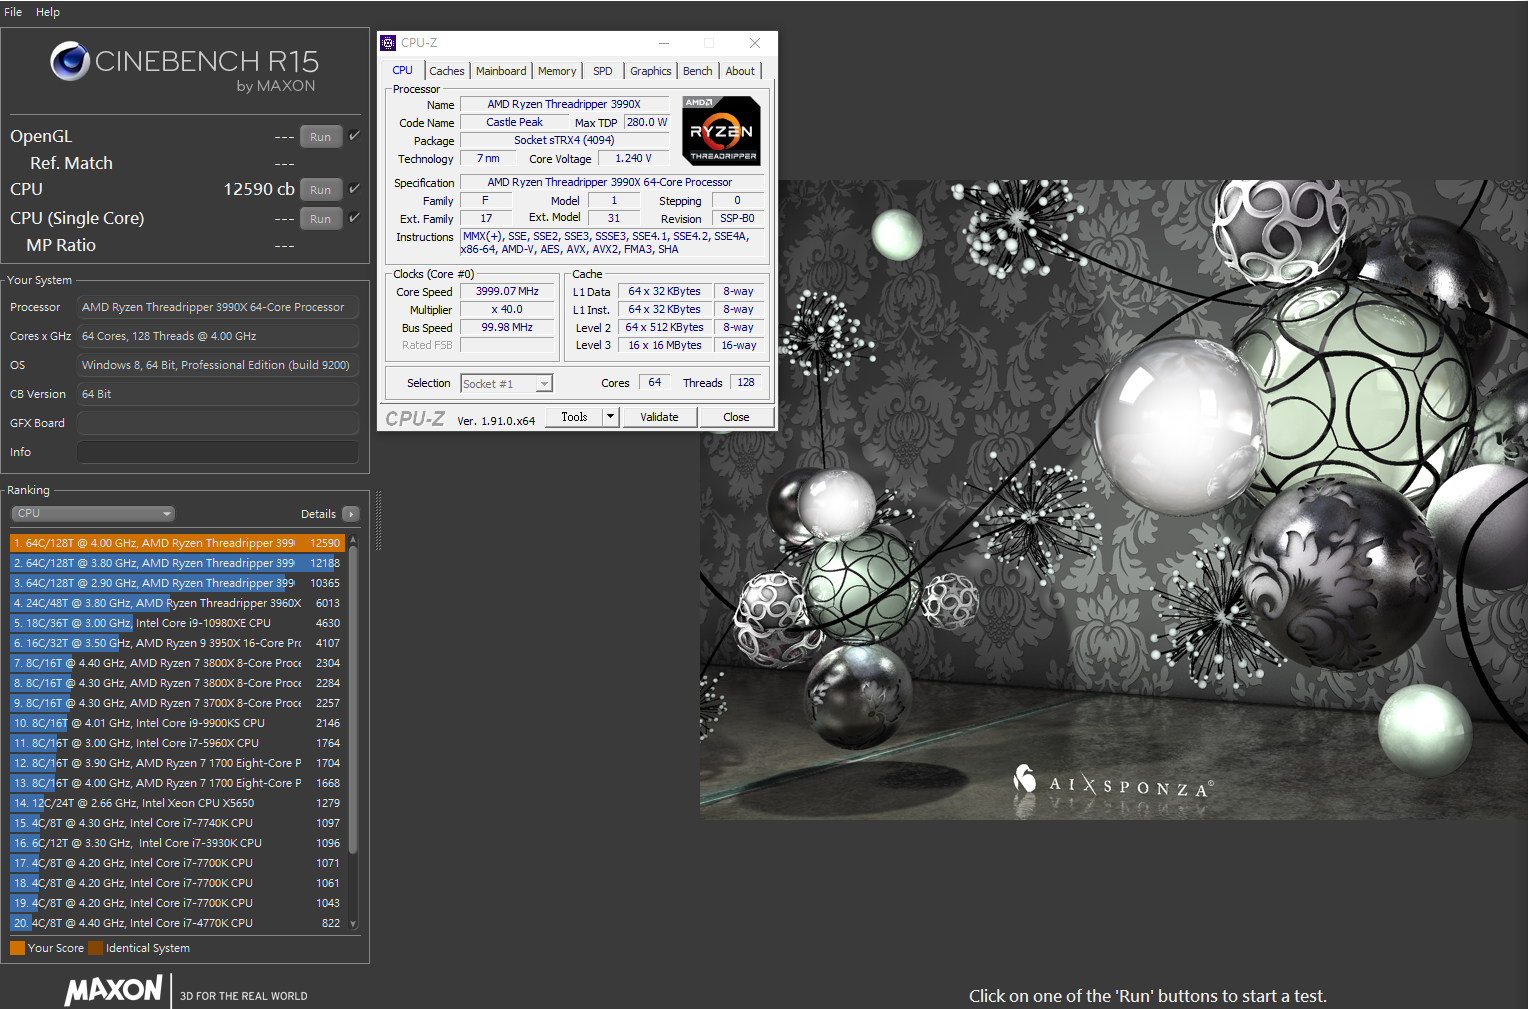
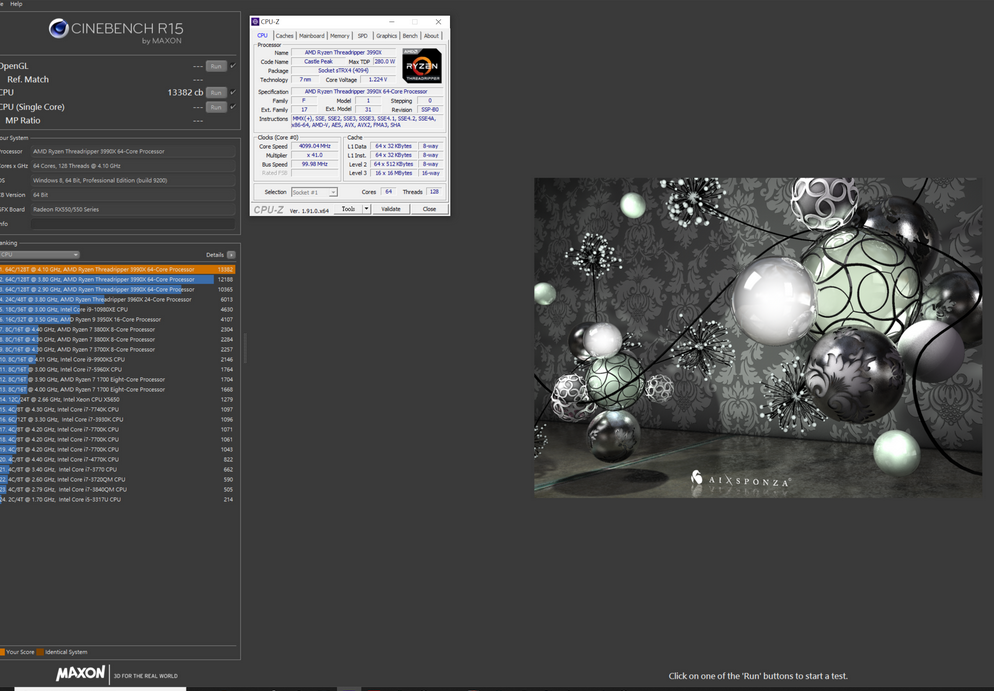
Cinebench R15 CPU Test Results
3990X@4.0GHz之 Cinebench R15 CPU Test 12590cb
3990X@4.1GHz之 Cinebench R15 CPU Test 13382cb
對照組 2990WX@4.1GHz之 Cinebench R15 CPU Test 6318cb

對照組 2990WX@5.1GHz之 Cinebench R15 CPU Test 8018cb

對照組 3970X@PBO之 Cinebench R15 CPU Test 7398cb

對照組 3960X@PBO之Cinebench R15 CPU Test 6013cb

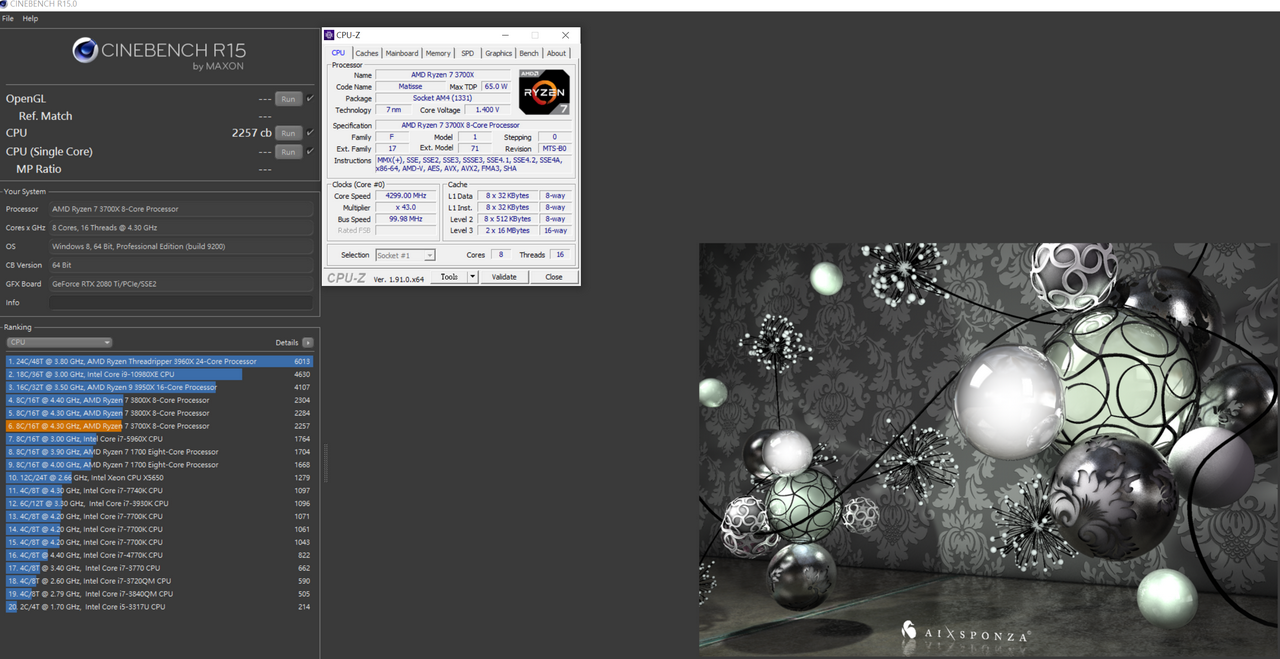
對照組 3700X@4.3GHz之 Cinebench R15 CPU Test 2257cb
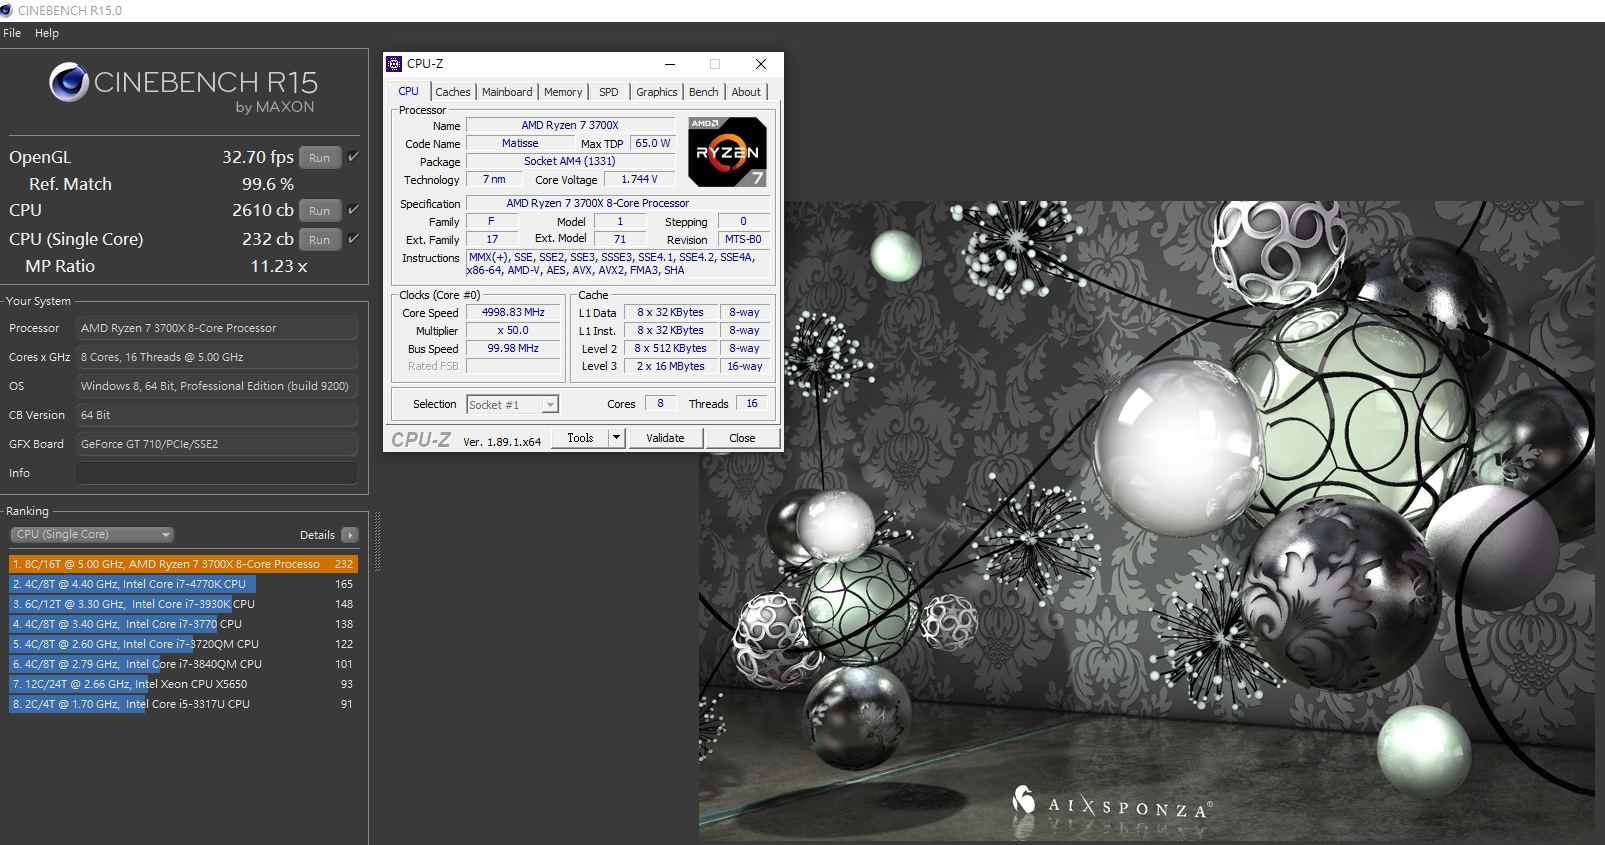
對照組 3700X@5GHz之 Cinebench R15 CPU Test 2610cb
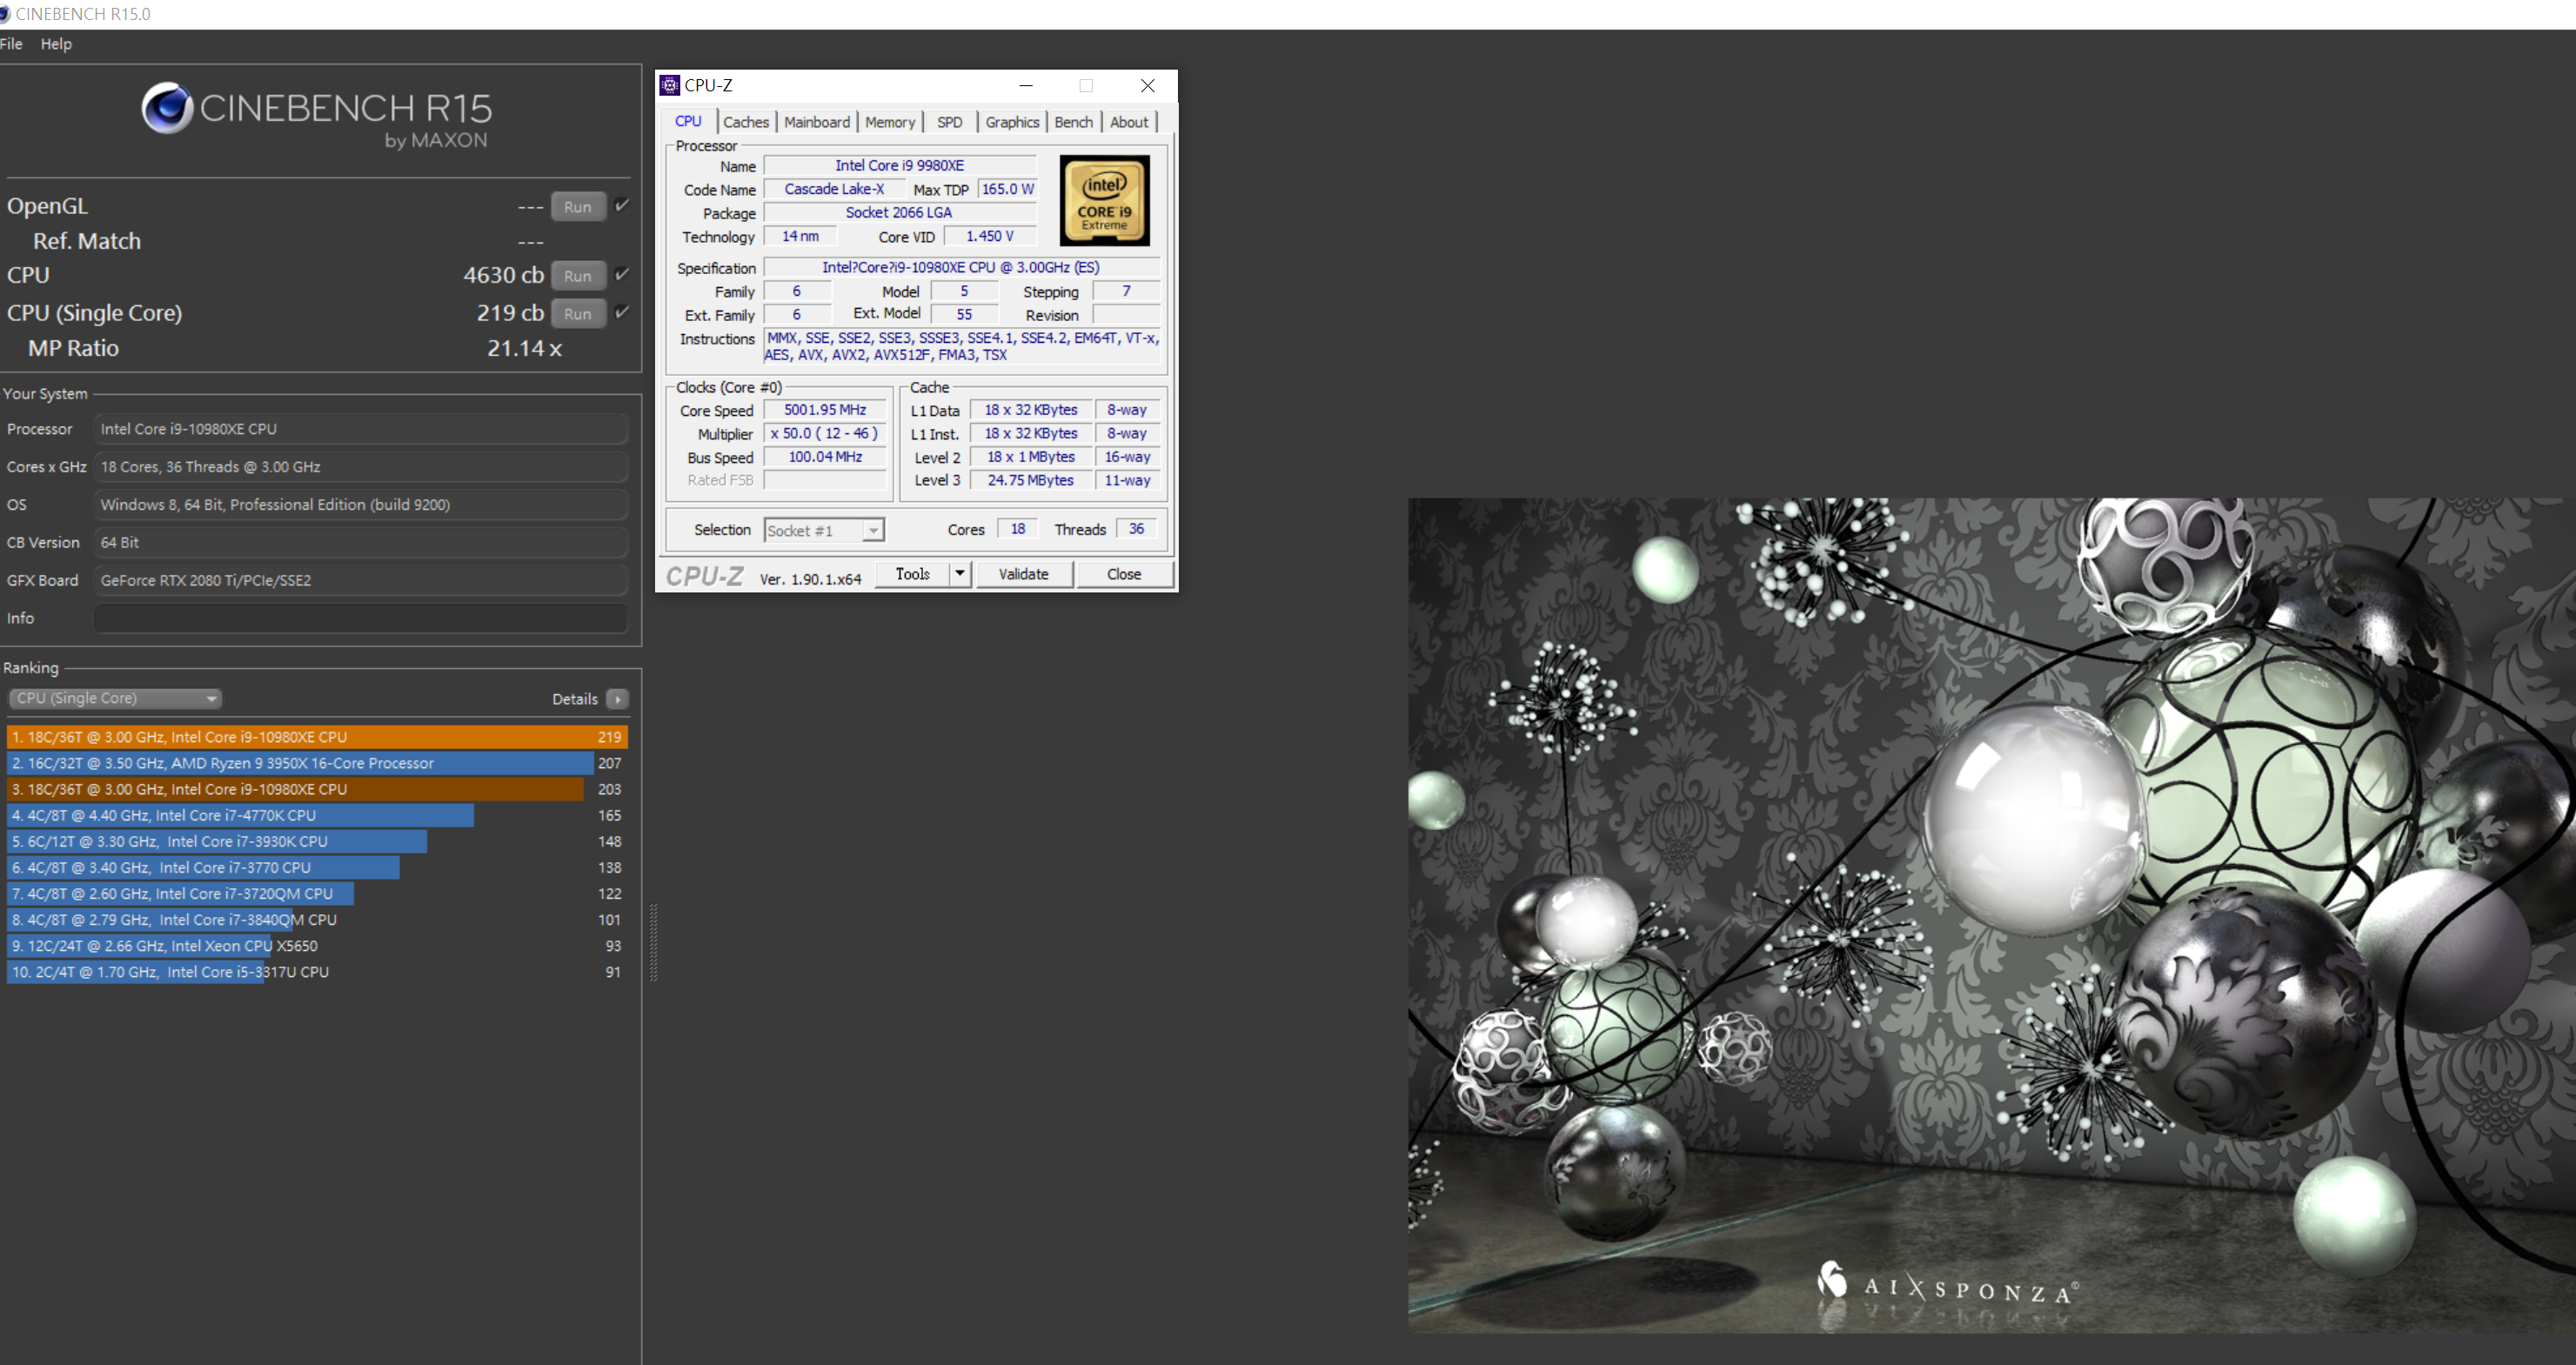
對照組 10980XE@5.0GHz之 Cinebench R15 CPU Test為 4630cb,Single Core為 219cb
2.CPU-Z Bench
CPU-Z為一個中央處理器、記憶體及主機板資訊的 Windows軟體,在近年新增了 Bench item,提供處理器的簡單測試但精確度較低,測試數據僅供參考
CPU-Z Bench Results
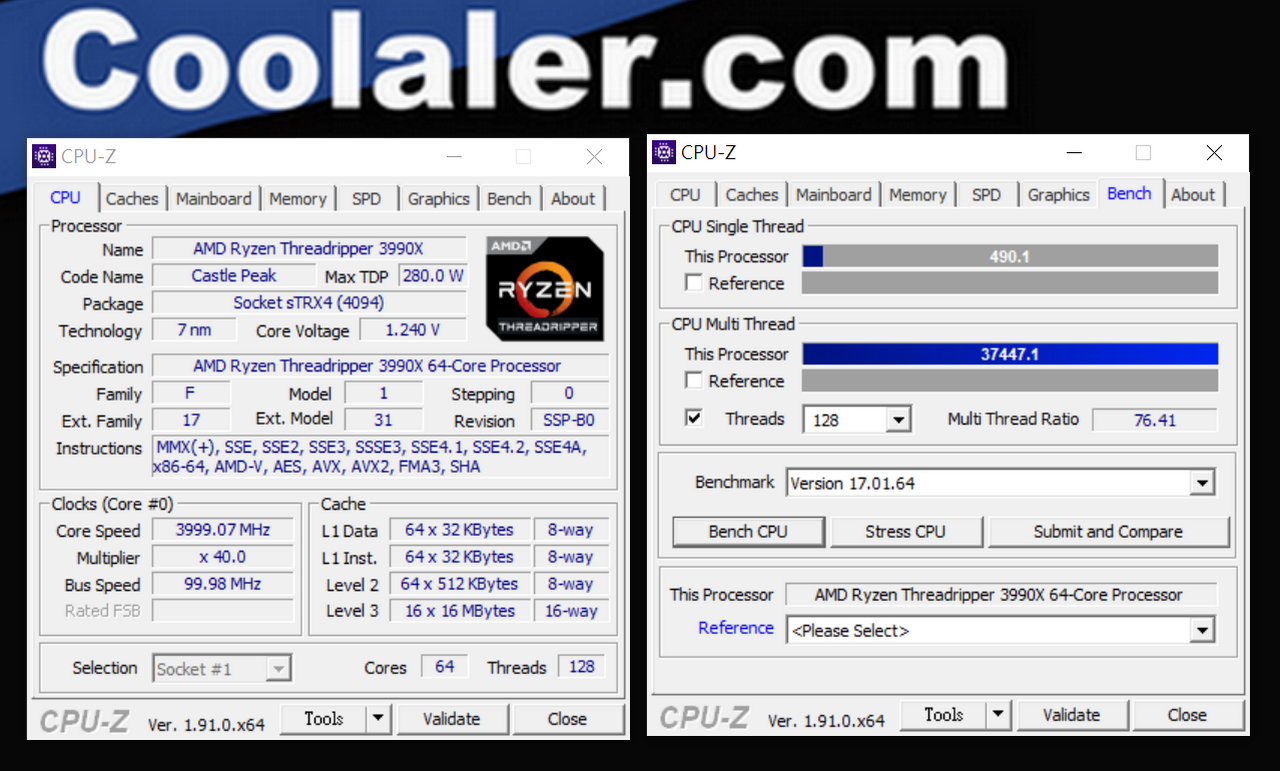
3990X@4.0GHz CPU-Z Benchmark
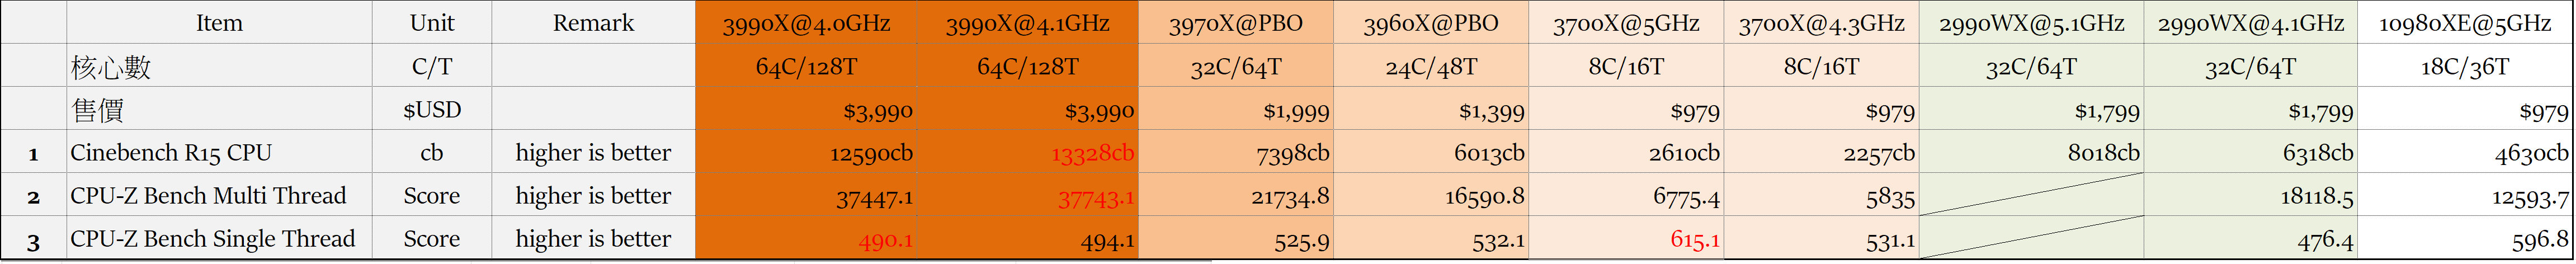
CPU-Z Bench Single Thread:490.1
CPU-Z Bench Multi Thread:37447.1
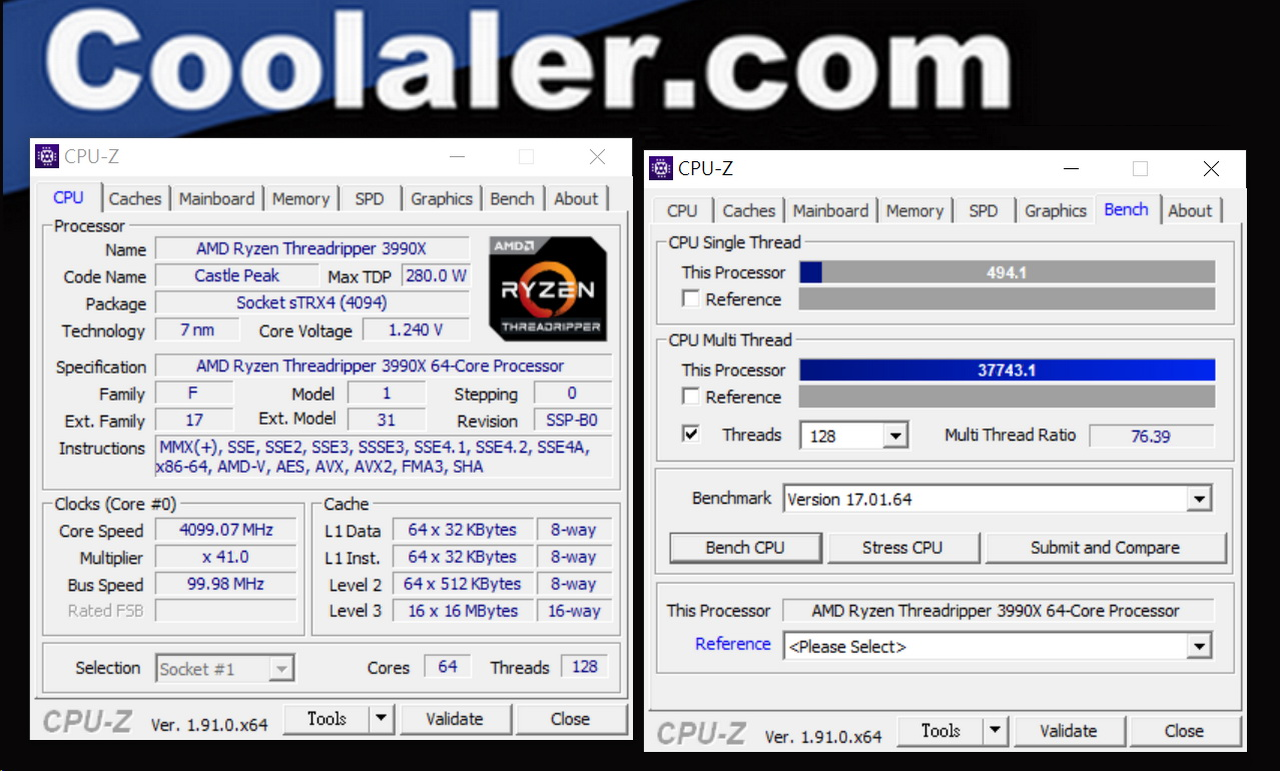
3990X@4.1GHz CPU-Z Benchmark
CPU-Z Bench Single Thread:494.1
CPU-Z Bench Multi Thread:37743.1
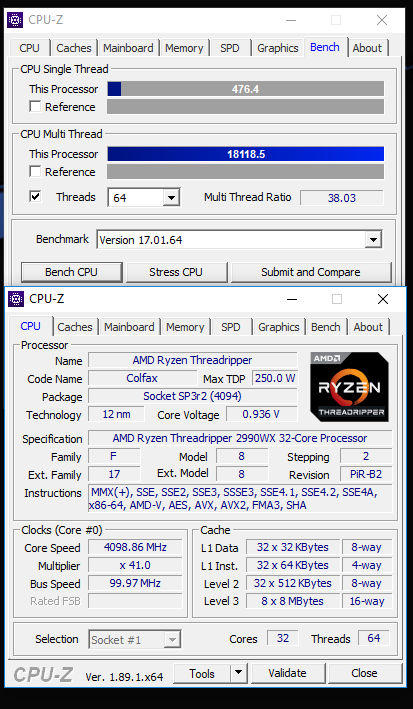
對照組 2990WX@4.1GHz之
CPU-Z Bench Single Thread:476.4
CPU-Z Bench Multi Thread:18118.5
對照組 3970X@PBO之
CPU-Z Bench Single Thread:525
CPU-Z Bench Multi Thread:21734.8

對照組 3960X@PBO之
CPU-Z Bench Single Thread:532.1
CPU-Z Bench Multi Thread:16590.8

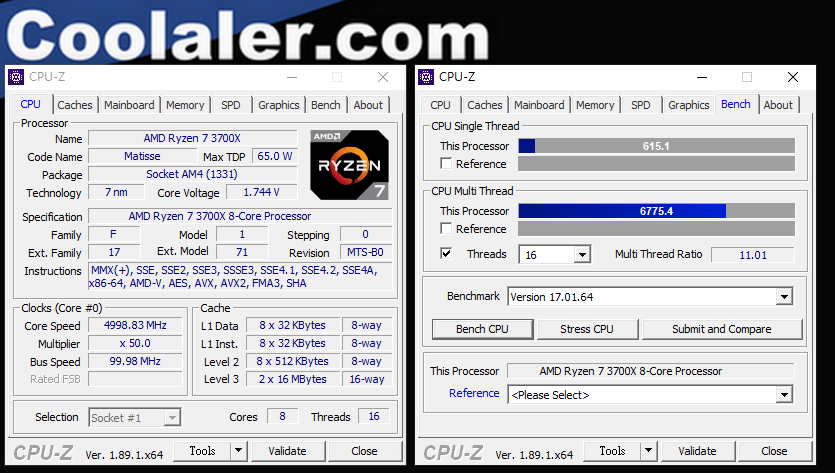
對照組 3700X@5GHz之 CPU-Z Bench Single Thread 615.1分、Multi Thread 6775.4分
對照組 3700X@4.3GHz之 CPU-Z Bench CPU Multi Thread 5835.0分、CPU Single Thread 531.1分
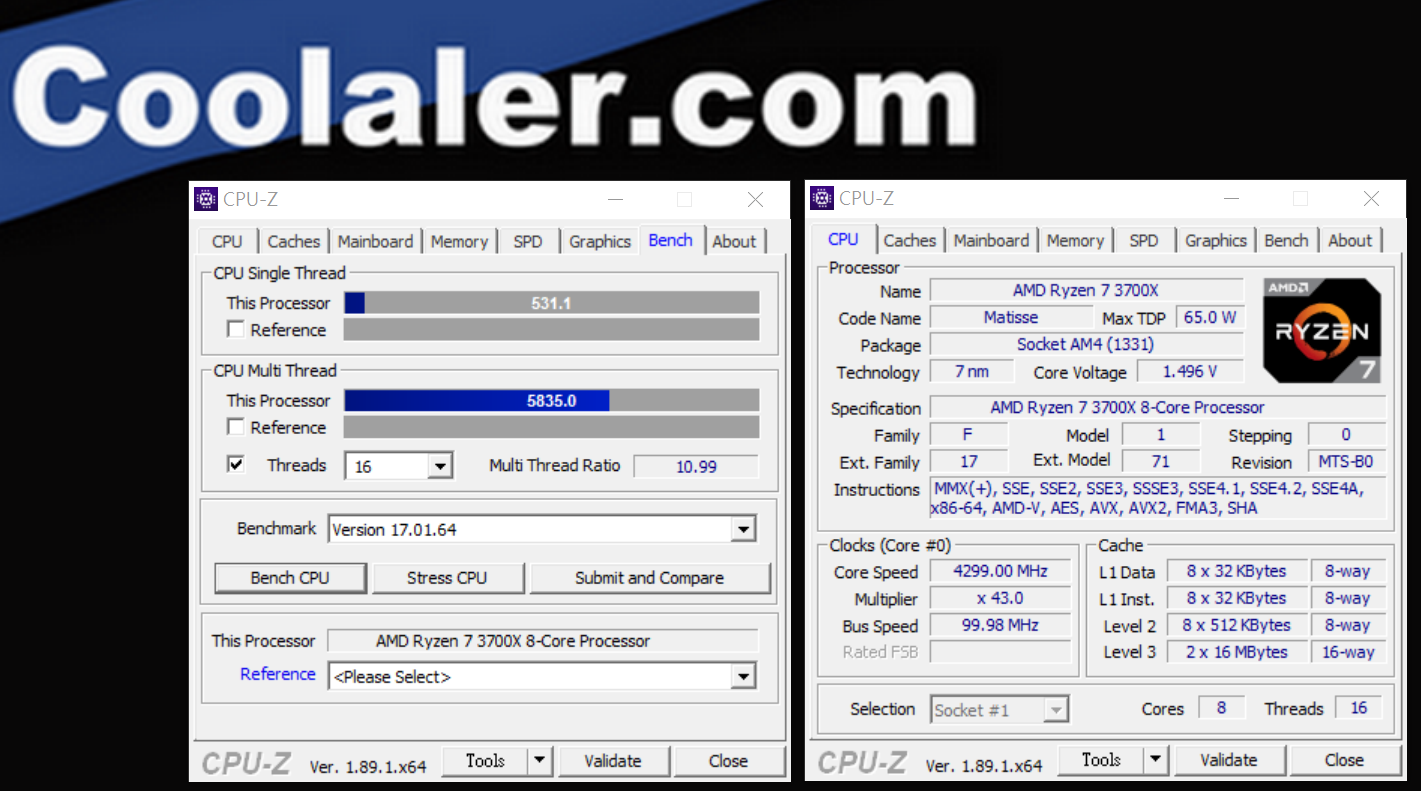
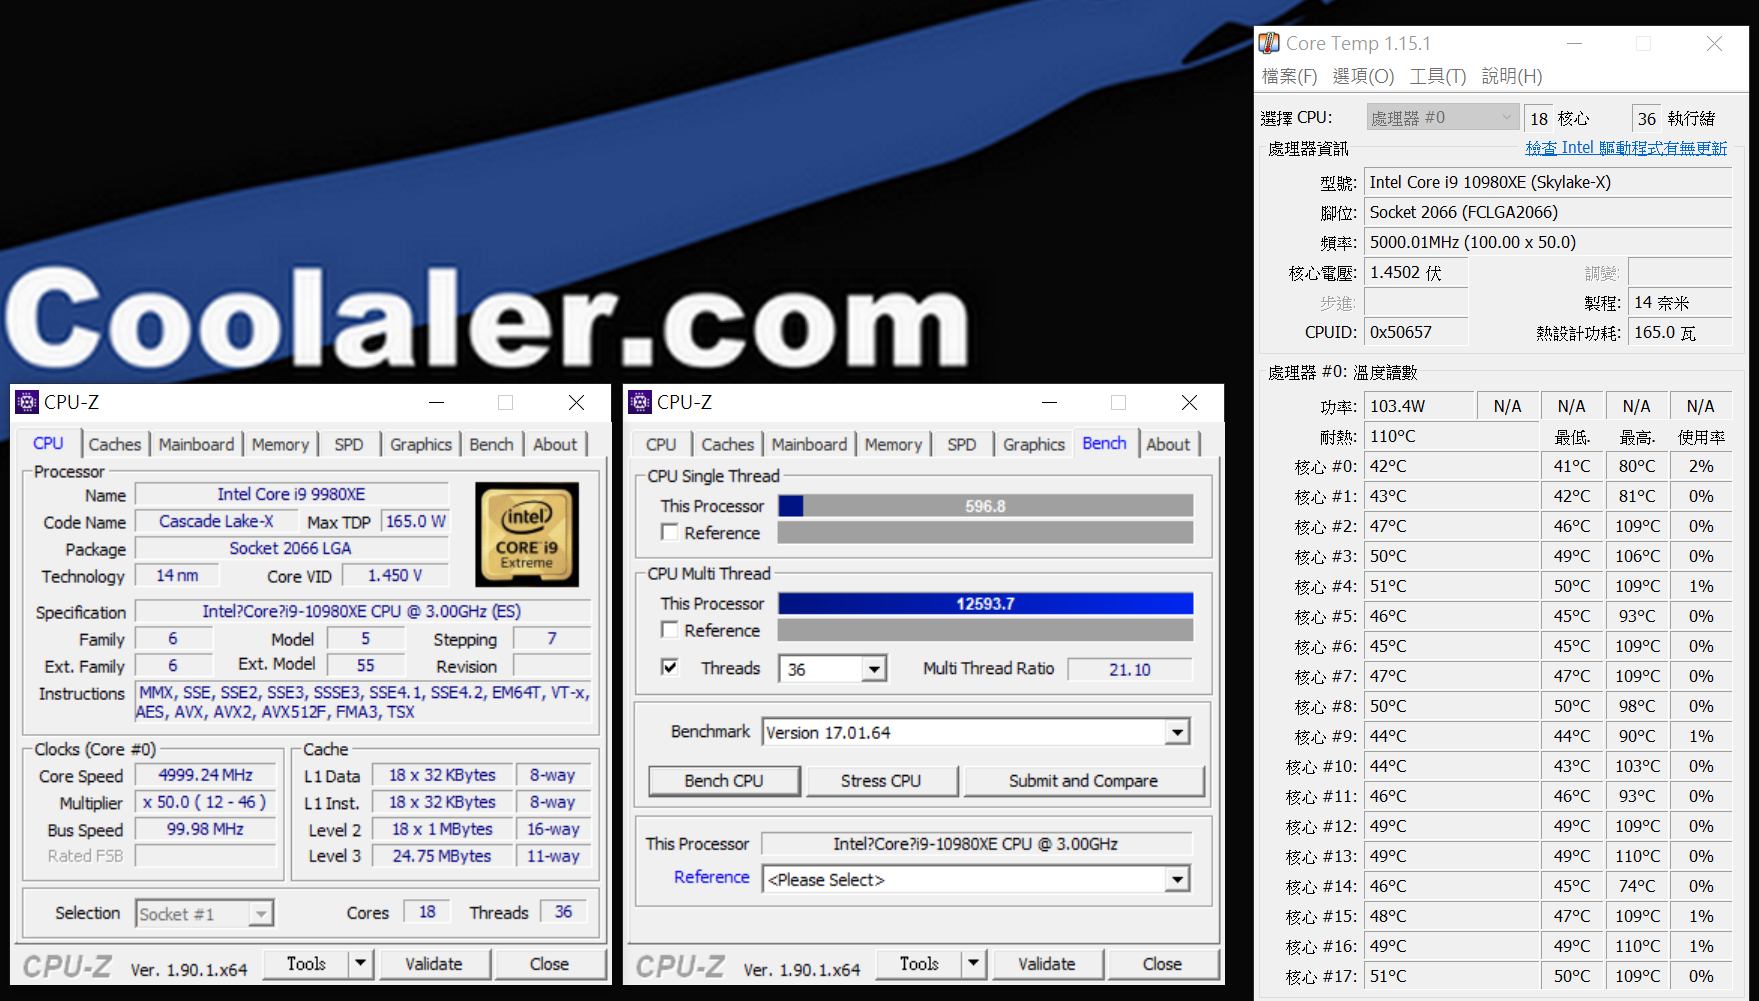
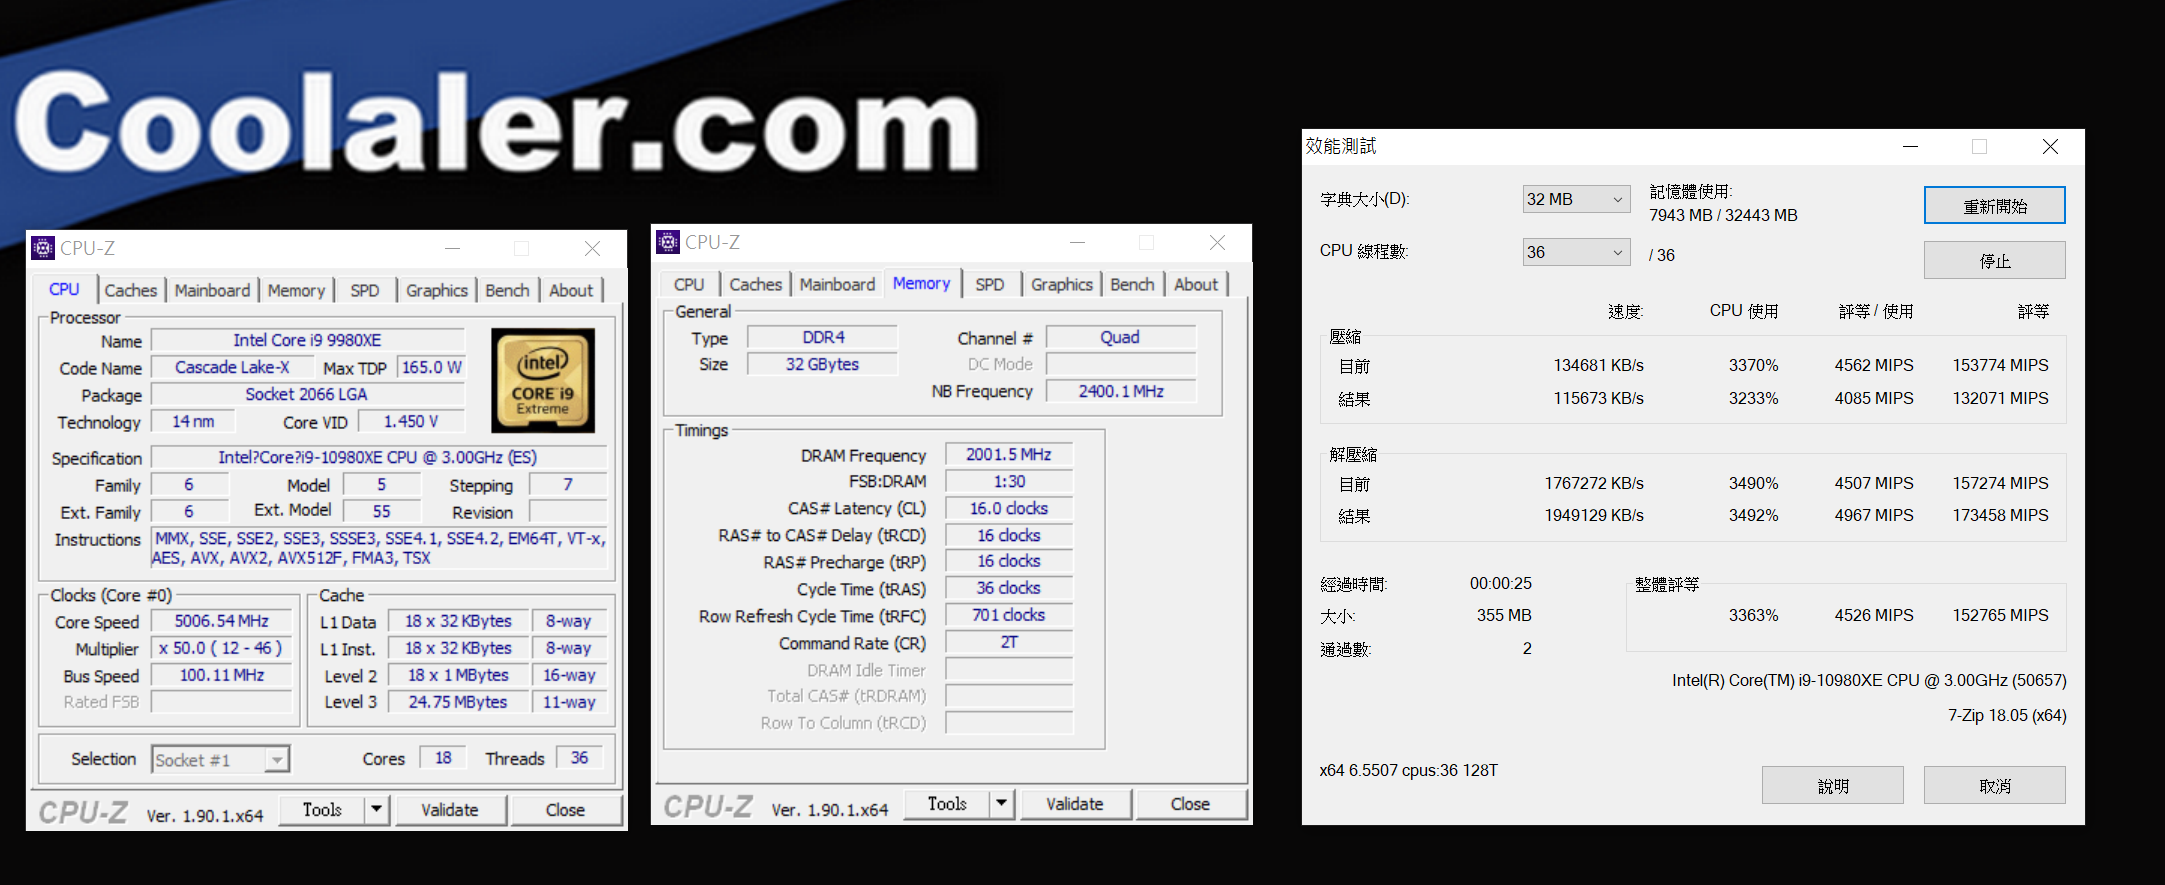
對照組 10980XE@5.0GHz之 CPU-Z Bench CPU Multi Thread為 12593.7分,CPU Single Thread為 596.8分
測試項目 B比較表
測試項目 C:
1.Cinebench R20 Benchmark
2.7-Zip Benchmark
3.X264 FHD Benchmark
4.V-Ray Benchmark
5.Geekbench
測試設定:
3990X@4.0GHz DDR4 3600 128GB同步
3990X@4.1GHz DDR4 3600 32GB同步
對照組 3970X@PBO
對照組 3960X@PBO
對照組10980XE@5GHz
1.Cinebench R20 CPU Test
Cinebench是一個真實的跨平台測試套件,用於評估計算機的硬件功能,現有最新版本已至 R20版本,由於它是 以 Cinema 4D動畫製作軟體為基礎進行測試,所以能夠反應出多線程處理器與顯示卡面對實際應用軟體所能發揮的效能,且能在短時間內得知測試結果,是一個能快速得知是否能 All Core 5GHz的測試軟體
Cinebench Release 20的改進反映了近年來 CPU和渲染技術的整體進步,為 Cinema 4D利用多個 CPU核心和普通用戶可用的現代處理器功能提供了更準確的測量,最重要的是它是免費的

Cinebench R20 CPU Test Results
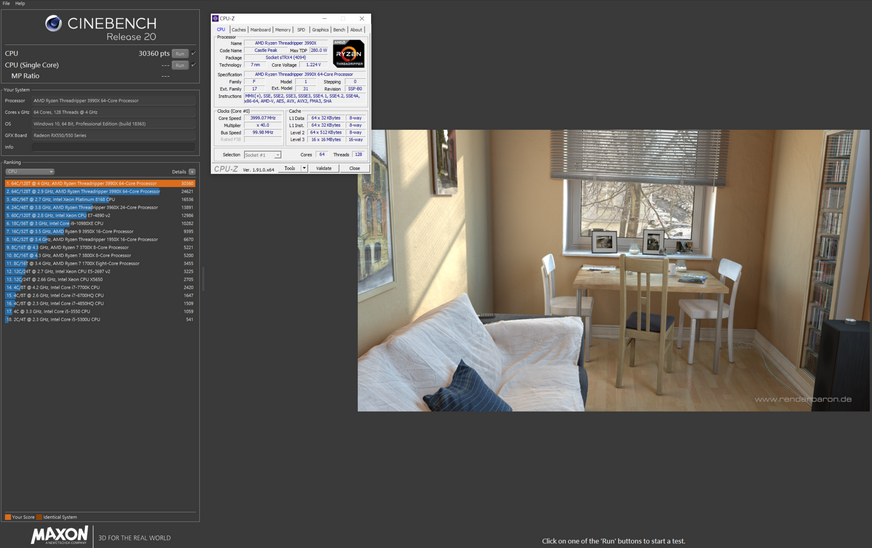
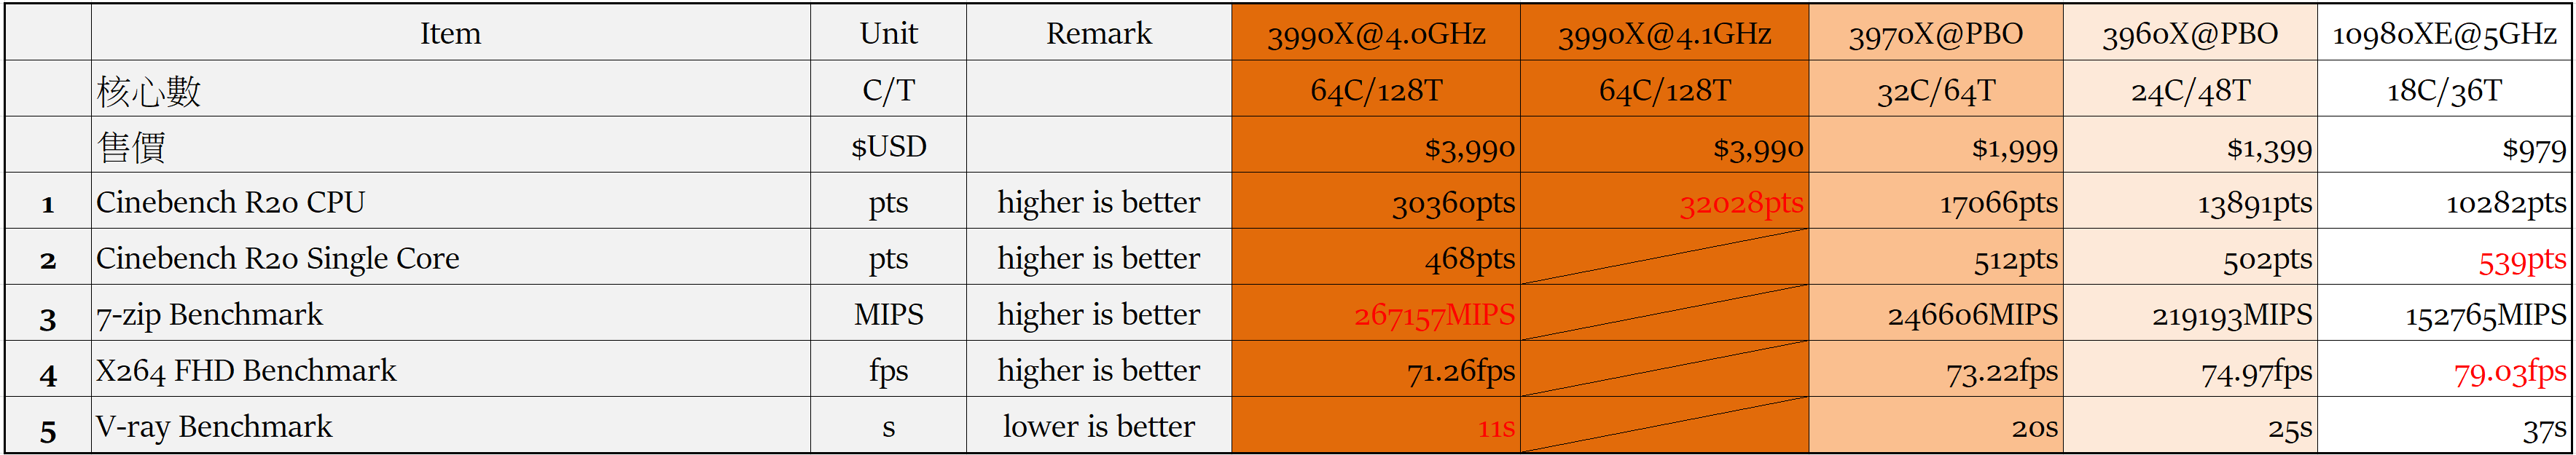
3990X@4.0GHz之 Cinebench R20 CPU Test 30360pts Single Core 468pts
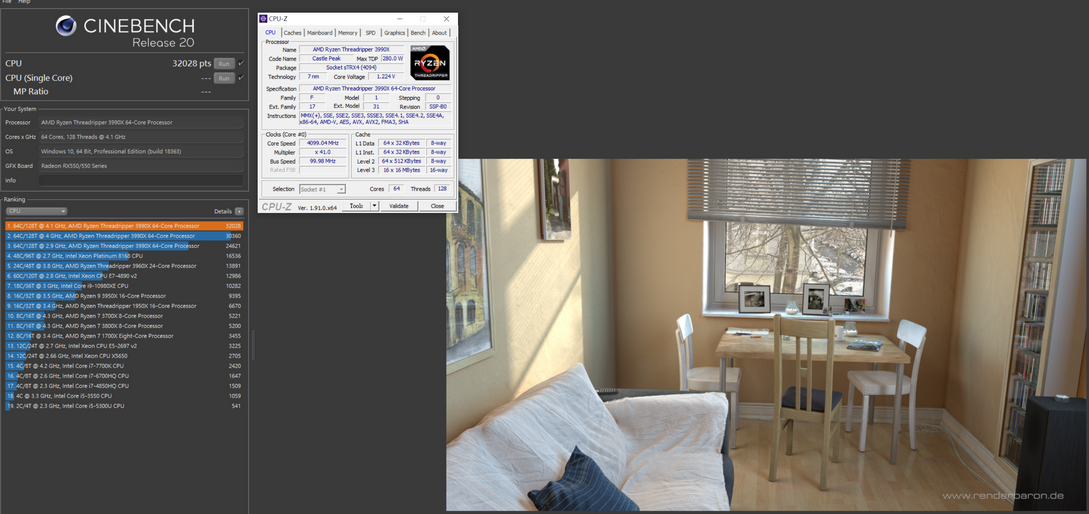
3990X@4.1Hz之 Cinebench R20 CPU Test 32028pts
對照組 3970X@PBO之 Cinebench R20 CPU Test 17066pts Single Core 512pts

對照組 3960X@PBO之 Cinebench R20 CPU Test 13891pts Single Core 502pts

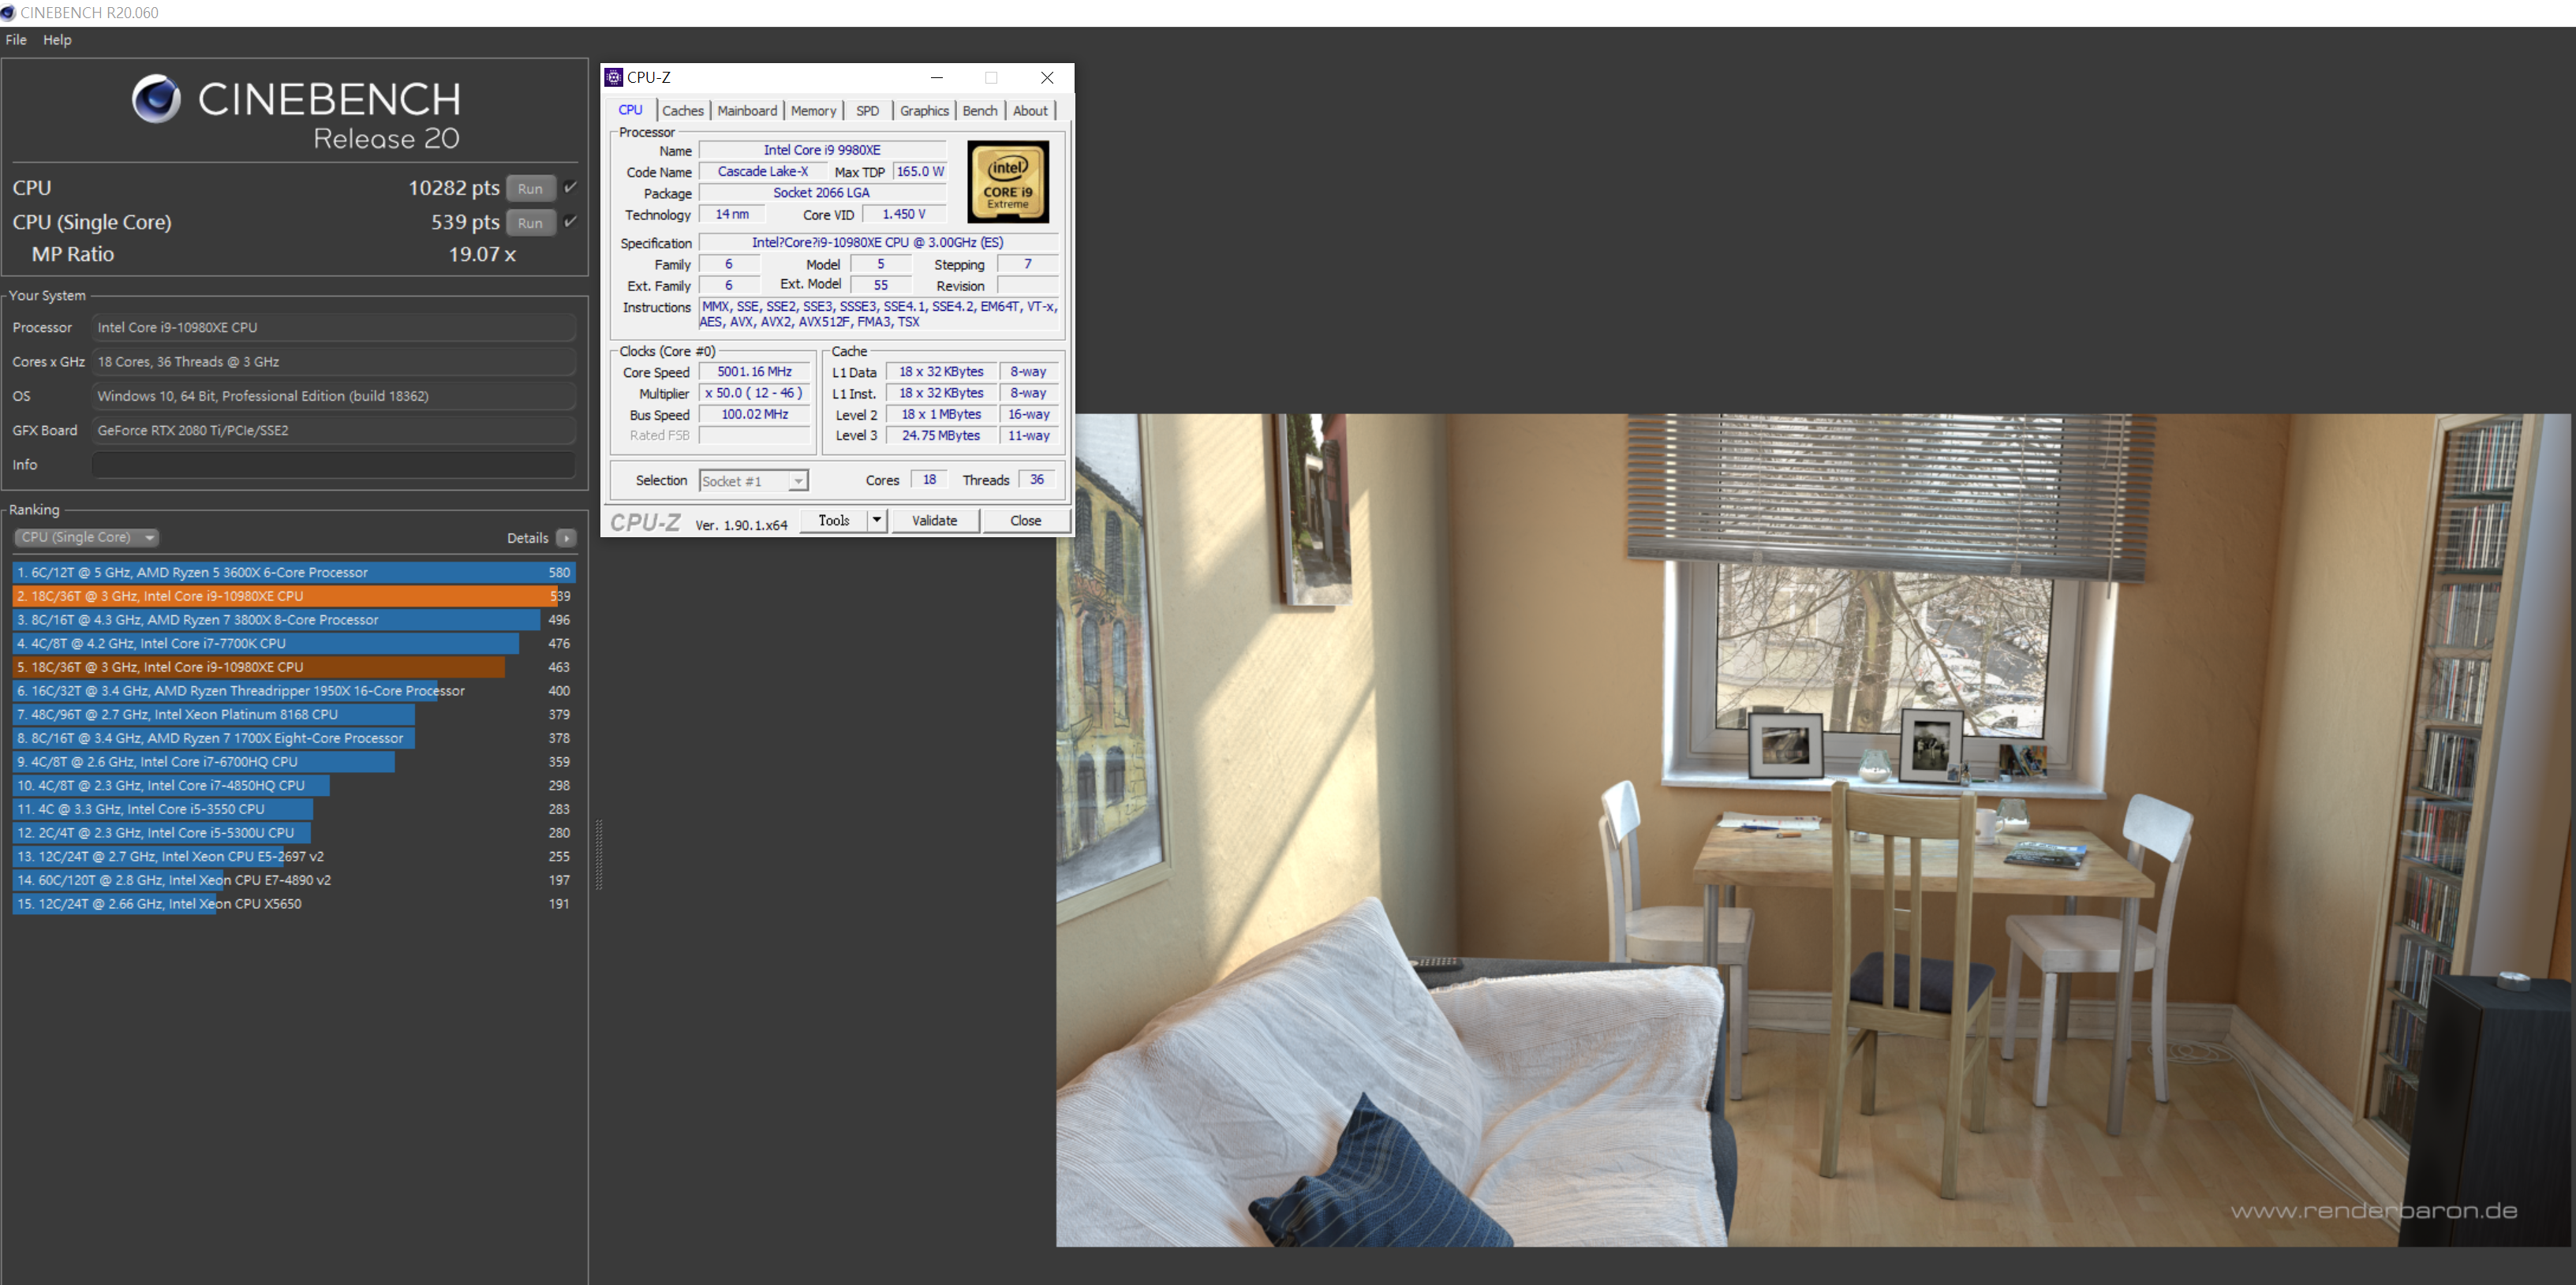
對照組 10980XE@5.0GHz之 Cinebench R20 CPU Test 10282pts Single Core 539pts
2.7-zip Benchmark
7-zip Benchmark是一個開放原始碼的資料壓縮程式並自帶測試項目的軟體,主要用在 Windows作業系統,在 7-Zip的測試中可看出擁有高頻率及多線程的處理器較具優勢
7-Zip Benchmark Results
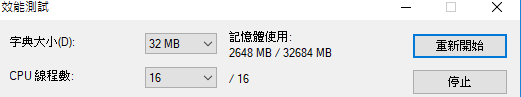
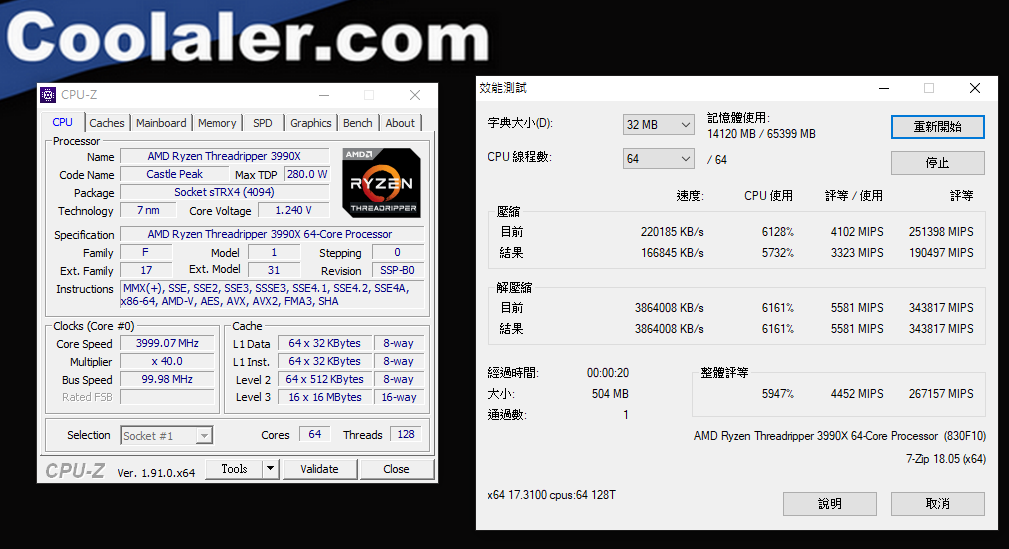
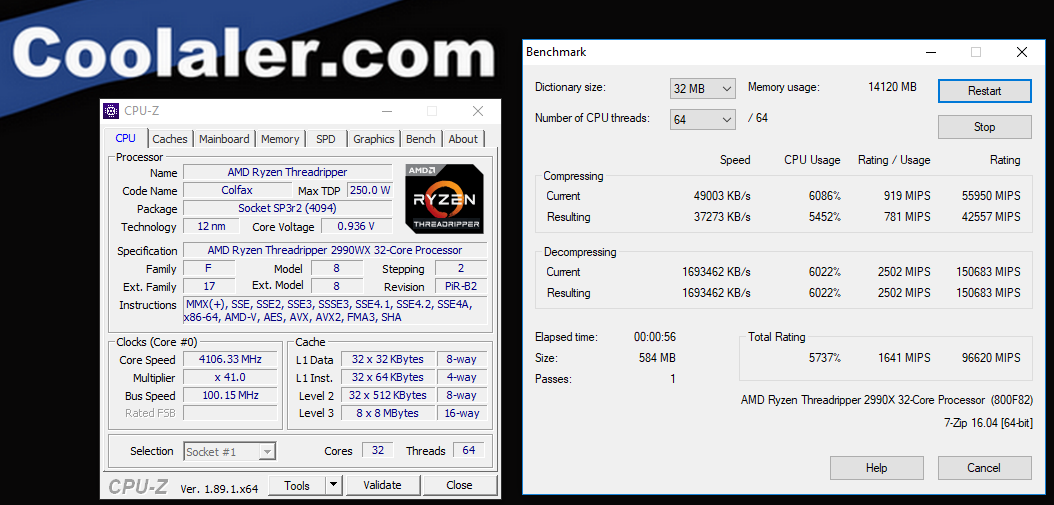
3990X@4.0GHz之 7-Zip Benchmark 267157MIPS
對照組 2990WX@4.1GHz 7-Zip Benchmark 96620MIPS
對照組 3970X@PBO之 7-Zip Benchmark:246606MIPS

對照組 3960X@PBO之 7-Zip Benchmark:219193MIPS

對照組 10980XE@5.0GHz之 7-zip Benchmark為 152765MIPS
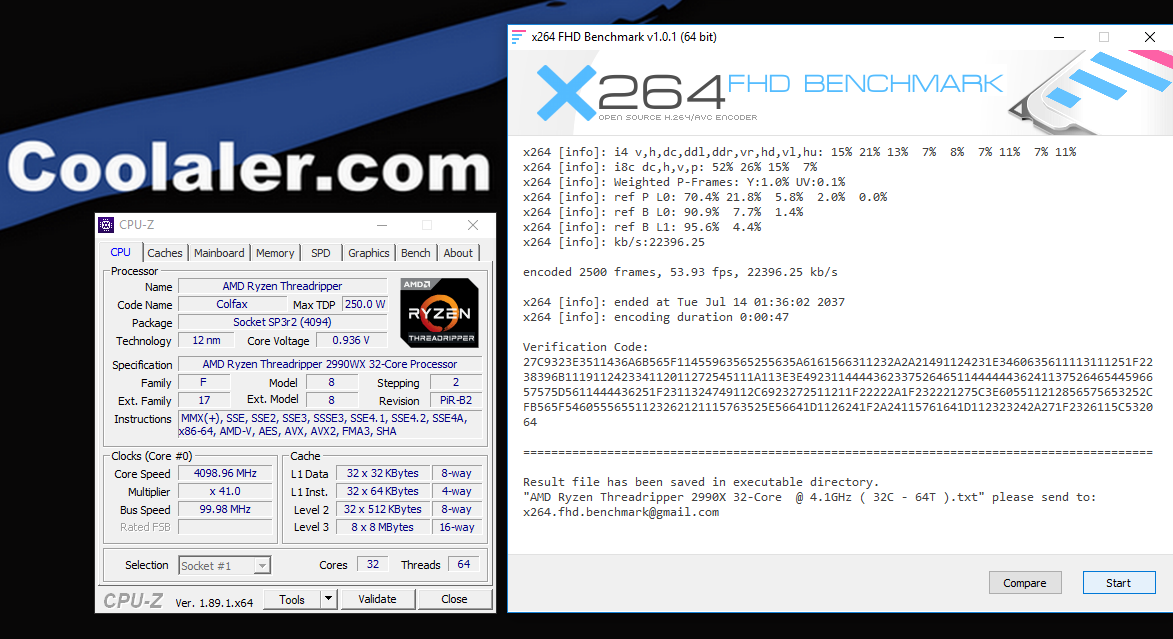
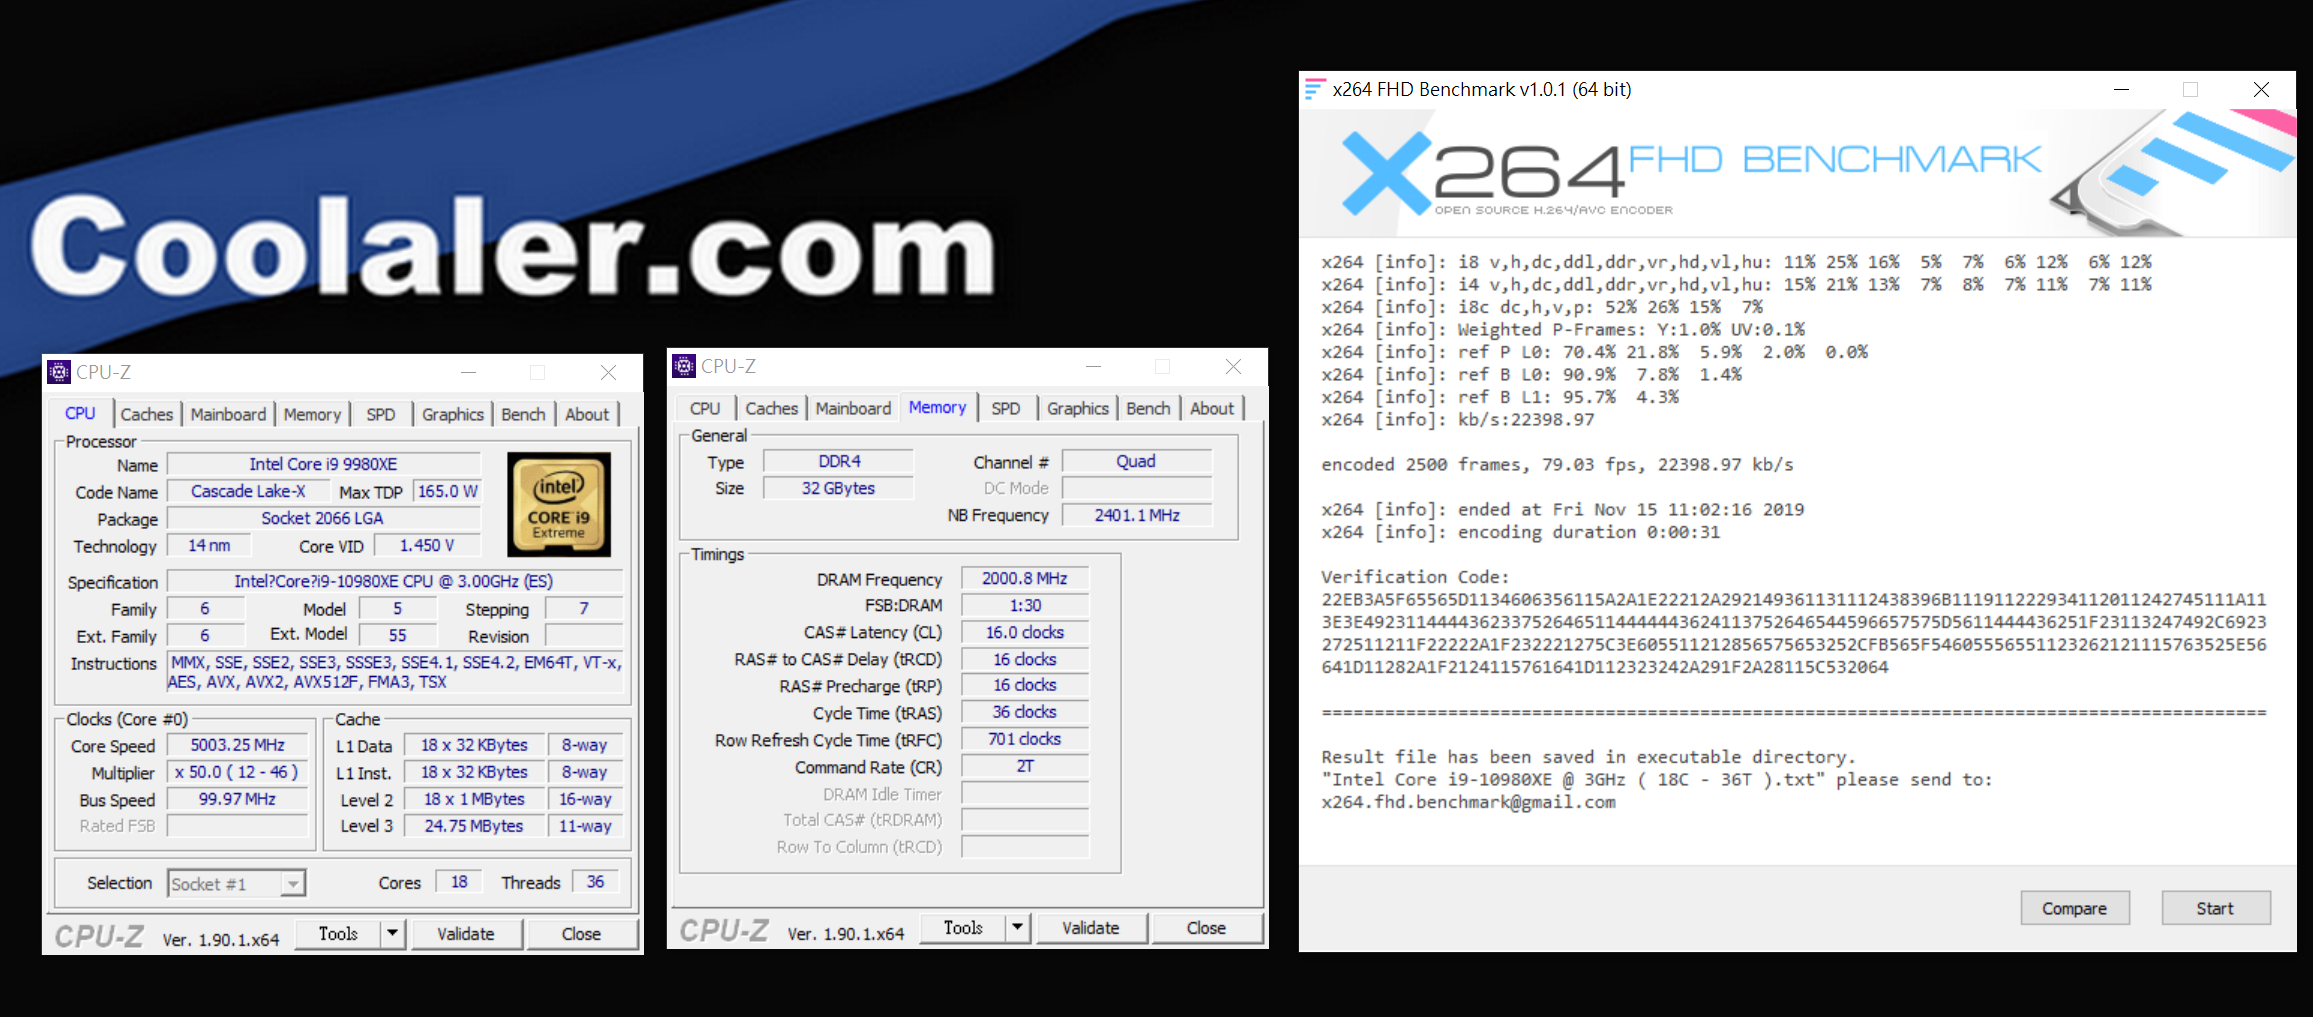
3.X264FHD Benchmark
X264 FHD Benchmark是一套可以同時測試浮點運算及多媒體的轉檔效能的測試軟體,勉強設定下的處理器頻率與電壓將很難完成測試
X264 FHD Benchmark Results
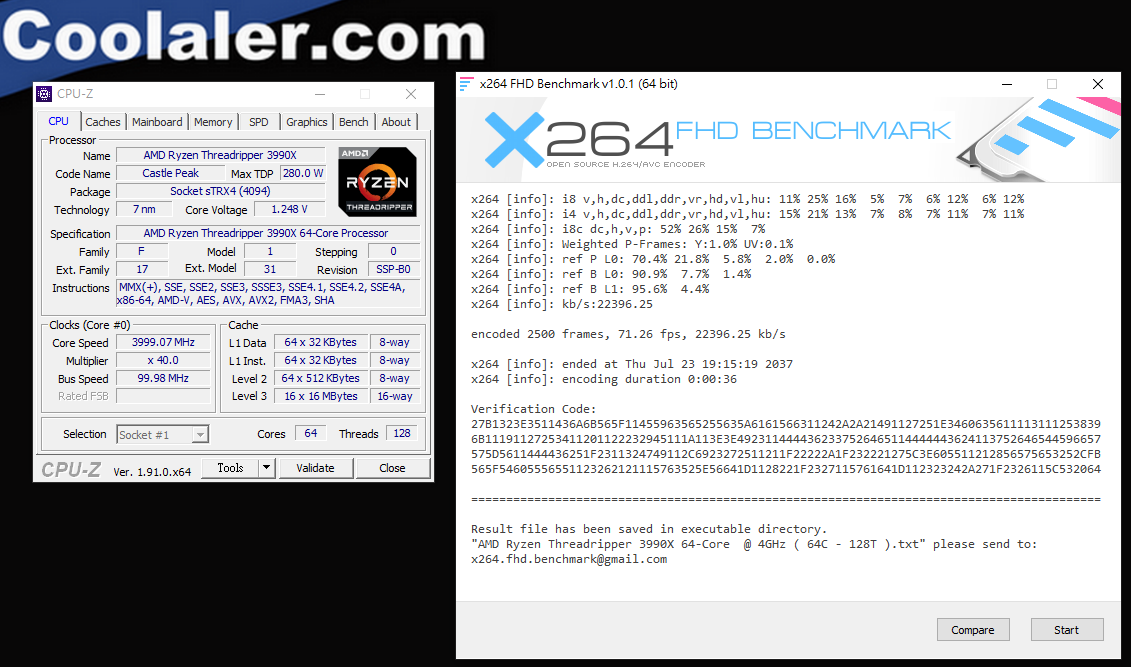
3990X@4.0GHz之 X264 FHD Benchmark 71.26FPS
對照組 2990WX@4.1GHz之 X264 FHD Benchmark 53.93FPS
對照組 3970X@PBO之 X264 FHD Benchmark:73.22fps

對照組 3960X@PBO之 X264 FHD Benchmark:74.97fps

對照組 10980XE@5GHz之 X264 FHD Benchmark為 79.03fps
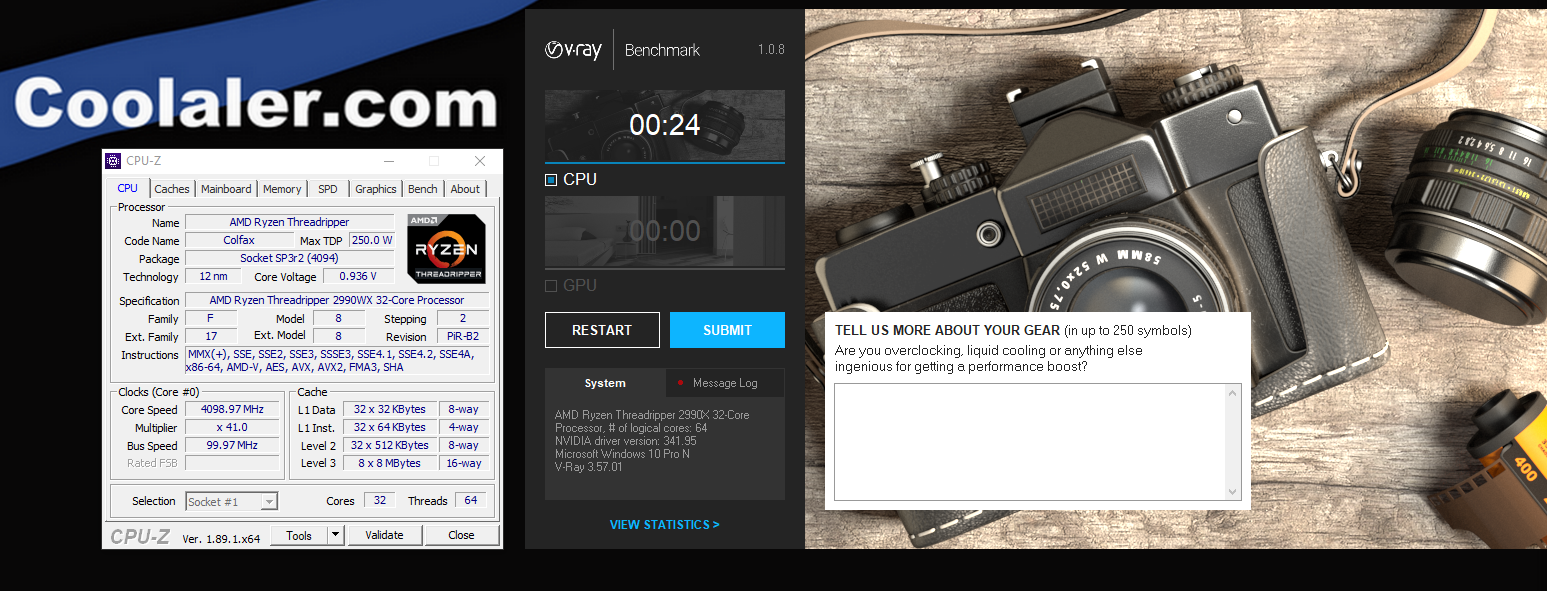
4.V-ray Benchmark
V-Ray Benchmark是一款免費的獨立應用程式,可幫助您測試硬件渲染的速度。基準測試包括兩個測試場景:一個用於 V-Ray,另一個用於 V-Ray GPU,具體取決於您要測量的渲染引擎
借助V-Ray Next Benchmark,您可以快速輕鬆地評估運行V-Ray Next的機器性能。了解您的計算機如何與其他人一起排名並了解不同的硬件如何影響您的渲染速度。使用V-Ray Next Benchmark,您可以測試系統的功率和性能,並將組件推向極限

V-Ray Benchmark Results
3990X@3.9GHz之 V-Ray Benchmark 11s

對照組 2990WX@4.1GHz之 V-Ray Benchmark 24s
對照組 3970X@PBO之 V-ray Benchmark:20s

對照組 3960X@PBO之 V-ray Benchmark:25s

對照組 10980XE@5GHz PBO之 V-ray Benchmark:37s

測試項目 C比較表
測試項目 D:
1.SuperPi 32M
2.CPUMrark99
3.AIDA64 Memory Bandwidth Benchmark
測試設定:
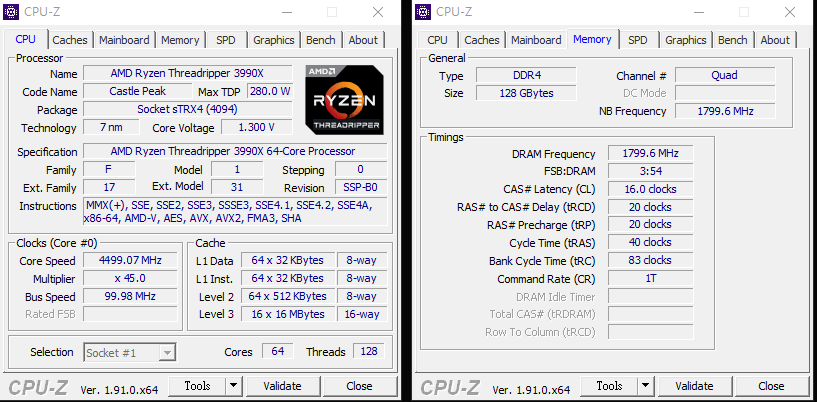
3990X@4.5GHz DDR4 3600 128GB同步
對照組 3970X@PBO
對照組 3960X@PBO
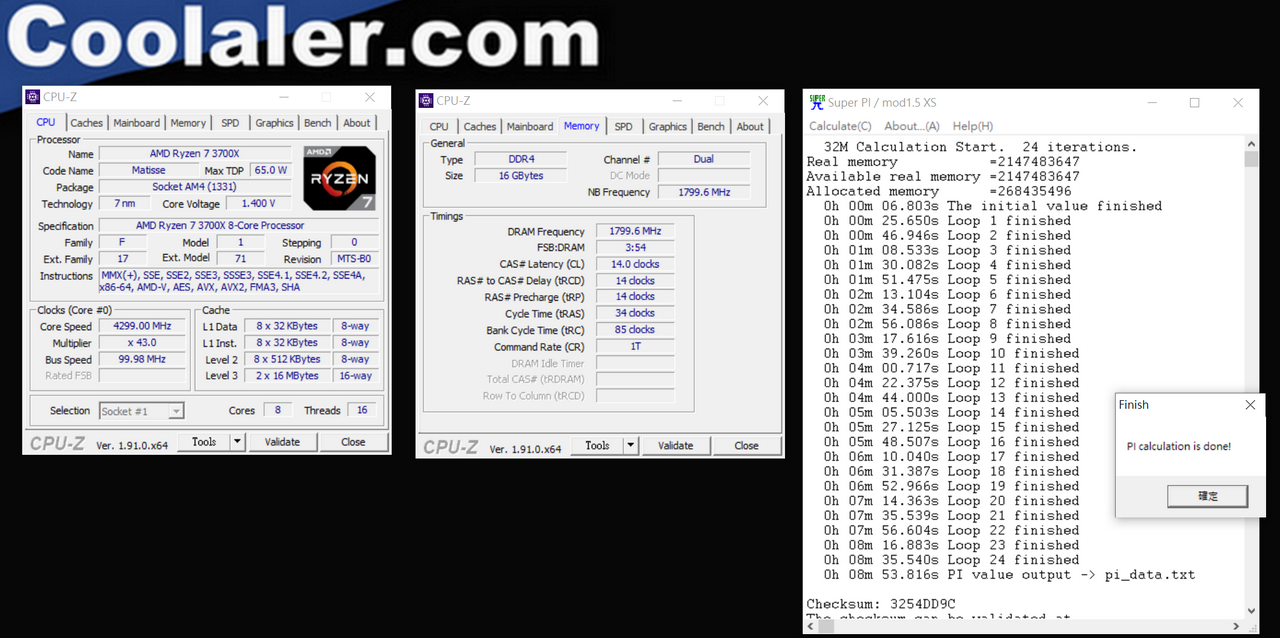
對照組 3700X@4.3GHz
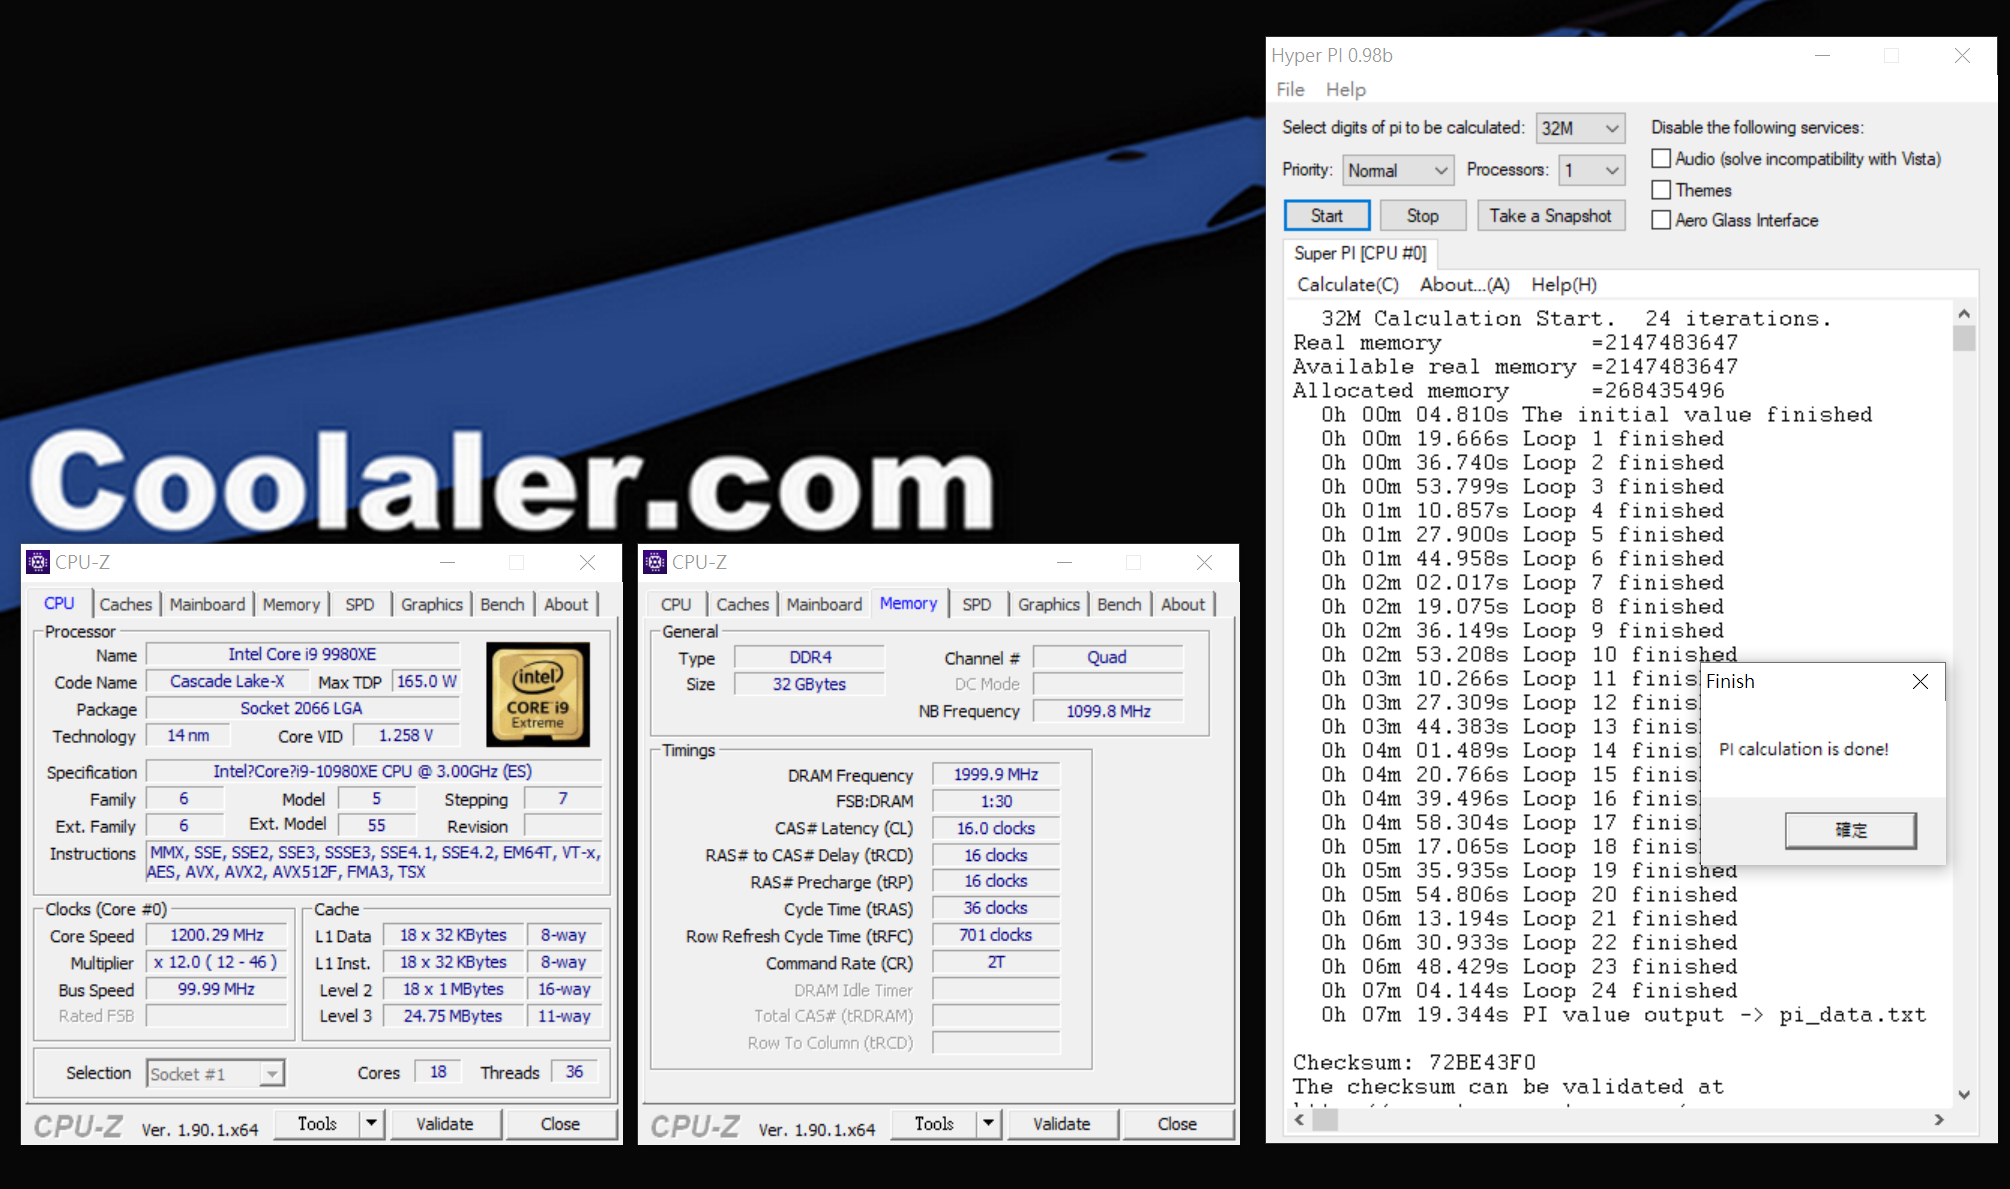
對照組10980XE@Boost
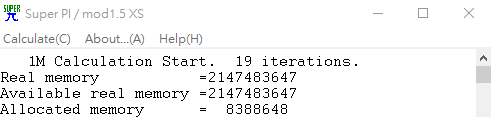
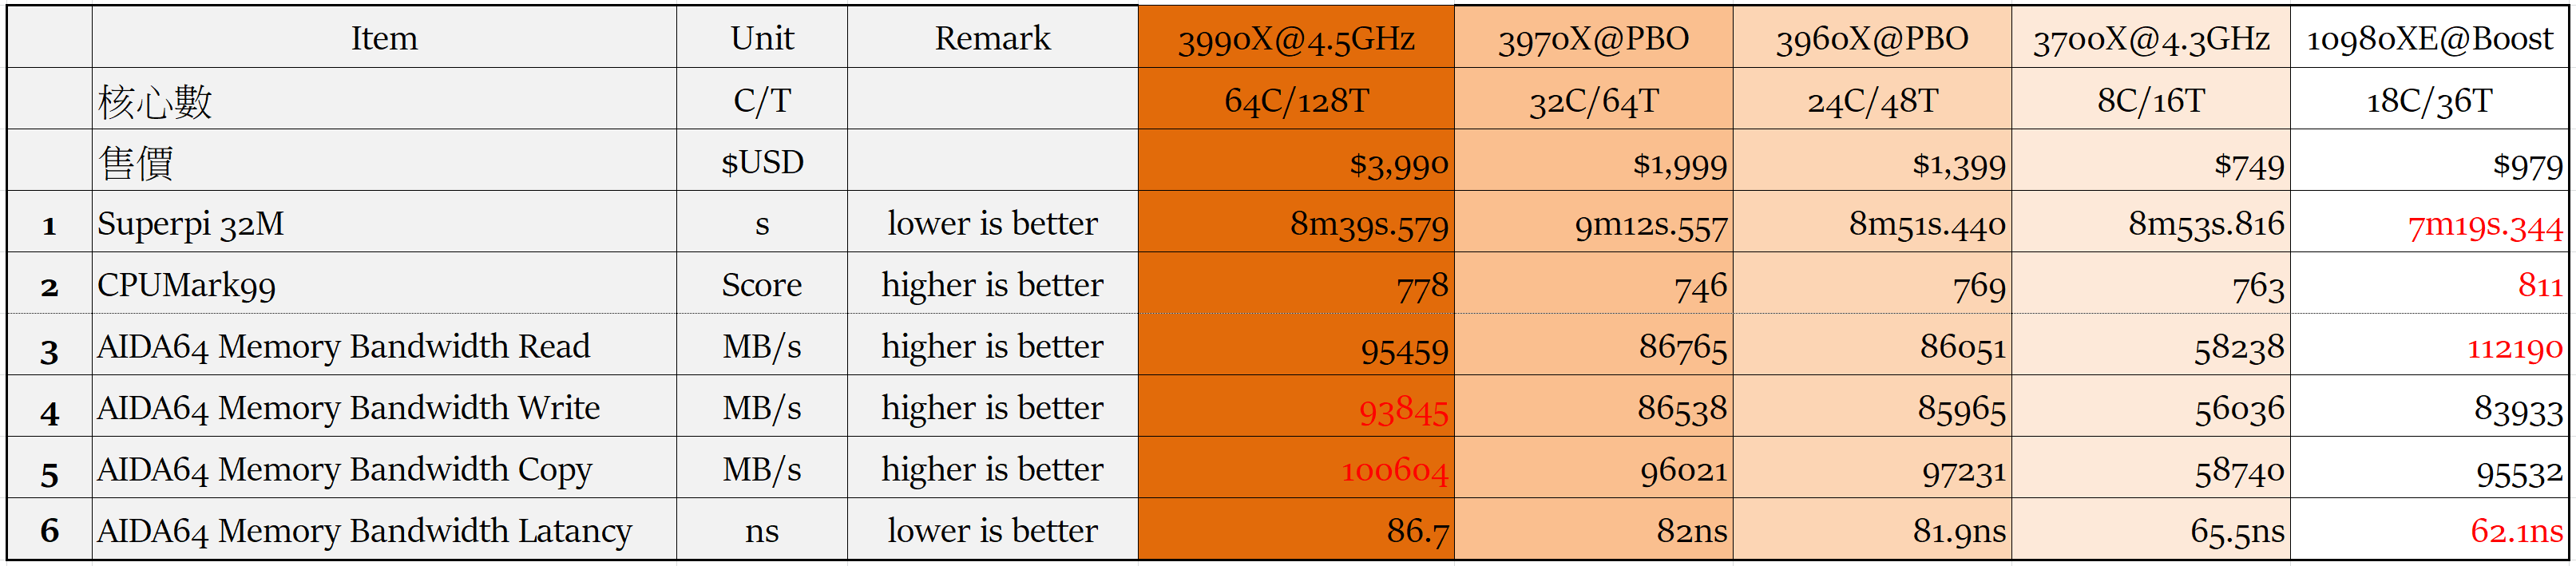
1.SuperPi 32M
Superpi 32M
SuperPi 32m是一個計算圓周率的浮點運算程式,最大精確到小數點以後的 3200萬位數,該程式採用高斯-勒讓德演算法,並且於 1995年被日本電腦科學家金田康正使用 Windows環境下計算出精確到 232次方的圓周率,是一款在檢測單工效能時常用的程式,但在需要多工測試時亦可同時開啟多個程式同時運算
SuperPi 32M Results
3990X@4.5GHz之 SuperPi 32M:8m39s579 (Lower is better)

對照組 3970X@PBO之 SuperPi 32M:9m12s (Lower is better)

對照組 3960X@PBO之 SuperPi 32M:8m51s (Lower is better)

對照組 3700X@4.3GHz之 SuperPi 32M:8m53s816 (Lower is better)
對照組 10980XE@Boost之 Superpi 32M為 7m 19.344s (Lower is better)
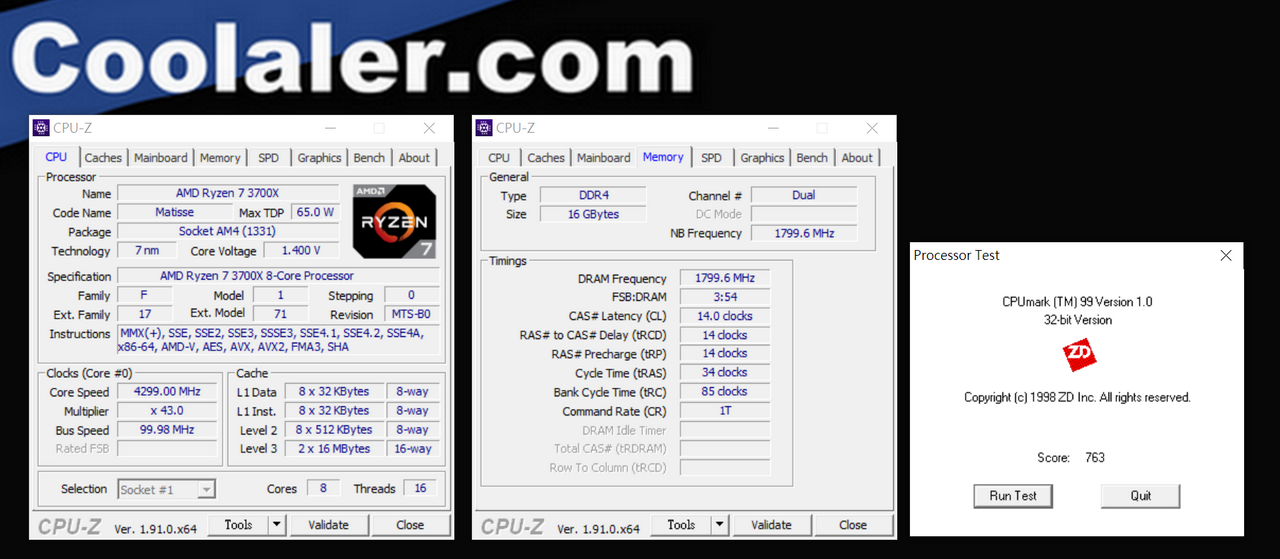
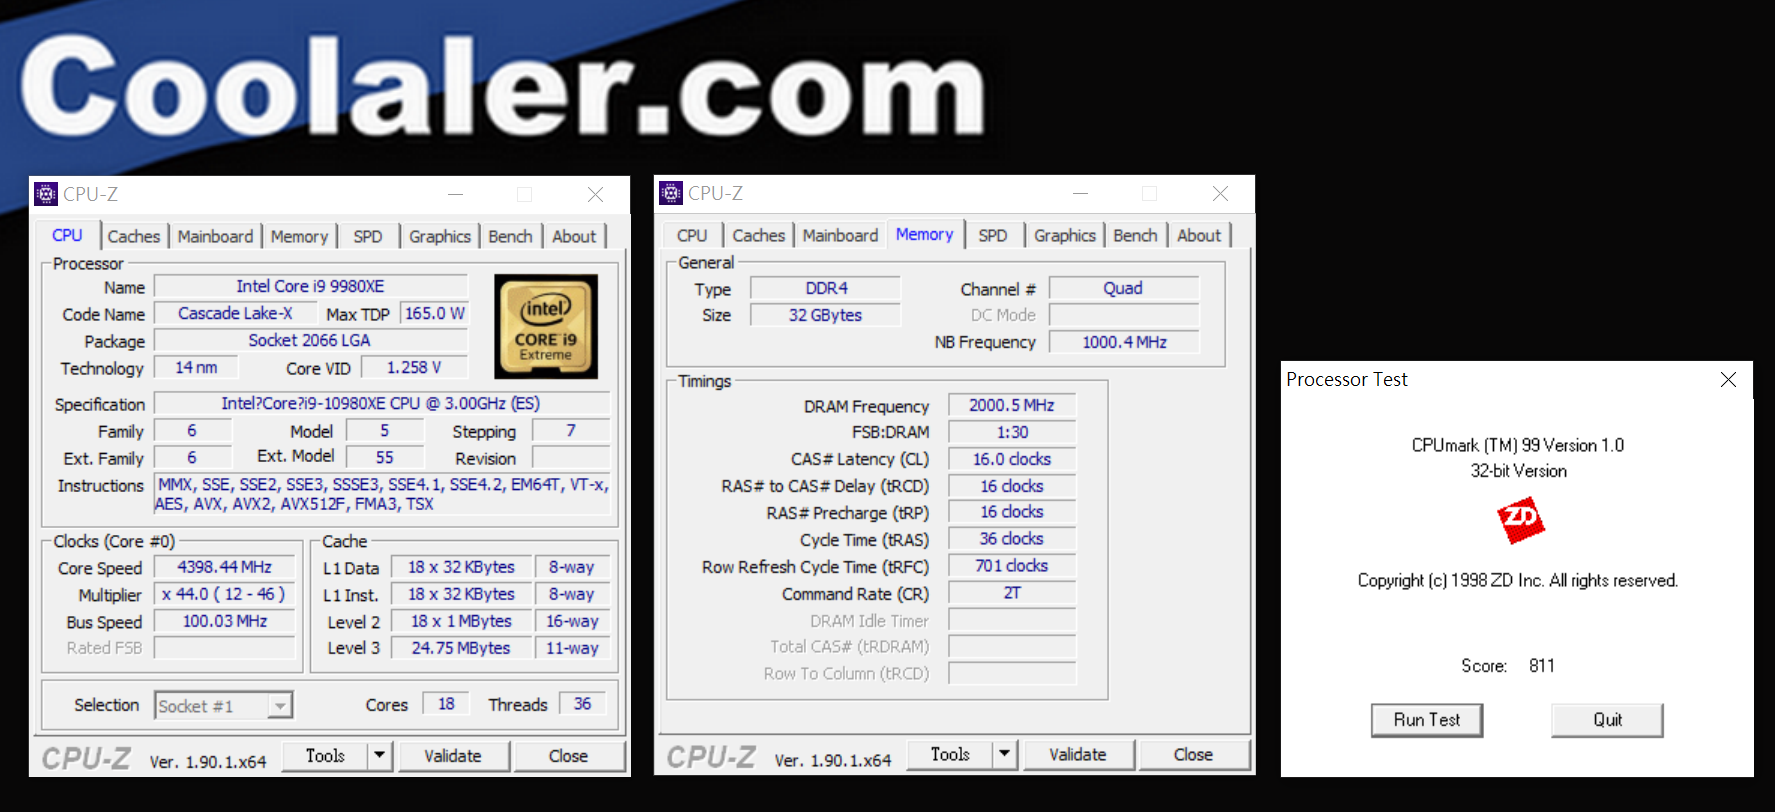
2.CPUMrk99
CPUMark99是專門用于 Windows的一款運算測試軟體,測試過程簡短且只支援單工
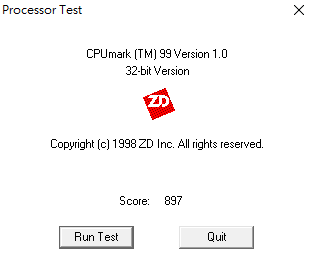
CPUMark99 Results
3990X@4.5GHz之 CPUMark99:778分

對照組 3970X@PBO之 CPUMark99:746分

對照組 3960X@PBO之 CPUMark99:769分

對照組 3700X@4.3GHz之 CPUMark99:763分
對照組 10980XE@Boost之 CPUMark99:811分
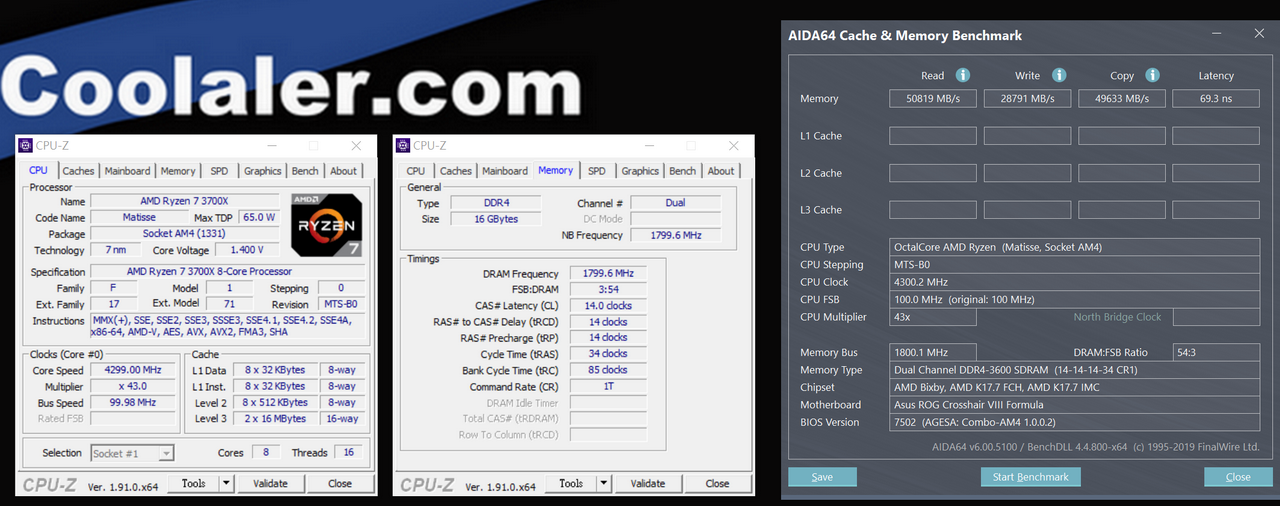
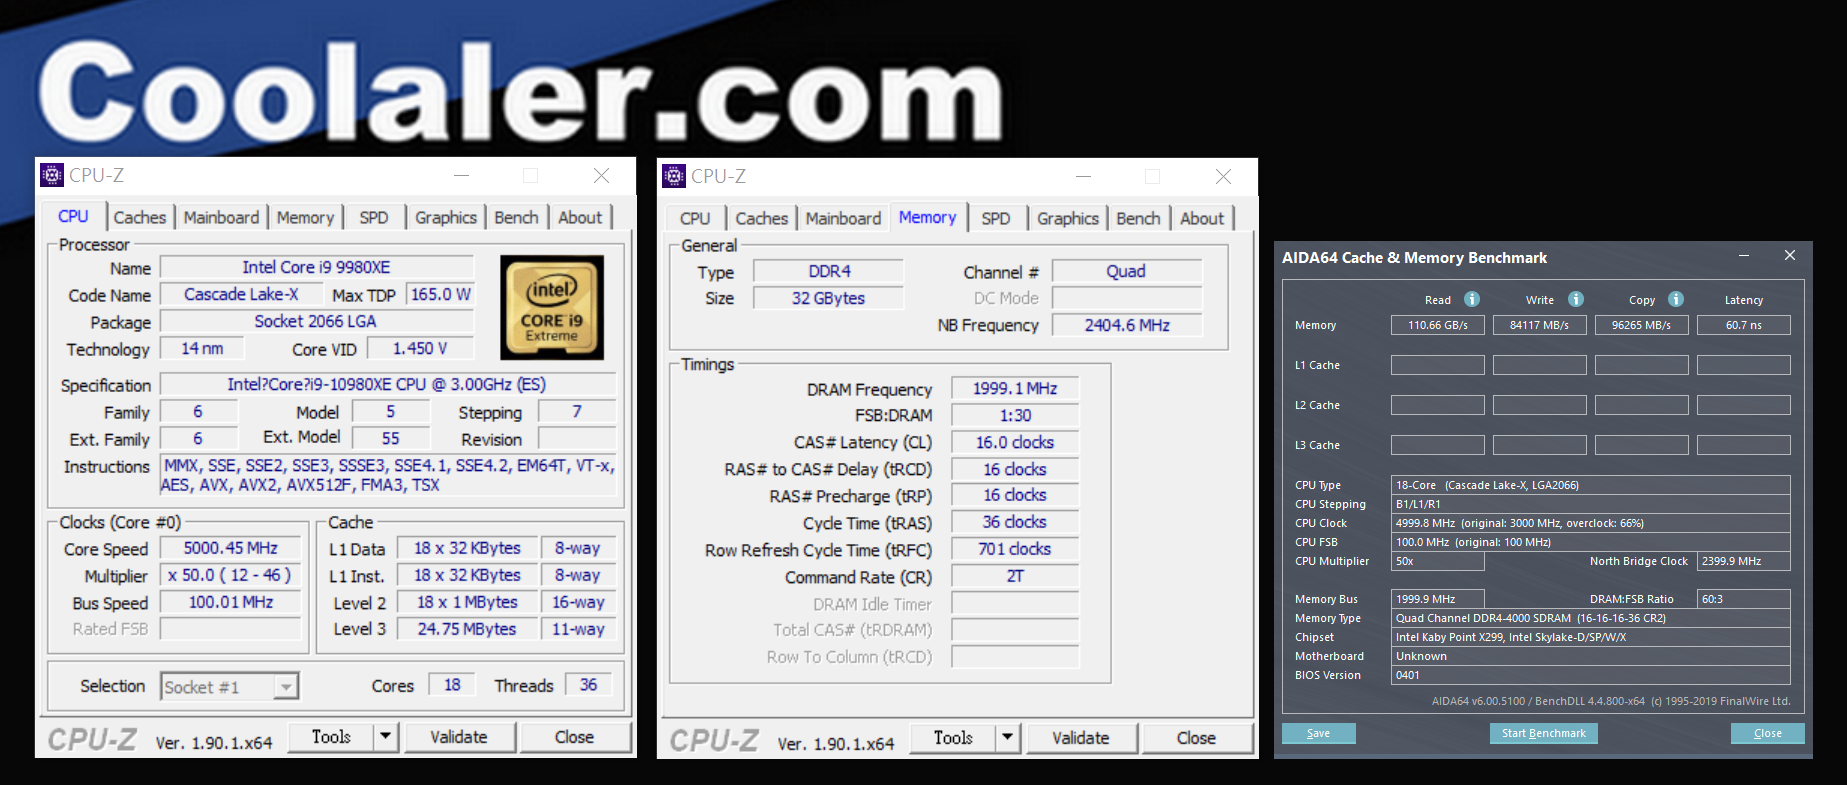
3.AIDA64 Memory Bandwidth Benchmark
此基準測試可測量 CPU高速緩存和系統內存的帶寬和延遲。通過雙擊窗口中的任何矩形,列或行,我們可以單獨啟動基準測試或基準測試類型。例如,如果我們雙擊 “Memory”,則只會運行系統內存讀取,寫入,複製和延遲基準測試,即只執行給定行中的操作。同樣,如果我們雙擊 “Read”,則只會對所有內存類型運行讀取基準測試,即只執行給定列中的操作。如果我們雙擊任何矩形,則只會運行選定的單個基準。
右鍵單擊 “Start Benchmark”按鈕將打開一個上下文菜單,我們可以在其中選擇運行所有基準測試或僅運行內存或緩存基準測試

AIDA64 Memory Bandwidth Benchmark Results
3990X 4.5GHz@DDR4 3600 16-20-20-20-40同步
Read: 95459MB/s
Write: 93845MB/s
Copy: 100604MB/s
Latancy: 86.7ns

對照組 3970X PBO@DDR4 3200 14-14-14-34
Read:86765MB/s
Write: 86538MB/s
Copy: 95061MB/s
Latancy: 82.0ns

對照組 3960X PBO@DDR4 3200 14-14-14-34
Read: 88051MB/s
Write: 85965MB/s
Copy: 97231MB/s
Latancy: 81.9ns

對照組 3700X 4.3GHz@DDR4 3600 14-14-14-34同步
Read: 50819MB/s
Write: 28791MB/s
Copy: 49633MB/s
Latancy: 69.3ns
對照組 10980XE 5GHz@DDR4 4000
Read: 110660MB/s
Write: 84117MB/s
Copy: 96265MB/s
Latancy: 60.7ns
測試項目 D比較表
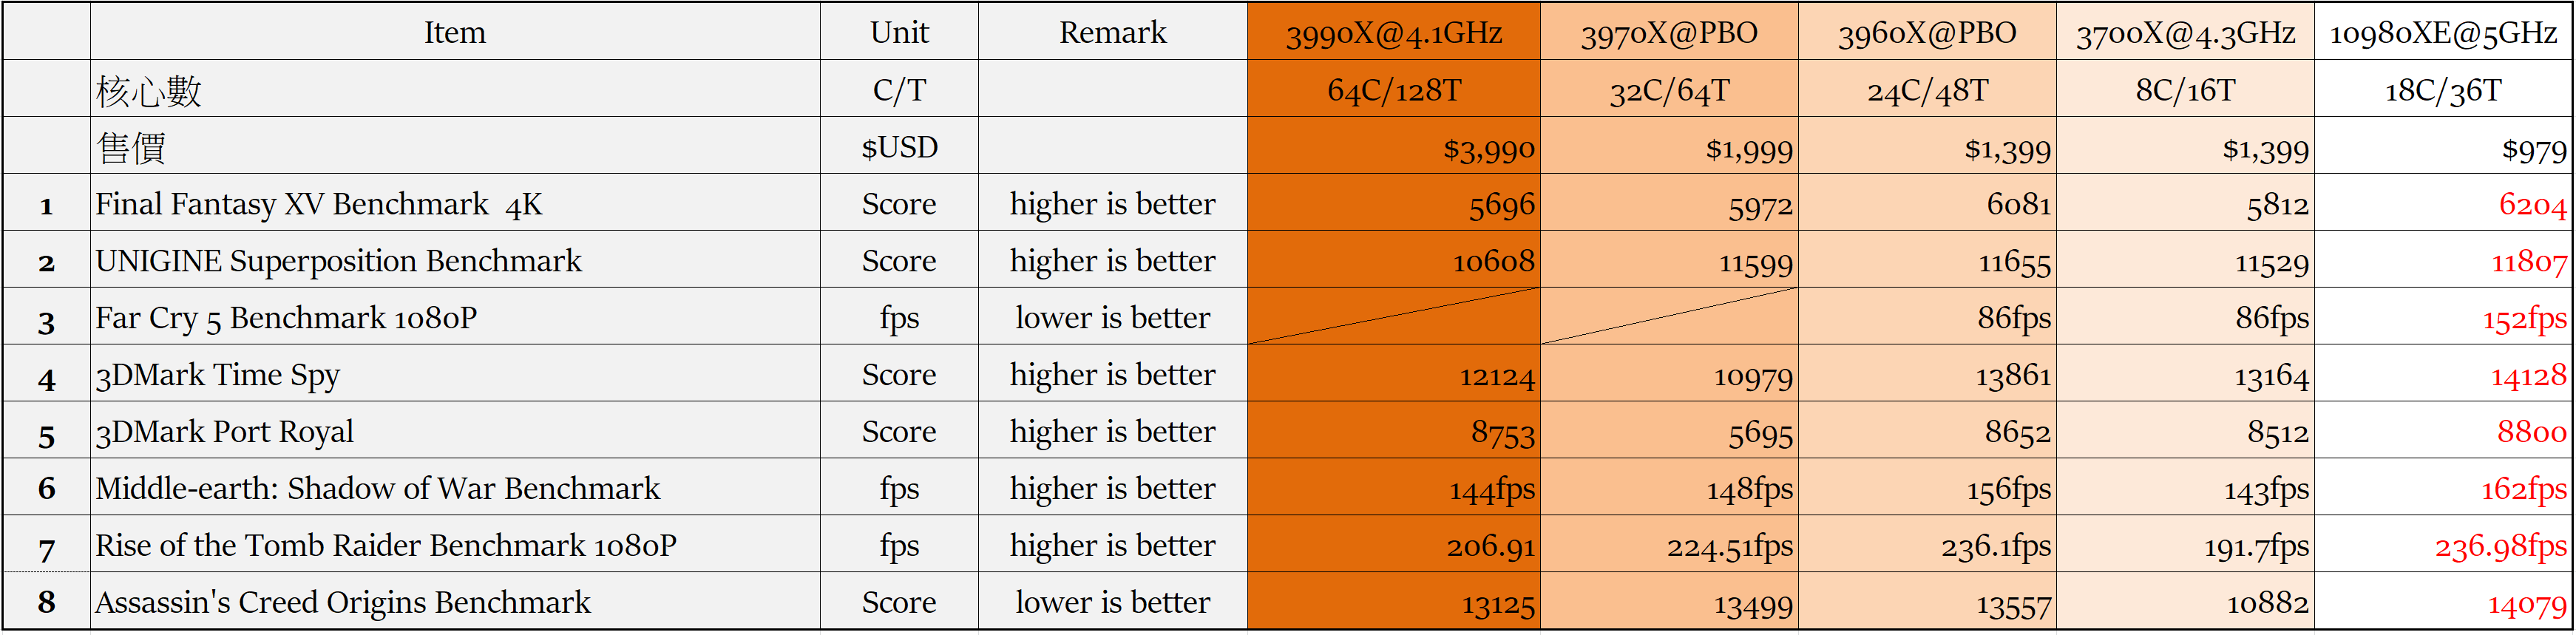
測試項目 E:
1.Final Fantasy XV Benchmark
2.UNIGINE Superposition Benchmark
3.3DMark Time Spy
4.3DMark Port Royal
5.Middle-earth: Shadow of War Benchmark《中土世界:戰爭之影》
6.Rise of the Tomb Raider Benchmark《古墓奇兵:崛起》
7.Assassin's Creed Origins Benchmark《刺客教條:起源》
8.Far Cry 5 Benchmark《極地戰嚎5》
測試設定:
3990X@4.0GHz DDR4 3600 128GB同步
對照組 3970X@PBO
對照組 3960X@PBO
對照組 3700X@4.3GHz
對照組10980XE@5GHz
1.Final Fantasy XV Benchmark
Final Fantasy XV《太空戰士 15》的Benchmark,是一款由史克威爾艾尼克斯在 2016年 11月推出的動作角色扮演遊戲《Final Fantasy系列》的第 15部,依照傳統,太空戰士都有 Benchmark的項目

Final Fantasy XV Benchmark 4K Results
3990X@4.0GHz之 Final Fantasy XV Benchmark:5696分

對照組 3970X@PBO之 Final Fantasy XV Benchmark:5972分

對照組 3960X@PBO之 Final Fantasy XV Benchmark:6081分

對照組 3700X@4.3GHz之 Final Fantasy XV Benchmark:5812分

對照組 10980XE@5GHz之 Final Fantasy XV Benchmark:6204分

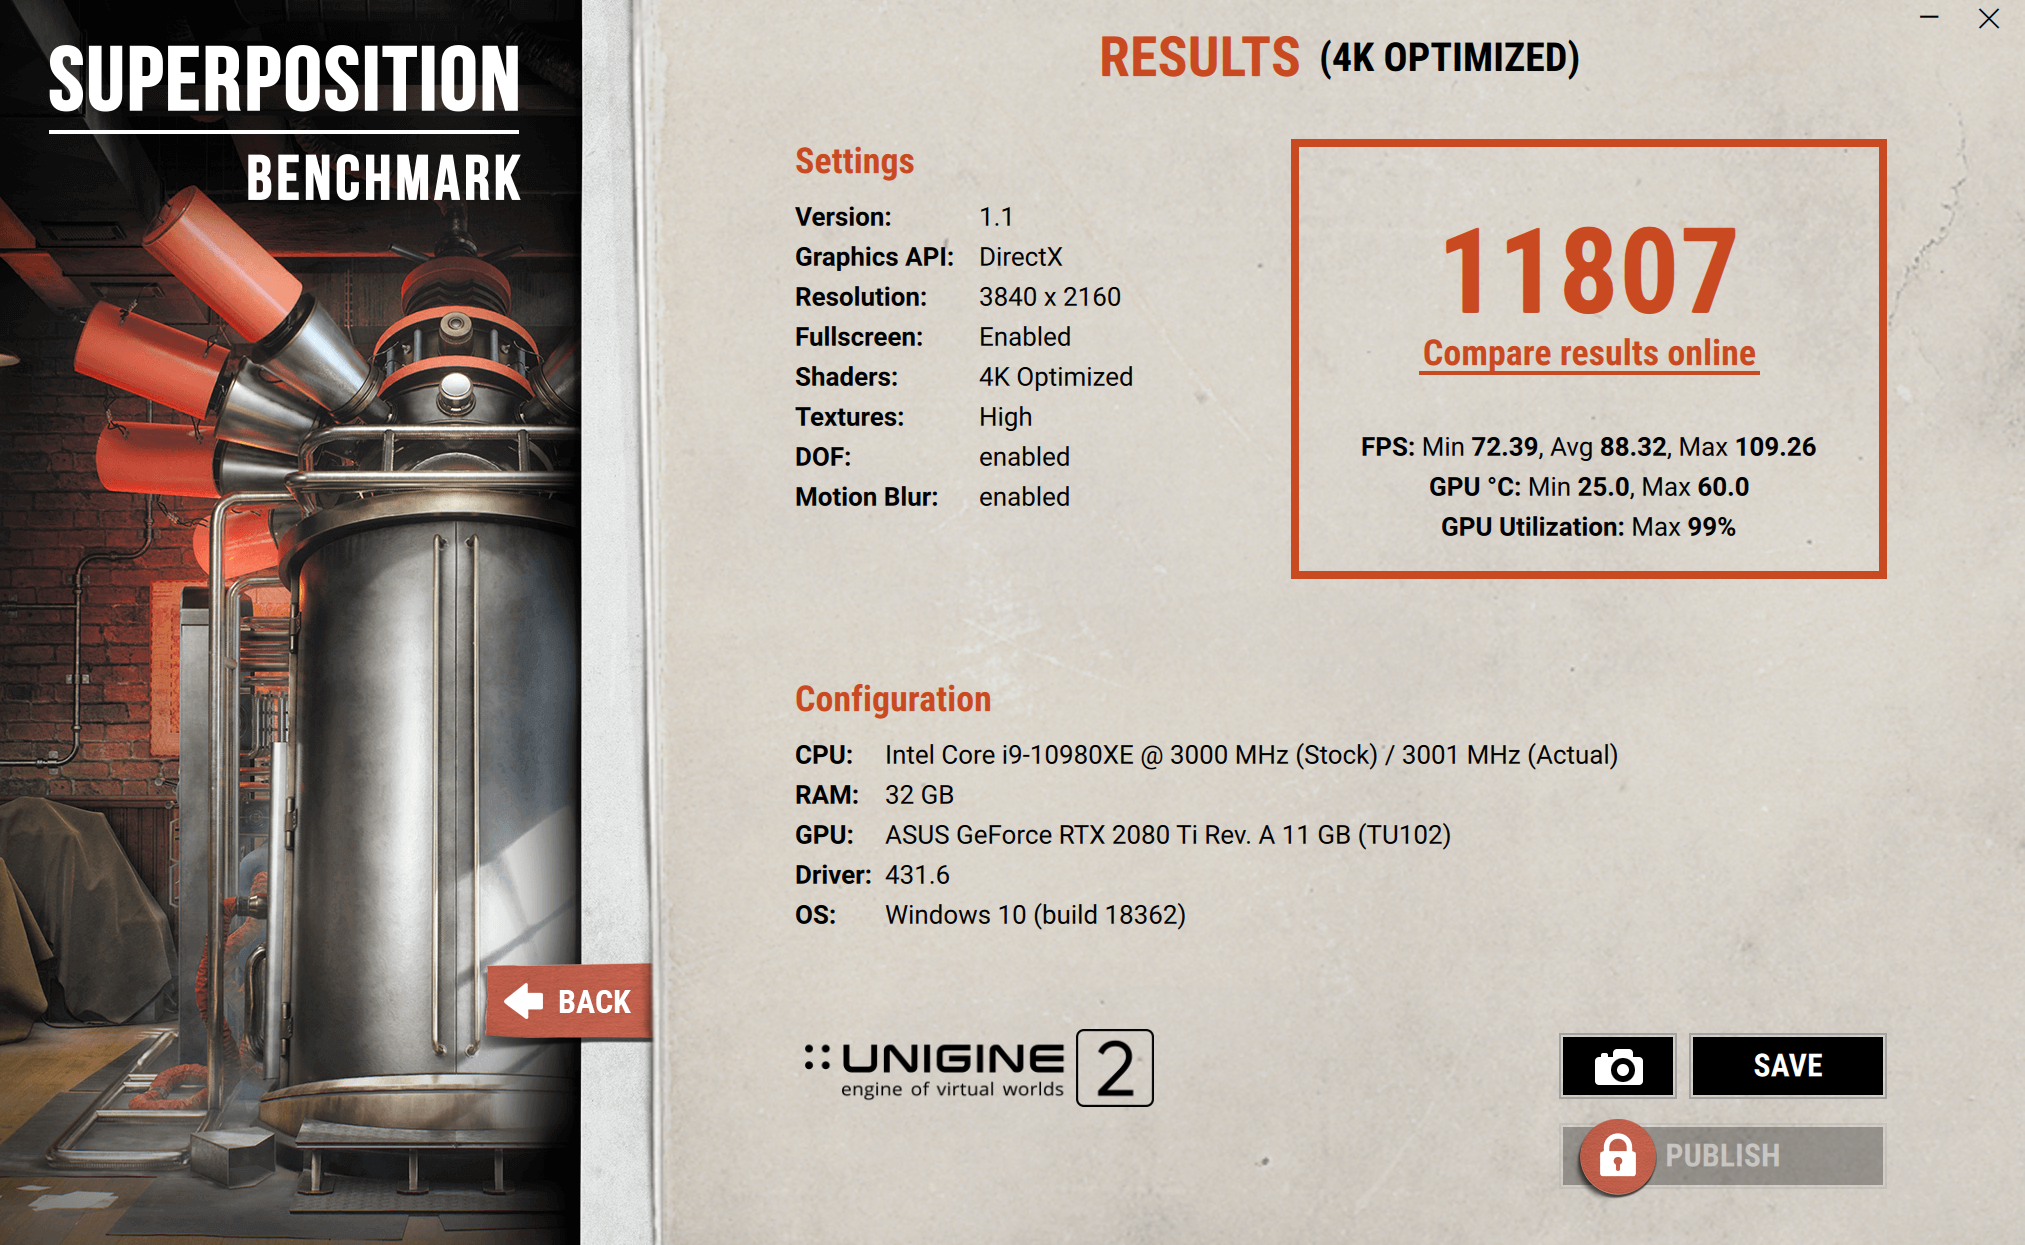
2.UNIGINE Superposition Benchmark
UNIGINE是一款專有的跨平台遊戲引擎,由俄羅斯軟件公司 UNIGINE Corp開發。除了用作遊戲引擎外,它還用於虛擬現實系統,嚴肅遊戲和可視化
UNIGINE最強大的功能是它的高級渲染器,支持 OpenGL 4.0和 DirectX 11,Superpositiojn則為 2017版本,包含極端性能和穩定性測試:視頻卡,電源,冷卻系統,檢查預設和超頻模式與真實負載及在環境中的互動體驗

UNIGINE Superposition Benchmark 4K Optimized Results
3990X@4.0GHz之 UNIGINE Superposition Benchmark:10608分

對照組 3970X@PBO之 UNIGINE Superposition Benchmark:11599分

對照組 3960X@PBO之 UNIGINE Superposition Benchmark:11655分

對照組 3700X@4.3GHz之 UNIGINE Superposition Benchmark:11529分

對照組 10980XE@5GHz之 UNIGINE Superposition Benchmark:11807分
3.3DMark Time Spy
3DMark Time Spy用來測試處理器及顯示卡之 3D圖形表現和工作負載,現由 UL擁有,主要是針對 DirectX 12的效能,測試有三個部分,第一個為顆粒陰影、曲面細分等效果,第二個則是光線追蹤的體積光照明技術,最後則是 CPU效能測試,在前兩個測試中,包含了數千萬個頂點跟多邊形,上百萬個曲面細分,這些都是 FireStrike的幾十倍

3DMark Time Spy Results
3990X@4.0GHz之 3DMark Time Spy:12124分

對照組 3970X@PBO之 3DMark Time Spy:10979分

對照組 3960X@PBO之 3DMark Time Spy:13861分

對照組 3700X@4.3GHz之 3DMark Time Spy:13164分

對照組 10980XE@5GHz之 3DMark Time Spy:14128分

4.3DMark Port Royal
3DMark 之 Port Royal加入 DirectX 12 的 DXR(DirectX Raytracing)選用 API 集,能夠於當代遊戲大量使用的光柵化成像,加入即時光影追蹤效果,以便達成視區外物件反射、即時陰影等光柵化無法達成的畫面效果

3DMark Port Royal Results
3990X@4.1GHz之 3DMark Port Royal:8753分

對照組 3970X@PBO之 3DMark Port Royal:5695分

對照組 3960X@PBO之 3DMark Port Royal:8652分

對照組 3700X@4.3GHz之 3DMark Port Royal:8512分

對照組 10980XE@5GHz之 3DMark Port Royal:8800分

5.Middle-earth: Shadow of War Benchmark《中土世界:戰爭之影》
Middle-earth: Shadow of War《中土世界:戰爭之影》亦為一自帶 Benchmark的角色扮演遊戲,是由 Monolith Productions開發並由華納兄弟互動娛樂發行並於 2017年 10月 10日在全球發布

Middle-earth: Shadow of War Benchmark Setting
Middle-earth: Shadow of War Benchmark 1080P Results
3990X@4.0GHz之 Middle-earth: Shadow of War Benchmark:144fps

對照組 3970X@PBO之 Middle-earth: Shadow of War Benchmark:148fps

對照組 3960X@PBO之 Middle-earth: Shadow of War Benchmark:156FPS

對照組 3700X@4.3GHz之 Middle-earth: Shadow of War Benchmark:143fps

對照組 10980XE@5GHz之 Middle-earth: Shadow of War Benchmark:162fps

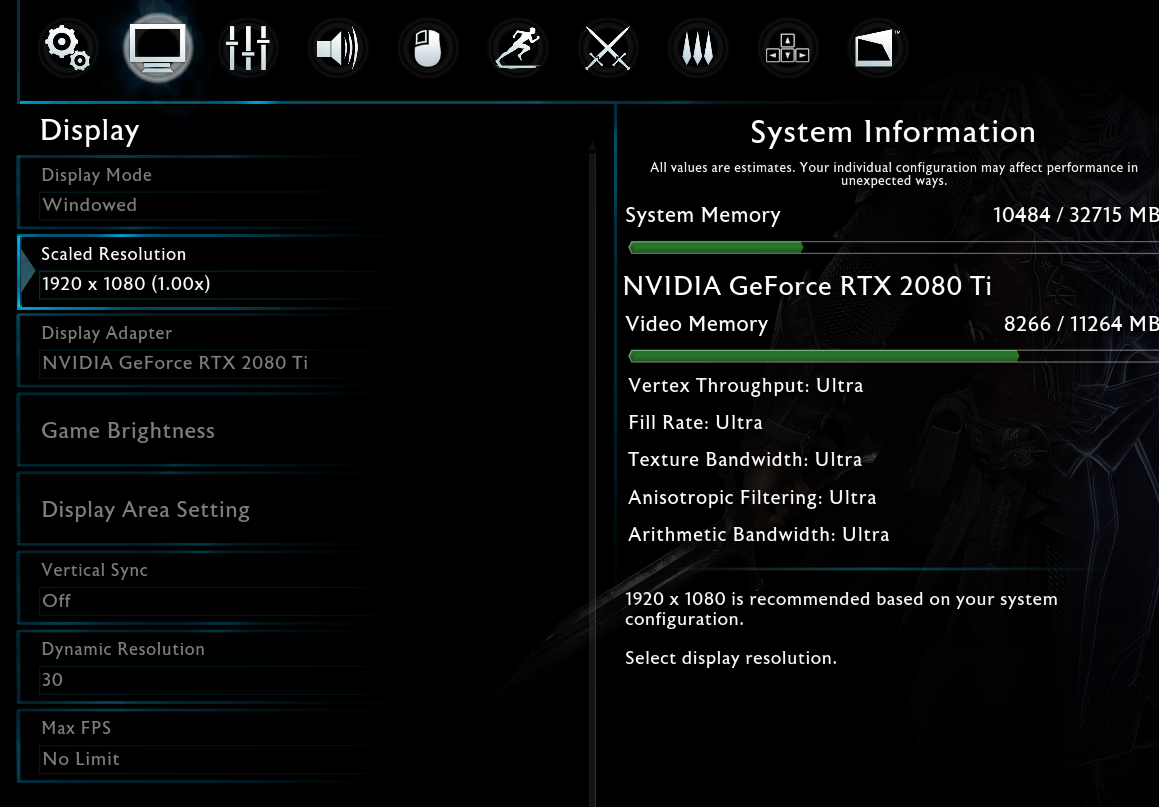
6.Rise of the Tomb Raider Benchmark《古墓奇兵:崛起》
Rise of the Tomb Raider《古墓奇兵:崛起》,是一款由晶體動力開發,微軟工作室和史克威爾艾尼克斯合作發行的動作冒險遊戲,同樣自帶測試軟體,本作是 2013年《古墓奇兵》的續作

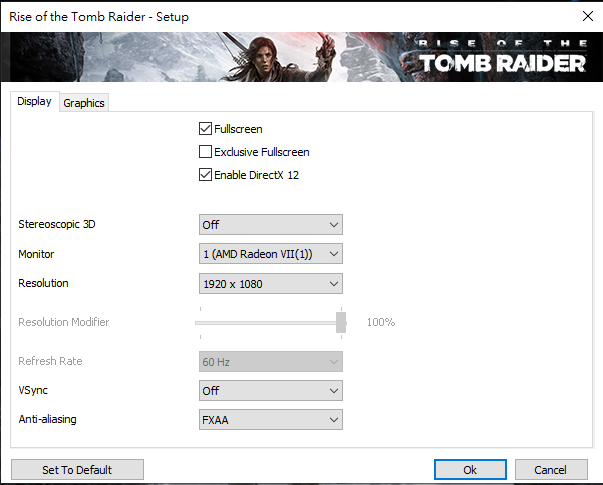
Rise of the Tomb Raider Benchmark Setting
Rise of the Tomb Raider Benchmark 1080P Overall fps Results
3990X@4.0GHz之 Rise of the Tomb Raider Benchmark Overall Score: 206.91fps

對照組 3970X@PBO之 Rise of the Tomb Raider Benchmark Overall Score: 224.51fps

對照組 3960X@PBO之 Rise of the Tomb Raider Benchmark Overall Score: 236.10fps

對照組 3700X@4.3GHz之 Rise of the Tomb Raider Benchmark Overall Score: 191.70fps

對照組 10980XE@5GHz之 Rise of the Tomb Raider Benchmark Overall Score: 236.98fps

7.Assassin's Creed Origins Benchmark《刺客教條:起源》
Assassin's Creed Origins《刺客教條:起源》中國大陸譯作「刺客信條:起源」)是一部由育碧蒙特婁開發由育碧公司發行的動作冒險遊戲
本作是刺客教條主系列的第十部作品,也是系列首次把時間線推前到刺客教條初代以前,同樣也自帶有測試軟體,遊戲的舞台是在托勒密王朝埃及豔后統治下的埃及,玩家所操控的角色是一位隸屬於法老的護衛,稱為守護者(Medjai),來自錫瓦(Siwa)名為巴耶克(Bayek)的埃及刺客

Assassin's Creed Origins Benchmark Setting

Assassin's Creed Origins Benchmark 1080P Results
3990X@4.0GHz之 Assassin's Creed Origins Benchmark:13125分

對照組 3970X@PBO之 Assassin's Creed Origins Benchmark:13499分

對照組 3960X@PBO之 Assassin's Creed Origins Benchmark為:13557分

對照組 3700X@4.3GHz之 Assassin's Creed Origins Benchmark為:10882分

對照組 10980XE@5GHz之 Assassin's Creed Origins Benchmark為:14079分

8.Far Cry 5 Benchmark《極地戰嚎5》
Far Cry 5《極地戰嚎5》是一個自帶 Benchmark的新遊戲,是由育碧蒙特婁、育碧多倫多開發和育碧軟體發行的開放世界第一人稱動作冒險遊戲

Far Cry 5 Benchmark Setting 1080P

Far Cry 5 Benchmark 1080P Results
3990X@4.0GHz之 Far Cry 5 Benchmark 不相容
對照組 3970X@4.0GHz之 Far Cry 5 Benchmark 不相容
對照組 3960X@PBO之 Far Cry 5 Benchmark 86fps

對照組 3700X@4.3GHz之 Far Cry 5 Benchmark 133fps

對照組 10980XE@5GHz之 Far Cry 5 Benchmark 152fps

測試項目 E比較表
結論:
經過冗長的實測之後,我們看到 3990X在 4.0~4.1GHz的表現硬是比官方在簡報中所介紹(請參考本文前面的官方效能介紹)的效能高出了許多,接著我們再來看看 3990X VS 10980XE在創作及多工的效能比對
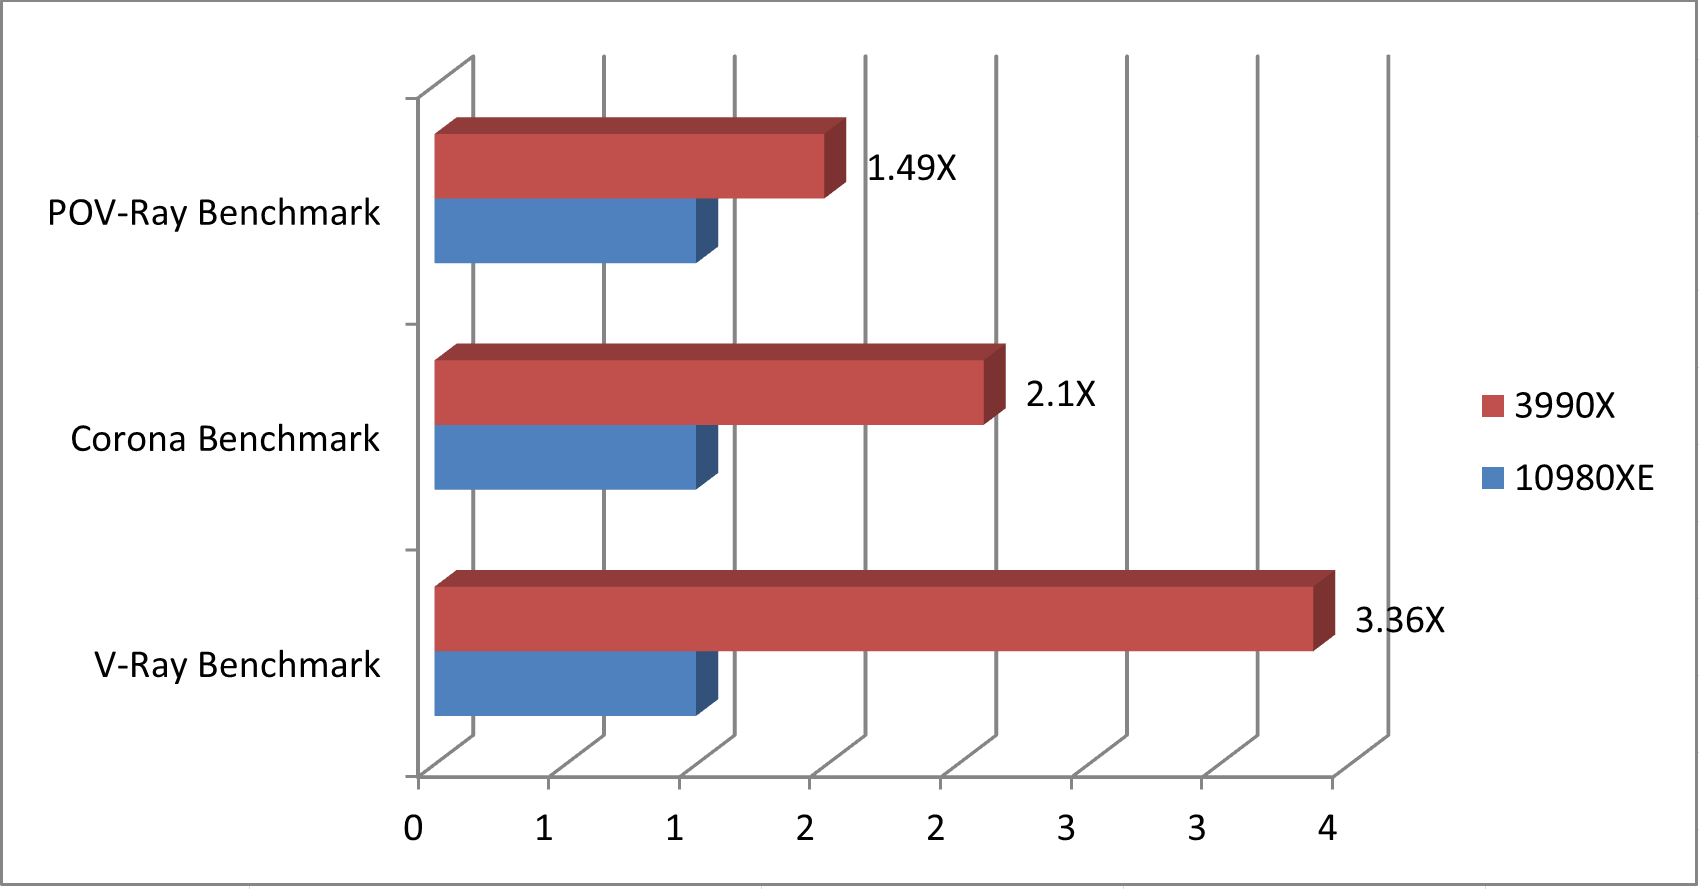
a.在創作方面
3990X在 Corona Benchmark 3990X的得分是 10980X的 2.1倍
在 POV-Ray Benchmark 3990X的得分是 10980X的 1.49倍
在 V-Ray Benchmark 3990X的得分是 10980X的 3.36倍
3990X VS 10980XE在創作效能比對
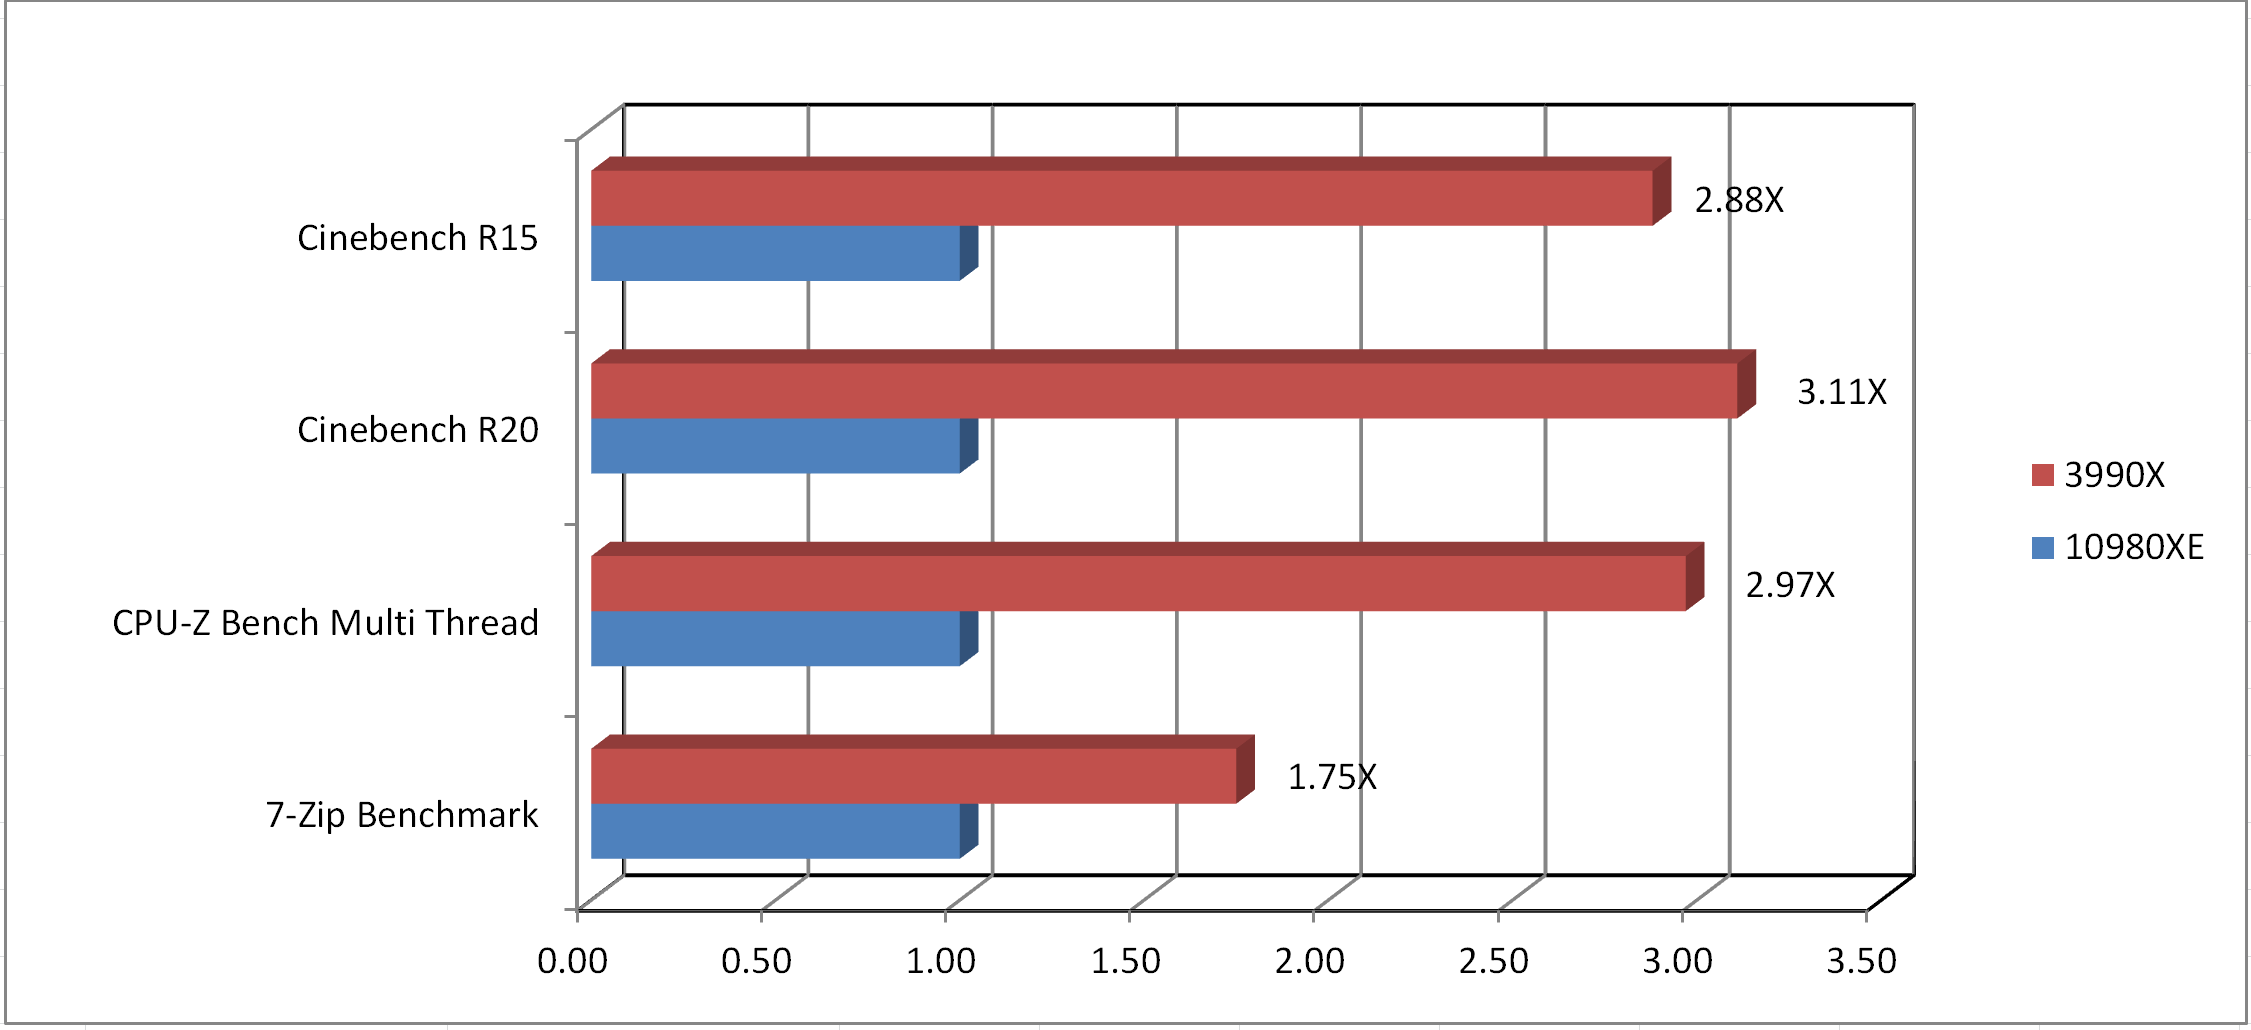
b.在多工方面
3990X在多工效能上與其他核心數的處理器相比
64核心 3990X在 Cinebench R15的得分 13328cb是 32核心 3970X 7398cb的 1.8倍,是 8核心 3700X 2610cb的 5.10倍,是 18核心10980XE 4630cb的 2.88倍
在 Cinebench R20 64核心3990X的得分 32028pts是 32核心 3970X 17066pts的 1.88倍,是 18核心10980XE 10282pts的 3.11倍
在 CPU-Z Bench 64核心 3990X的得分 37447.1是 32核心 3970X 21734的 1.72倍,是 18核心10980XE 12593的 2.97倍
在 7-Zip Benchmark 64核心 3990X的得分 267157MIPS是 32核心 3970X 246606MIPS的 1.08倍,是 18核心10980XE 152765MIPS的 1.75倍
3990X VS 10980XE在多工效能比對
綜合以上,我們看到核心數愈多的處理器對創作者的幫助愈大(當然頻率愈高幫助也愈大)但核心數愈多(頻率愈高)的處理器其所產生的功耗也將愈大,尤其是超頻至 4.0GHz以後其功耗更是不容小覷,經過滄者極限監測 3990X在 4.0GHz以上的多工測試,其功耗動輒高達 1000W以上,因此要超頻的使用者建議搭配 1200W以上的電源供應器是必須的,對不想超頻的使用者來說 800W的電源供應器就已經足夠
在處理器的散熱方面要注意的是散熱器底部的面積要足以覆蓋處理器晶片,散熱器扣具的磅數也要足夠,就這二點來說,Wraith Ripper官方風冷散熱器就絕對會比一般 AIO水冷散熱器來的好
高核心數處理器的存在其實是有必要的,對創作者而言只要能加快執行力、減少創作時間對創作者來說就是好貓,尤其是在看過 3990X多工實測之後,售價哪怕是再比現在多一倍相信創作者也會買單,雖然愈多的核心數會增加愈多的功耗,並降低更多的基礎頻率與超頻幅度,但好在的是對創作者而言只要能加快執行力、減少創作時間才是首要
負責技術與工程的 AMD技術長暨執行副總裁 Papermaster曾表示,未來將會有更多軟體支援多核心加快處理程序,更多的應用程式支援多核心多執行緒,所以多核心在短期內還看不到飽和點,的確 Papermaster說的沒錯,只要保持內核數量以及軟體效能之間的平衡,這種多核心的趨勢應該繼續下去;但未來再繼續開發多核心數處理器的同時,不論是哪個廠商都將面臨半導體製程升級的難度愈來愈大,開發成本愈來愈高的狀況,而這些難度與狀況是否會讓 64核心的 3990X成為各廠商在短期內不想跨越、或是難以跨越的門檻,且讓我們繼續看下去
還記得 AMD的第一款雙核心桌上型處理器是在 15年前 2005年 5月誕生的嗎?從此桌上型處理器步入了多核心時代,而在 15年後的今天,全球首顆 64核心桌上型處理器 Ryzen Threadripper 3990X解禁開賣了
這顆 3990X與才在 3個月前上市的 3970X同為 TR 3000家族,同為 TSMC 7nm製程,而 3990X的上市讓桌上型處理器核心數在短短 3個月成長了 2倍,在 15年間成長了 64倍,也讓 AMD穩居多核心桌上型處理器的霸主
3990X的基礎核心頻率為 2.9GHz (3970X為 3.7GHz ) Boost頻率為 4.3GHz (3970X為 4.5GHz ) ,Total L3 Cache為 256MB (3970X為 128MB )、PCIE 4.0同為 88 Lanes、TDP同為 280W、4通道最大速度 DDR4 3200,並支援 ECC Memory
為了控制 TDP在相同的情況下,從 3990X與 3970X的頻率比較可看出,當處理器的核心數愈多其基礎頻率就愈低,至於該如何維持核心數與頻率之間的平衡 (多工效能與單工效能間的平衡) 在開發多核心成為趨勢的當下則將是廠商必須面對的課題
在定價方面 3990X則因為核心數倍增的關係器其預定售價 $3,990美元 (相當於台幣 $120,000元) 也是 3970X的 2倍,但 3990X是不是值得這個價當您耐心的看完本篇之後心中自有答案,稱 3990X為創作者或發燒級玩家的夢幻極品並不為過
滄者極限也在前幾天受邀對這顆 3990X Sample進行測試,測試的設定除了有別於官方的預設頻率而改以在多工創作 4.0GHz、4.1GHz,單工 4.5GHz,遊戲 4.0GHz進行之外,測試的軟體則有多工的 Corona、POV-Ray、Cinebench R15、R20、CPU-Z Bench、7-Zip、X264 FHD Benchmark、V-Ray Benchmark、Geekbench,以及單工、遊戲、浮點運算,3990X在不同頻率的測試結果並會與不同核心數的對照組 Core i9-10980XE、3970X、3960X、3700X、2990WX做比對,以分析在不同核心數不同處理器頻率的設定下,對多工創作及單工遊戲的影響,敬請持續關注
3990X官方系統配置建議
3990X官方效能介紹
3990X在官方 Cinebench R20的分數為 25000左右,是 3970X的 1.48X,是 3960X的 1.83X,是 3950X的 2.82X
64-Core Topology
3990X的 Topology架構,在中間的是 12nm製程的 I/O die,上下則各有 4個 7nm的 Chiplet,每個 Chiplet有 8Cores,每個 Chiplet並各自擁有 32MB的 L3 Cache,各個 Chiplet透過 Infinity Fabric技術連結到中間的 I/O die,Zen 2的 Infinity Fabric技術降低了 27%的功耗,並且可為 CPU核心分配到更多的電量與更高的效能,各個 Chiplet均具有與 I/O die的直接 IFOP連接,從而可以公平地獲取 DRAM和 PCIe資源,每個 IFOP鏈路均以1600Clock提供 51.2GB/s的讀取速度和 25.6GB/s的寫入速度
因為 Chiplet的配置可使處理器擁有更快的 DRAM和更高的核心頻率,在文件壓縮之類的處理速度上更提高了 2倍
AMD TRX40 Chipset
Threadripper 3000的 PCI Express升級到 PCIe Gen 4,在處理器和 TRX40之間的頻寬也較上一代增加了 4倍,可用的 PCIe Lanes也從之前的 60 Lanes增加到 72 Lanes,跟 X299平台相比 TRX40的頻寬多了 2.5倍
Cinebench R20 nT Performance
V-Ray Performance
Cinebench R20 Performance
POV-Ray Performance
Cinebench R15 Performance
Keyshot Camera Benchmark
Corona Benchmark
Blender Benchmark
Arnold Renderer for Maya test
Vedio Encoding Performance
CHAOS Group V-Ray
Xeon W-3275 VS 3990X VS 3970X
3D Rendring
Movie Mastering & Encoding
Software Compiling
從以上的官方效能介紹中可以看出,3990X在預設時的表現就已經是當前最強的創作型處理器,接著就來看看 3990X設在 4.0~4.1GHz時是否能穩定通過各項創作及多工的測試,以及在 4.0~4.1GHz的設定下其各項實測的效能又將能增加多少
3990X開箱
在看測試前先來看看 3990X的開箱與安裝
3990X處理器外盒其實是與 3970X相同的,將處理器外盒移開後先將裝有處理器的塑膠盒從底座盒中取出,這時就可以看見底座盒內還放有水冷轉接架、Socket座扭力扳手、說明書、貼紙
接著再將處理器塑膠盒上之 AMD LOGO標籤貼紙切開,就可以將透明塑膠蓋掀開,並將裝有 3990X的保護盒取出
在保護盒的一側可以看到外露的處理器助裝器 (橙黃色的小耳朵) 由一個卡榫固定住
先將卡榫往下壓就可以將卡榫移除,然後再拉住橙黃色的小耳朵往外抽,就可以將處理器從保護盒中取出了
3990X處理器的安裝
先將 Socket蓋掀起,再握住助裝器小耳朵連同處理器從 Socket蓋上端邊緣的槽中慢慢的插入
待處理器插入底處並確認與 Socket蓋完全密合後就將 Socket蓋下壓扣緊
接著再以配件中所附的扭力扳手將位於 Socket座的 3顆螺絲按照 Socket上之 1~2~3的順序鎖緊,欲取出處理器時則反向為之
測試平台
CPU1:AMD Ryzen Threadripper 3990X
CPU2:AMD Ryzen Threadripper 3970X
CPU3:AMD Ryzen Threadripper 3960X
CPU4:AMD Ryzen Threadripper 2990WX
CPU1~4 cooler:Wraith Ripper官方散熱器
CPU5:AMD Ryzen 7-3700X
CPU5 cooler:Wraith Prism原廠散熱器
CPU6:Intel Core i9-10980XE
CPU6 cooler:Thermalright IB-E Extreme
M/B1 :ASUS ROG Zenith II Extreme Alpha X399 BIOS 0807
M/B2:GIGABYTE AORUS TRX40 XTREME
M/B3:ASUS ROG RAMPAGE VI EXTREME ENCORE BIOS 0401
MEM1 :G.SKILL Trindent Z RGB 16GBX8 128GB DDR4 3600同步 QUAD Channel
MEM2 :G.SKILL Trindent Z RGB 8GBX4 32GB DDR4 3600同步 QUAD Channel
SSD:CORSAIR Force MP600 Gen4 PCIe x4 NVMe M.2 SSD 2TB
OS :WIN10 64bit 1909
Graphic Card:ASUS ROG STRIX RTX 2080 TI 11GB
PSU:Thermaltake 1200W
3990X平台照
測試項目 A:
1.Corona Benchmark
2.POV-Ray
3.Geekbench
測試設定:
3990X@4.0GHz DDR4 3600 128GB同步
對照組10980XE@5GHz
1.Corona Benchmark
Corona是由 Corona Labs Inc.在 2009年中開發的軟件開發套件 ,而 Corona Benchmark則是渲染引擎的測試軟體,它可以構建 iOS ,Android和 Kindle的 2D 移動應用程序,Windows和 OS X的桌面應用程序以及Apple TV,Fire的聯網電視應用程序電視和 Android電視
Corona使用位於 C ++ / OpenGL之上的集成 Lua構建圖形應用程序。 該軟件具有兩種操作模式:Corona Simulator和Corona Native。 使用 Corona Simulator,可以直接從 Corona Simulator構建應用程序。 Corona Native允許您將 Lua代碼和資產集成到 Xcode或 Android Studio項目中,以構建您的應用並包含本機功能
Corona Benchmark Results
3990X@3.9GHz之 Corona Benchmark 17,443,558Rays/s
對照組 10980XE@5.0GHz之 Corona Benchmark 8,045,850 Rays/s
2.POV-Ray Benchmark
POV-Ray全名是 Persistence of Vision Raytracer,是一個使用光線跟蹤繪製三維圖像的開放原始碼自由軟體。運行 POV腳本語言。它是基於 DKBTrace來開發的,DKBTrace是由 David Kirk Buck和 Aaron A. Collins編寫在 Amiga上的。POV-Ray早期也受到了 Polyray raytracer作者 Alexander Enzmann的幫助。很多漂亮的圖片就是由 POV-Ray來製作的
POV-Ray Benchmark Results
3990X@4.0GHz之 POV-Ray 為 924.69s (lower is better)
對照組 10980XE@5.0GHz之 POV-Ray 1380.89s (lower is better)
3.Geekbench
Geekbench是一款跨平台的處理基準測試程序,其評分系統可分為單核和多核性能,以及模擬真實使用場景的工作負載能力。有 Geekbench 2、Geekbench 3,而目前的 Geekbench 4版本所使用的分數是基於 4000的基線分數計算的,這代表表現Intel Core i7 -6600U @ 2.60 GHz的性能。軟體基準測試適用於 macOS、Windows、Linux、Android和 iOS。Geekbench 4還測量 GPU性能包括圖像處理和 計算機視覺等領域
Geekbench Results
3990X@4.0GHz之 Geekbench Multi Core 23815 Single Core 1208
對照組 10980XE@5.0GHz
Geekbench Multi Core17561 Single Core 1365
測試項目 A比較表
測試項目 B:
1.Cinebench R15 Benchmark
2.CPU-Z Bench
測試設定:
3990X@4.0GHz DDR4 3600 128GB同步
3990X@4.1GHz DDR4 3600 32GB同步
對照組 2990WX@4.1GHz
對照組 2990WX@5.1GHz
對照組 3970X@PBO
對照組 3960X@PBO
對照組 3700X@4.3GHz
對照組 3700X@5GHz
對照組10980XE@5GHz
1.Cinebench R15 CPU Test
Cinebench是一個真實的跨平台測試套件,用於評估計算機的硬件功能,由於它是以 Cinema 4D動畫製作軟體為基礎進行測試,所以能夠反應出多線程處理器與顯示卡面對實際應用軟體所能發揮的效能,且能在短時間內得知測試結果,是一個能快速得知是否能 All Core的測試軟體
Cinebench R15 CPU Test Results
3990X@4.0GHz之 Cinebench R15 CPU Test 12590cb
3990X@4.1GHz之 Cinebench R15 CPU Test 13382cb
對照組 2990WX@4.1GHz之 Cinebench R15 CPU Test 6318cb
對照組 2990WX@5.1GHz之 Cinebench R15 CPU Test 8018cb
對照組 3970X@PBO之 Cinebench R15 CPU Test 7398cb
對照組 3960X@PBO之Cinebench R15 CPU Test 6013cb
對照組 3700X@4.3GHz之 Cinebench R15 CPU Test 2257cb
對照組 3700X@5GHz之 Cinebench R15 CPU Test 2610cb
對照組 10980XE@5.0GHz之 Cinebench R15 CPU Test為 4630cb,Single Core為 219cb
2.CPU-Z Bench
CPU-Z為一個中央處理器、記憶體及主機板資訊的 Windows軟體,在近年新增了 Bench item,提供處理器的簡單測試但精確度較低,測試數據僅供參考
CPU-Z Bench Results
3990X@4.0GHz CPU-Z Benchmark
CPU-Z Bench Single Thread:490.1
CPU-Z Bench Multi Thread:37447.1
3990X@4.1GHz CPU-Z Benchmark
CPU-Z Bench Single Thread:494.1
CPU-Z Bench Multi Thread:37743.1
對照組 2990WX@4.1GHz之
CPU-Z Bench Single Thread:476.4
CPU-Z Bench Multi Thread:18118.5
對照組 3970X@PBO之
CPU-Z Bench Single Thread:525
CPU-Z Bench Multi Thread:21734.8
對照組 3960X@PBO之
CPU-Z Bench Single Thread:532.1
CPU-Z Bench Multi Thread:16590.8
對照組 3700X@5GHz之 CPU-Z Bench Single Thread 615.1分、Multi Thread 6775.4分
對照組 3700X@4.3GHz之 CPU-Z Bench CPU Multi Thread 5835.0分、CPU Single Thread 531.1分
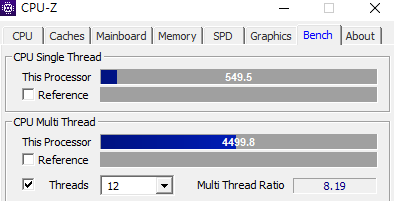
對照組 10980XE@5.0GHz之 CPU-Z Bench CPU Multi Thread為 12593.7分,CPU Single Thread為 596.8分
測試項目 B比較表
測試項目 C:
1.Cinebench R20 Benchmark
2.7-Zip Benchmark
3.X264 FHD Benchmark
4.V-Ray Benchmark
5.Geekbench
測試設定:
3990X@4.0GHz DDR4 3600 128GB同步
3990X@4.1GHz DDR4 3600 32GB同步
對照組 3970X@PBO
對照組 3960X@PBO
對照組10980XE@5GHz
1.Cinebench R20 CPU Test
Cinebench是一個真實的跨平台測試套件,用於評估計算機的硬件功能,現有最新版本已至 R20版本,由於它是 以 Cinema 4D動畫製作軟體為基礎進行測試,所以能夠反應出多線程處理器與顯示卡面對實際應用軟體所能發揮的效能,且能在短時間內得知測試結果,是一個能快速得知是否能 All Core 5GHz的測試軟體
Cinebench Release 20的改進反映了近年來 CPU和渲染技術的整體進步,為 Cinema 4D利用多個 CPU核心和普通用戶可用的現代處理器功能提供了更準確的測量,最重要的是它是免費的
Cinebench R20 CPU Test Results
3990X@4.0GHz之 Cinebench R20 CPU Test 30360pts Single Core 468pts
3990X@4.1Hz之 Cinebench R20 CPU Test 32028pts
對照組 3970X@PBO之 Cinebench R20 CPU Test 17066pts Single Core 512pts
對照組 3960X@PBO之 Cinebench R20 CPU Test 13891pts Single Core 502pts
對照組 10980XE@5.0GHz之 Cinebench R20 CPU Test 10282pts Single Core 539pts
2.7-zip Benchmark
7-zip Benchmark是一個開放原始碼的資料壓縮程式並自帶測試項目的軟體,主要用在 Windows作業系統,在 7-Zip的測試中可看出擁有高頻率及多線程的處理器較具優勢
7-Zip Benchmark Results
3990X@4.0GHz之 7-Zip Benchmark 267157MIPS
對照組 2990WX@4.1GHz 7-Zip Benchmark 96620MIPS
對照組 3970X@PBO之 7-Zip Benchmark:246606MIPS
對照組 3960X@PBO之 7-Zip Benchmark:219193MIPS
對照組 10980XE@5.0GHz之 7-zip Benchmark為 152765MIPS
3.X264FHD Benchmark
X264 FHD Benchmark是一套可以同時測試浮點運算及多媒體的轉檔效能的測試軟體,勉強設定下的處理器頻率與電壓將很難完成測試
X264 FHD Benchmark Results
3990X@4.0GHz之 X264 FHD Benchmark 71.26FPS
對照組 2990WX@4.1GHz之 X264 FHD Benchmark 53.93FPS
對照組 3970X@PBO之 X264 FHD Benchmark:73.22fps
對照組 3960X@PBO之 X264 FHD Benchmark:74.97fps
對照組 10980XE@5GHz之 X264 FHD Benchmark為 79.03fps
4.V-ray Benchmark
V-Ray Benchmark是一款免費的獨立應用程式,可幫助您測試硬件渲染的速度。基準測試包括兩個測試場景:一個用於 V-Ray,另一個用於 V-Ray GPU,具體取決於您要測量的渲染引擎
借助V-Ray Next Benchmark,您可以快速輕鬆地評估運行V-Ray Next的機器性能。了解您的計算機如何與其他人一起排名並了解不同的硬件如何影響您的渲染速度。使用V-Ray Next Benchmark,您可以測試系統的功率和性能,並將組件推向極限
V-Ray Benchmark Results
3990X@3.9GHz之 V-Ray Benchmark 11s
對照組 2990WX@4.1GHz之 V-Ray Benchmark 24s
對照組 3970X@PBO之 V-ray Benchmark:20s
對照組 3960X@PBO之 V-ray Benchmark:25s
對照組 10980XE@5GHz PBO之 V-ray Benchmark:37s
測試項目 C比較表
測試項目 D:
1.SuperPi 32M
2.CPUMrark99
3.AIDA64 Memory Bandwidth Benchmark
測試設定:
3990X@4.5GHz DDR4 3600 128GB同步
對照組 3970X@PBO
對照組 3960X@PBO
對照組 3700X@4.3GHz
對照組10980XE@Boost
1.SuperPi 32M
Superpi 32M
SuperPi 32m是一個計算圓周率的浮點運算程式,最大精確到小數點以後的 3200萬位數,該程式採用高斯-勒讓德演算法,並且於 1995年被日本電腦科學家金田康正使用 Windows環境下計算出精確到 232次方的圓周率,是一款在檢測單工效能時常用的程式,但在需要多工測試時亦可同時開啟多個程式同時運算
SuperPi 32M Results
3990X@4.5GHz之 SuperPi 32M:8m39s579 (Lower is better)
對照組 3970X@PBO之 SuperPi 32M:9m12s (Lower is better)
對照組 3960X@PBO之 SuperPi 32M:8m51s (Lower is better)
對照組 3700X@4.3GHz之 SuperPi 32M:8m53s816 (Lower is better)
對照組 10980XE@Boost之 Superpi 32M為 7m 19.344s (Lower is better)
2.CPUMrk99
CPUMark99是專門用于 Windows的一款運算測試軟體,測試過程簡短且只支援單工
CPUMark99 Results
3990X@4.5GHz之 CPUMark99:778分
對照組 3970X@PBO之 CPUMark99:746分
對照組 3960X@PBO之 CPUMark99:769分
對照組 3700X@4.3GHz之 CPUMark99:763分
對照組 10980XE@Boost之 CPUMark99:811分
3.AIDA64 Memory Bandwidth Benchmark
此基準測試可測量 CPU高速緩存和系統內存的帶寬和延遲。通過雙擊窗口中的任何矩形,列或行,我們可以單獨啟動基準測試或基準測試類型。例如,如果我們雙擊 “Memory”,則只會運行系統內存讀取,寫入,複製和延遲基準測試,即只執行給定行中的操作。同樣,如果我們雙擊 “Read”,則只會對所有內存類型運行讀取基準測試,即只執行給定列中的操作。如果我們雙擊任何矩形,則只會運行選定的單個基準。
右鍵單擊 “Start Benchmark”按鈕將打開一個上下文菜單,我們可以在其中選擇運行所有基準測試或僅運行內存或緩存基準測試
AIDA64 Memory Bandwidth Benchmark Results
3990X 4.5GHz@DDR4 3600 16-20-20-20-40同步
Read: 95459MB/s
Write: 93845MB/s
Copy: 100604MB/s
Latancy: 86.7ns
對照組 3970X PBO@DDR4 3200 14-14-14-34
Read:86765MB/s
Write: 86538MB/s
Copy: 95061MB/s
Latancy: 82.0ns
對照組 3960X PBO@DDR4 3200 14-14-14-34
Read: 88051MB/s
Write: 85965MB/s
Copy: 97231MB/s
Latancy: 81.9ns
對照組 3700X 4.3GHz@DDR4 3600 14-14-14-34同步
Read: 50819MB/s
Write: 28791MB/s
Copy: 49633MB/s
Latancy: 69.3ns
對照組 10980XE 5GHz@DDR4 4000
Read: 110660MB/s
Write: 84117MB/s
Copy: 96265MB/s
Latancy: 60.7ns
測試項目 D比較表
測試項目 E:
1.Final Fantasy XV Benchmark
2.UNIGINE Superposition Benchmark
3.3DMark Time Spy
4.3DMark Port Royal
5.Middle-earth: Shadow of War Benchmark《中土世界:戰爭之影》
6.Rise of the Tomb Raider Benchmark《古墓奇兵:崛起》
7.Assassin's Creed Origins Benchmark《刺客教條:起源》
8.Far Cry 5 Benchmark《極地戰嚎5》
測試設定:
3990X@4.0GHz DDR4 3600 128GB同步
對照組 3970X@PBO
對照組 3960X@PBO
對照組 3700X@4.3GHz
對照組10980XE@5GHz
1.Final Fantasy XV Benchmark
Final Fantasy XV《太空戰士 15》的Benchmark,是一款由史克威爾艾尼克斯在 2016年 11月推出的動作角色扮演遊戲《Final Fantasy系列》的第 15部,依照傳統,太空戰士都有 Benchmark的項目
Final Fantasy XV Benchmark 4K Results
3990X@4.0GHz之 Final Fantasy XV Benchmark:5696分
對照組 3970X@PBO之 Final Fantasy XV Benchmark:5972分
對照組 3960X@PBO之 Final Fantasy XV Benchmark:6081分
對照組 3700X@4.3GHz之 Final Fantasy XV Benchmark:5812分
對照組 10980XE@5GHz之 Final Fantasy XV Benchmark:6204分
2.UNIGINE Superposition Benchmark
UNIGINE是一款專有的跨平台遊戲引擎,由俄羅斯軟件公司 UNIGINE Corp開發。除了用作遊戲引擎外,它還用於虛擬現實系統,嚴肅遊戲和可視化
UNIGINE最強大的功能是它的高級渲染器,支持 OpenGL 4.0和 DirectX 11,Superpositiojn則為 2017版本,包含極端性能和穩定性測試:視頻卡,電源,冷卻系統,檢查預設和超頻模式與真實負載及在環境中的互動體驗
UNIGINE Superposition Benchmark 4K Optimized Results
3990X@4.0GHz之 UNIGINE Superposition Benchmark:10608分
對照組 3970X@PBO之 UNIGINE Superposition Benchmark:11599分
對照組 3960X@PBO之 UNIGINE Superposition Benchmark:11655分
對照組 3700X@4.3GHz之 UNIGINE Superposition Benchmark:11529分
對照組 10980XE@5GHz之 UNIGINE Superposition Benchmark:11807分
3.3DMark Time Spy
3DMark Time Spy用來測試處理器及顯示卡之 3D圖形表現和工作負載,現由 UL擁有,主要是針對 DirectX 12的效能,測試有三個部分,第一個為顆粒陰影、曲面細分等效果,第二個則是光線追蹤的體積光照明技術,最後則是 CPU效能測試,在前兩個測試中,包含了數千萬個頂點跟多邊形,上百萬個曲面細分,這些都是 FireStrike的幾十倍
3DMark Time Spy Results
3990X@4.0GHz之 3DMark Time Spy:12124分
對照組 3970X@PBO之 3DMark Time Spy:10979分
對照組 3960X@PBO之 3DMark Time Spy:13861分
對照組 3700X@4.3GHz之 3DMark Time Spy:13164分
對照組 10980XE@5GHz之 3DMark Time Spy:14128分
4.3DMark Port Royal
3DMark 之 Port Royal加入 DirectX 12 的 DXR(DirectX Raytracing)選用 API 集,能夠於當代遊戲大量使用的光柵化成像,加入即時光影追蹤效果,以便達成視區外物件反射、即時陰影等光柵化無法達成的畫面效果
3DMark Port Royal Results
3990X@4.1GHz之 3DMark Port Royal:8753分
對照組 3970X@PBO之 3DMark Port Royal:5695分
對照組 3960X@PBO之 3DMark Port Royal:8652分
對照組 3700X@4.3GHz之 3DMark Port Royal:8512分
對照組 10980XE@5GHz之 3DMark Port Royal:8800分
5.Middle-earth: Shadow of War Benchmark《中土世界:戰爭之影》
Middle-earth: Shadow of War《中土世界:戰爭之影》亦為一自帶 Benchmark的角色扮演遊戲,是由 Monolith Productions開發並由華納兄弟互動娛樂發行並於 2017年 10月 10日在全球發布
Middle-earth: Shadow of War Benchmark Setting
Middle-earth: Shadow of War Benchmark 1080P Results
3990X@4.0GHz之 Middle-earth: Shadow of War Benchmark:144fps
對照組 3970X@PBO之 Middle-earth: Shadow of War Benchmark:148fps
對照組 3960X@PBO之 Middle-earth: Shadow of War Benchmark:156FPS
對照組 3700X@4.3GHz之 Middle-earth: Shadow of War Benchmark:143fps
對照組 10980XE@5GHz之 Middle-earth: Shadow of War Benchmark:162fps
6.Rise of the Tomb Raider Benchmark《古墓奇兵:崛起》
Rise of the Tomb Raider《古墓奇兵:崛起》,是一款由晶體動力開發,微軟工作室和史克威爾艾尼克斯合作發行的動作冒險遊戲,同樣自帶測試軟體,本作是 2013年《古墓奇兵》的續作
Rise of the Tomb Raider Benchmark Setting
Rise of the Tomb Raider Benchmark 1080P Overall fps Results
3990X@4.0GHz之 Rise of the Tomb Raider Benchmark Overall Score: 206.91fps
對照組 3970X@PBO之 Rise of the Tomb Raider Benchmark Overall Score: 224.51fps
對照組 3960X@PBO之 Rise of the Tomb Raider Benchmark Overall Score: 236.10fps
對照組 3700X@4.3GHz之 Rise of the Tomb Raider Benchmark Overall Score: 191.70fps
對照組 10980XE@5GHz之 Rise of the Tomb Raider Benchmark Overall Score: 236.98fps
7.Assassin's Creed Origins Benchmark《刺客教條:起源》
Assassin's Creed Origins《刺客教條:起源》中國大陸譯作「刺客信條:起源」)是一部由育碧蒙特婁開發由育碧公司發行的動作冒險遊戲
本作是刺客教條主系列的第十部作品,也是系列首次把時間線推前到刺客教條初代以前,同樣也自帶有測試軟體,遊戲的舞台是在托勒密王朝埃及豔后統治下的埃及,玩家所操控的角色是一位隸屬於法老的護衛,稱為守護者(Medjai),來自錫瓦(Siwa)名為巴耶克(Bayek)的埃及刺客
Assassin's Creed Origins Benchmark Setting
Assassin's Creed Origins Benchmark 1080P Results
3990X@4.0GHz之 Assassin's Creed Origins Benchmark:13125分
對照組 3970X@PBO之 Assassin's Creed Origins Benchmark:13499分
對照組 3960X@PBO之 Assassin's Creed Origins Benchmark為:13557分
對照組 3700X@4.3GHz之 Assassin's Creed Origins Benchmark為:10882分
對照組 10980XE@5GHz之 Assassin's Creed Origins Benchmark為:14079分
8.Far Cry 5 Benchmark《極地戰嚎5》
Far Cry 5《極地戰嚎5》是一個自帶 Benchmark的新遊戲,是由育碧蒙特婁、育碧多倫多開發和育碧軟體發行的開放世界第一人稱動作冒險遊戲
Far Cry 5 Benchmark Setting 1080P
Far Cry 5 Benchmark 1080P Results
3990X@4.0GHz之 Far Cry 5 Benchmark 不相容
對照組 3970X@4.0GHz之 Far Cry 5 Benchmark 不相容
對照組 3960X@PBO之 Far Cry 5 Benchmark 86fps
對照組 3700X@4.3GHz之 Far Cry 5 Benchmark 133fps
對照組 10980XE@5GHz之 Far Cry 5 Benchmark 152fps
測試項目 E比較表
結論:
經過冗長的實測之後,我們看到 3990X在 4.0~4.1GHz的表現硬是比官方在簡報中所介紹(請參考本文前面的官方效能介紹)的效能高出了許多,接著我們再來看看 3990X VS 10980XE在創作及多工的效能比對
a.在創作方面
3990X在 Corona Benchmark 3990X的得分是 10980X的 2.1倍
在 POV-Ray Benchmark 3990X的得分是 10980X的 1.49倍
在 V-Ray Benchmark 3990X的得分是 10980X的 3.36倍
3990X VS 10980XE在創作效能比對
b.在多工方面
3990X在多工效能上與其他核心數的處理器相比
64核心 3990X在 Cinebench R15的得分 13328cb是 32核心 3970X 7398cb的 1.8倍,是 8核心 3700X 2610cb的 5.10倍,是 18核心10980XE 4630cb的 2.88倍
在 Cinebench R20 64核心3990X的得分 32028pts是 32核心 3970X 17066pts的 1.88倍,是 18核心10980XE 10282pts的 3.11倍
在 CPU-Z Bench 64核心 3990X的得分 37447.1是 32核心 3970X 21734的 1.72倍,是 18核心10980XE 12593的 2.97倍
在 7-Zip Benchmark 64核心 3990X的得分 267157MIPS是 32核心 3970X 246606MIPS的 1.08倍,是 18核心10980XE 152765MIPS的 1.75倍
3990X VS 10980XE在多工效能比對
綜合以上,我們看到核心數愈多的處理器對創作者的幫助愈大(當然頻率愈高幫助也愈大)但核心數愈多(頻率愈高)的處理器其所產生的功耗也將愈大,尤其是超頻至 4.0GHz以後其功耗更是不容小覷,經過滄者極限監測 3990X在 4.0GHz以上的多工測試,其功耗動輒高達 1000W以上,因此要超頻的使用者建議搭配 1200W以上的電源供應器是必須的,對不想超頻的使用者來說 800W的電源供應器就已經足夠
在處理器的散熱方面要注意的是散熱器底部的面積要足以覆蓋處理器晶片,散熱器扣具的磅數也要足夠,就這二點來說,Wraith Ripper官方風冷散熱器就絕對會比一般 AIO水冷散熱器來的好
高核心數處理器的存在其實是有必要的,對創作者而言只要能加快執行力、減少創作時間對創作者來說就是好貓,尤其是在看過 3990X多工實測之後,售價哪怕是再比現在多一倍相信創作者也會買單,雖然愈多的核心數會增加愈多的功耗,並降低更多的基礎頻率與超頻幅度,但好在的是對創作者而言只要能加快執行力、減少創作時間才是首要
負責技術與工程的 AMD技術長暨執行副總裁 Papermaster曾表示,未來將會有更多軟體支援多核心加快處理程序,更多的應用程式支援多核心多執行緒,所以多核心在短期內還看不到飽和點,的確 Papermaster說的沒錯,只要保持內核數量以及軟體效能之間的平衡,這種多核心的趨勢應該繼續下去;但未來再繼續開發多核心數處理器的同時,不論是哪個廠商都將面臨半導體製程升級的難度愈來愈大,開發成本愈來愈高的狀況,而這些難度與狀況是否會讓 64核心的 3990X成為各廠商在短期內不想跨越、或是難以跨越的門檻,且讓我們繼續看下去